Transcription
Liu et al. BMC Nephrology(2020) SEARCH ARTICLEOpen AccessHeart rhythm complexity as predictors forthe prognosis of end-stage renal diseasepatients undergoing hemodialysisHongyun Liu1, Ping Zhan1, Jinlong Shi2, Minlu Hu1, Guojing Wang1 and Weidong Wang1*AbstractBackground: Heart rhythm complexity, a measure of heart rate dynamics and a risk predictor in various clinicaldiseases, has not been systematically studied in patients with end-stage renal disease. The aim of this study is toinvestigate the heart rhythm complexity and its prognostic value for mortality in end-stage renal disease patientsundergoing hemodialysis.Methods: To assess heart rhythm complexity and conventional heart rate variability measures, 4-h continuouselectrocardiography for a retrospective cohort of 202 ostensibly healthy control subjects and 51 hemodialysispatients with end-stage renal disease were analyzed. Heart rhythm complexity was quantified by the complexityindex from the measurement of the multiscale entropy profile.Results: During a follow-up of 13 months, 8 people died in the patient group. Values of either traditional heart ratevariability measurements or complexity indices were found significantly lower in patients than those in healthycontrols. In addition, the complexity indices (Area 1–5, Area 6–15 and Area 6–20) in the mortality group weresignificantly lower than those in the survival group, while there were no significant differences in traditional heartrate variability parameters between the two groups. In receiver operating characteristic curve analysis, Area 6–20(AUC 0.895, p 0.001) showed the strongest predictive power between mortality and survival groups.Conclusion: The results suggest that heart rhythm complexity is impaired for patients with end-stage renal disease.Furthermore, the complexity index of heart rate variability quantified by multiscale entropy may be a powerfulindependent predictor of mortality in end-stage renal disease patients undergoing hemodialysis.Keywords: Complexity, Multiscale entropy, End-stage renal disease, Autonomic nervous system, Heart ratevariabilityBackgroundEnd-stage renal disease (ESRD), characterized by permanent loss of renal function, is the final stage inchronic kidney disease that becomes a global healthproblem with increasing prevalence [1]. Despite recentprogress in medical management and dialysis therapy* Correspondence: wang weidong301@163.com1Research Center for Biomedical Engineering, Medical Innovation & ResearchDivision, Chinese PLA General Hospital, Fuxing Road, Beijing 100853, ChinaFull list of author information is available at the end of the articletechnique, mortality rates remain high in ESRD patientsundergoing hemodialysis. The major causes of ESRD arelargely the same causes that contribute to cardiovasculardisease [2]. In addition, sudden cardiac death is commonin patients receiving hemodialysis and may account forabout 30% of overall mortality, which could partly oweto the impairment of the autonomic nervous system(ANS) [3–5]. Identification of high-risk patients withESRD is of clinical importance and considerable practical value in strengthening their treatment strategies. The Author(s). 2020 Open Access This article is licensed under a Creative Commons Attribution 4.0 International License,which permits use, sharing, adaptation, distribution and reproduction in any medium or format, as long as you giveappropriate credit to the original author(s) and the source, provide a link to the Creative Commons licence, and indicate ifchanges were made. The images or other third party material in this article are included in the article's Creative Commonslicence, unless indicated otherwise in a credit line to the material. If material is not included in the article's Creative Commonslicence and your intended use is not permitted by statutory regulation or exceeds the permitted use, you will need to obtainpermission directly from the copyright holder. To view a copy of this licence, visit http://creativecommons.org/licenses/by/4.0/.The Creative Commons Public Domain Dedication waiver ) applies to thedata made available in this article, unless otherwise stated in a credit line to the data.
Liu et al. BMC Nephrology(2020) 21:536Patients with ESRD undergoing chronic hemodialysisis usually present a dysfunction of the ANS, exhibited aslow parasympathetic/vagal modulation associated withhigh sympathetic modulation of the heart rate assessedby heart rate variability (HRV) analysis [6–8]. Severalprevious studies have used HRV parameters based ontraditional linear HRV analysis to predict patient outcomes and found that lower HRV is related to an increased risk of cardiovascular and all-cause mortality inpatients with ESRD receiving chronic hemodialysis [9–13]. However, the regulation of heart rate by the ANS isconsidered to be a non-linear physiological process withcomplexity. Recently, multiscale entropy (MSE) measures quantify multiple spatial and temporal scale complexity of heart rate dynamics, have been introduced asnew risk stratifiers [14, 15]. At present, MSE has beenextensively applied in the assessment of heart rhythmcomplexity in heart failure, stroke, myocardial infarction, epilepsy and other diseases for predicting patientoutcomes [16–19]. Previous studies have also demonstrated that MSE parameters have greater predictivepower than conventional HRV measures for riskstratification and prognosis [19, 20]. Heart rhythmcomplexity impairment has been associated with adverse outcomes in clinical settings. However, its potential relation to the increased risk of death in ESRDpatients undergoing hemodialysis may be underappreciated and need to be further elucidated. Therefore,the aim of the present study was to investigate theheart rate complexity derived from MSE analysis oflong-term electrocardiograms (ECG) and its prognostic value for all-cause mortality in patients with ESRDreceiving hemodialysis therapy.MethodsThe study protocol and populationHealthy database (THEW identification: E-HOL-030202-003) with 202 24-h ECG recordings and ESRDdatabase (THEW identification: E-HOL-03-0202-016)contains 51 48-h long-term ECG recordings were selected from the Telemetric and Holter ECG Warehouse (THEW, http://thew-project.org/datab ases.htm)at University of Rochester. Raw ECG data, as well asautomated beat annotations reviewed and adjudicatedmanually, are available in both databases. All humandata were obtained retrospectively from completed,Institutional-Review-Board-approved clinical researchstudies with subject de-identification. These trialscomplied with the Declaration of Helsinki and allsubjects signed informed consent documents.The ESRD database comprises Holter recordings witha sampling frequency of 1000 Hz from 51 ESRD patientswith a high risk of death. All 51 ESRD patients underwent high-resolution 12-lead 48-h continuous ECGPage 2 of 11monitoring, and THEW provides 12-lead raw ECG andheartbeat interval data. ESRD subjects receivinghemodialysis confirmed the history of diabetes or hypertension requiring treatment entered into this study. TheESRD patients were enrolled from February 13, 2009 toJune 18, 2010, and they completed their 13-monthfollow-up evaluation. All patients Exclusion criteria included a history of chronic atrial fibrillation, with class Iantiarrhythmic, pacemaker, implantable cardioverterdefibrillator device, cardiac resynchronization therapydevice, female subject of childbearing potential not usingmedically prescribed contraceptive measures and subjectunable to cooperate with the protocol due to dementia,psychological, or other related reason. The Healthydatabase comprises 24-h Holter recordings from 202 ostensibly healthy subjects. Subjects had (1) no overtcardiovascular disease or history of cardiovascular disorders; (2) no reported medications, history of high bloodpressure and chronic illness, (3) a normal physical examination, (4) a 12-lead ECG showing sinus rhythm withnormal waveforms (or a normal echocardiogram andnormal ECG exercise testing in the presence of anyquestionable findings ECG changes). The ECG signalswere recorded at a sampling frequency of 200 Hz. Inorder to reduce the influence of gender and age on ECGparameters, we try to match each ESRD patient with ahealthy control with the same gender and close age.After excluding the poor signal quality and incompleteECG recordings, 51 ostensibly age-matched healthy control subjects were selected from 202 healthy subjects andeventually enrolled in the present study.ECG preprocessingAll long-term ECG recordings were analyzed withKubios (Kubios 2.2, University of Eastern Finland, Kuopio), on which R waves were detected and labeled automatically. Heart-beat interval between 300 and 2000 ms,consecutive heart-beat interval differences 200 ms, andprolongations or shortenings 20% than the average offive preceding sinus rhythm heart-beat intervals wereconsidered as sinus rhythm QRS complexes [21]. Thereafter, automatic annotated results were carefully visualinspected and manually corrected by editing ectopicbeats, arrhythmias and noise to suppress computationalerrors. Four-hour episodes of heart-beat intervals without naps and exercise within daytime (between 8 a.m.and 5 p.m.) were extracted from each recording for MSEand traditional HRV analysis [18, 19]. The 4-h ECG recordings of ESRD patients used in the present studywere selected after the ideal body weight to reduce theinfluence of volume overload on HRV. All ECG segments were selected from the same period to reduce theconfounding effects that may occur due to sleep or diurnal rhythm. Furthermore, four-hour ECG segments of
Liu et al. BMC Nephrology(2020) 21:536patients with ESRD after hemodialysis sessions whileperforming their usual daily activities were used for further analysis.Traditional HRV analysisTraditional techniques of HRV analysis are grouped intothe time domain, frequency domain, and non-linearmethods. The time-domain measures including meanheartbeat intervals (Mean RR), standard deviation of theheartbeat intervals (SDNN), square root of the mean ofsum of squares of the differences between adjacentheartbeat intervals (RMSSD), and percentage of the absolute change in consecutive heartbeat interval exceeds50 ms (pNN50) were calculated to represent the totalvariance and vagal modulation of heart rate [22]. Basedon the Fast Fourier transform spectrum, the frequencydomain measures were computed from the power spectral density estimate for each frequency band includingabsolute power values of very low frequency (VLF,0.0033–0.04 Hz), low frequency (LF, 0.04–0.15 Hz), highfrequency (HF, 0.15–0.40 Hz) bands, total power (TP,0.0033–0.40 Hz) and LF/HF power ratio [22]. The VLF,LF, HF and TP were also transformed in natural logarithmic (ln) value. Five traditional non-linear measureswere also taken into consideration to characterize theproperties of HRV. SD1 denotes the short-term variability caused by respiration, whereas SD2 denotes the longterm variability with both calculated through the Poincaré plot method [23]. Approximate entropy (ApEn)quantifies the single-scale complexity or regularity of theHRV time series by measuring the unpredictability offluctuation patterns, and more uncorrelated randomHRV signals usually produce higher ApEn value [24]. Asa technique for characterizing the nature of long-rangecorrelations in time series, detrended fluctuation analysis(DFA) was applied in the present study to quantify slopeα1 and α2 for characterizing the short-term and longterm fluctuations of HRV signal, respectively [25].MSE analysisThe MSE technique was proposed to characterize complex structure of non-linear and non-stationary physiological signals in different temporal scales that ignoredby traditional entropy methods. It comprises of twosteps: 1) coarse-graining the time series in finite lengthinto different time scales; 2) quantifying the degree of irregularity in each coarse-grained time series by sampleentropy calculations [14, 15]. The quantified entropyvalues of coarse-grained time series then are representedas the function of time scale factors to evaluate the complex structure of physiological time series, and the features of the MSE curve can be extracted for clinicalcategorization in several diseases [16–19]. In-depth, details of this methodology have been previously describedPage 3 of 11[14, 15]. In the present study, the complexity index (CI)of the HRV time series were quantified by curve fittingand calculating the area between the MSE curve and theaxis of scale factors [18, 19]. The linear-fitted slope(Slope 5) and the area under the MSE curve betweenscales 1 and 5 (Area 1–5) were calculated to quantify theshort-term complexity and to characterize the shortscale modulation pattern. Long time scale complexitywas quantified by the fitted area under the MSE curvebetween scales 6 and 15 (Area 6–15) and between scales6 and 20 (Area 6–20), respectively. Since low frequencydrifts, high frequency non-stationarities and generalhidded trends longer than 2 h may lead to incorrectly increased irregularity and diminished sequence matchingmanifesting unpredictable effects on calculated sampleentropy values. Empirical mode decomposition (EMD) issuitable for decomposition of non-stationary, non-linearphysiologic time series and possesses advantages overwavelet and Fourier analysis because it employs a fullyadaptive approach derived by means of a sifting process.In order to remove such effects, we used empirical modedecomposition (EMD) method for raw HRV time seriesfiltering before performing MSE [18, 19].Statistical analysisClinical data and parameters of ECG recordings werepresented as median (25th and 75th percentiles). Gaussian distribution and homogeneity of variance tests wereapplied to determine the distribution and homoscedasticity of sample data. As a result of the non-normal distribution and heterogeneity of variance of some sampledata, continuous variables were compared between different groups by the Mann-Whitney U test. For singlepredictive variable analysis using qualitative or categorical variables, Fisher’s exact tests were applied for comparison between different groups. Correlations betweenclinical variables and independent factors that predictingall-cause death for ESRD patients were performed usingSpearman’s correlation tests. The receiver operatingcharacteristics (ROC) curve was created based on thesensitivity and specificity of HRV measures in predictingall-cause death in ESRD patients undergoinghemodialysis. The area under the ROC curve (AUC)gave an estimate of the overall discriminate ability(AUC 0.5 indicates no discrimination and an AUC 1.0 indicates a perfect diagnostic test). Statistical analyseswere performed using SPSS version 20 software package(SPSS, Chicago, Ill, USA). The maximal hazards ratioand independent correlation of variables with mortalitywas determined by Cox regression analysis. Then,Kaplan-Meier event probability curves and log rank analysis of the dichotomized groups were obtained. For allstatistical analysis, p values were corrected by the false
Liu et al. BMC Nephrology(2020) 21:536Page 4 of 11discovery rate (FDR) method for multiple comparisonsand p 0.05 was considered significant.ResultsStudy populationEventually, a total of 51 ESRD patients and 51 ostensibly healthy control subjects were enrolled in thepresent study. After a follow-up period of around 13months, 8 (15.7%) patients died in the ESRD group.There were 4 cardiac-related deaths and the other 4patients died for unknown reasons. As shown inTable 1, ideal body weight, body mass index (BMI)and pre-dialysis systolic blood pressure (BP SYS)values were significantly higher in ESRD patientswhile the prevalence of smoking (11.8% vs. 39.2%, p 0.001) was lower in ESRD group. However, there wereno significant differences in gender, age, height and predialysis diastolic blood pressure (BP DIA) between theESRD and healthy groups. Detail information on demographic data, clinical characteristics, and laboratory dataprior to hemodialysis for ESRD patients including bothsurvival and mortality groups are presented in Table 2. Noclinical variable was significantly different between thesetwo groups (survival and mortality).Table 1 Demographic data and basic characteristics of ESRD patients and healthy control subjectsVariablesESRD patients(n 51)Healthy control subjects(n 51)P valueMale/female30/2124/270.321Age (year)57 (52–67)58 (52–65)0.859Height (cm)169 (162–177)168 (159–175)0.451Weight (kg)82 (72–97)70 (64–83) 0.0012BMI (kg/m )29.37 (24.39–33.47)25.30 (23.62–27.48) 0.001BP SYS (mmHg)143 (127–169)120 (118–140) 0.001BP DIA (mmHg)73 (65–88)80 (75–80)0.227Smoking, n (%)6 (11.8)20 (39.2)0.003Diabetes Mellitus, n(%)32 (62.7%)N.AN.AHypertension, n(%)51 (100%)N.AN.ALVEF (%)60 (55–65)N.AN.ADuration of dialysis (year)2 (3–6)N.AN.AKt/V1.42 (1.24–1.61)N.AN.AURR (%)74 (70–79)N.AN.AnPCR0.85 (0.72–0.97)N.AN.ASodium (mEq/dL)139 (137–141)N.AN.APotassium (mEq/dL)5.1 (4.4–5.4)N.AN.AChloride (mEq/dL)100 (97–103)N.AN.ABicarbonite (mEq/dL)26 (22–29)N.AN.ABlood Urea Nitrogen (mg/dL)58 (45–72)N.AN.ACreatinine (mg/dL)8.3 (6.6–10.4)N.AN.AGlucose (mg/dL)106 (88–137)N.AN.ACalcium (mg/dL)8.7 (8.3–9.2)N.AN.APhosphate (mg/dL)5.3 (4.3–6.2)N.AN.ACalcium Phosphate Product44.7 (35.6–51.1)N.AN.AAlbumin (g/dL)4.0 (3.8–4.2)N.AN.AHemoglobin (g/dL)11.7 (11.0–12.3)N.AN.AHematocrit (%)36.0 (34.0–38.0)N.AN.Aβ-blocker, n (%)34 (66.7)N.AN.ACCB, n (%)25 (49.0)N.AN.AACEI, n (%)15 (29.4)N.AN.AESRD end-stage renal disease, BMI body mass index, BP SYS systolic blood pressure, BP DIA diastolic blood pressure, N.A not applicable, LVEF left ventricularejection fraction, URR urea reduction ratio, nPCR normalized protein catabolic rate, CCB calcium channel blocker, ACEI angiotensin-converting-enzyme inhibitor
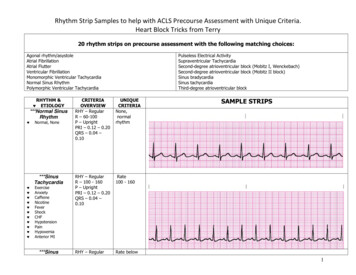
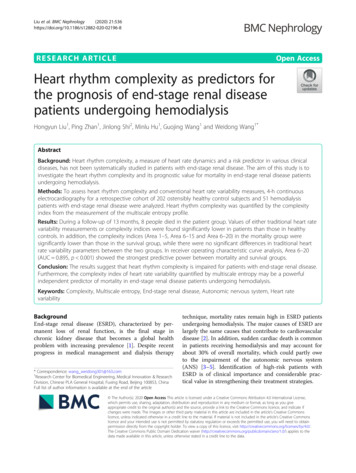
Liu et al. BMC Nephrology(2020) 21:536Page 5 of 11Table 2 Clinical data of the ESRD patients in survival and mortality groupsVariablesSurvival(n 43)Mortality(n 8)P valueMale/female25/185/31.000Age (year)55 (52–65)66 (62–70)0.087Height (cm)170 (162–178)168 (166–171)0.595Weight (kg)83 (72–101)76 (65–93)0.223BMI (kg/m2)30.22 (24.39–34.29)26.28 (24.09–31.76)0.214BP SYS (mmHg)141 (127–169)146 (123–183)0.866BP DIA (mmHg)77 (69–83)71 (58–88)0.517Smoking, n (%)5 (11.6)1 (12.5)1.000Diabetes Mellitus, n (%)25 (58.1)7 (87.5)0.672Hypertension, n (%)43(100)8 (100)1.000Duration of dialysis (year)3 (2–6)3 (2–7)0.793LVEF (%)60 (55–64)62 (51–85)0.370Kt/V1.42 (1.24–1.61)1.44 (1.25–1.64)0.776URR (%)74 (70–79)75 (69–80)0.640nPCR0.85 (0.69–0.96)0.95 (0.76–1.05)0.158Sodium (mEq/dL)139 (137–141)139 (137–142)0.886Potassium (mEq/dL)5.0 (4.4–5.3)5.2 (4.5–5.5)0.357Chloride (mEq/dL)100 (97–103)100 (97–103)0.897Bicarbonite (mEq/dL)27 (23–29)22 (21–25)0.065Blood Urea Nitrogen (mg/dL)56 (43–70)70 (50–89)0.214Creatinine (mg/dL)8.3 (6.6–9.5)9.0 (6.6–11.0)0.595Glucose (mg/dL)106 (88–143)110 (81–136)0.698Calcium (mg/dL)8.8 (8.4–9.2)8.6 (6.8–9.1)0.232Phosphate (mg/dL)5.2 (3.9–6.0)5.6 (4.8–6.6)0.249Calcium Phosphate Product44.5 (35.5–51.3)46.0 (42.0–49.7)0.679Albumin (g/dL)4.0 (3.8–4.2)4.0 (3.5–4.3)0.630Hemoglobin (g/dL)11.7 (10.9–12.3)11.6 (11.2–12.7)0.688Hematocrit (%)36.0 (33.0–38.0)37.0 (36.0–39.0)0.076β-blocker, n (%)29 (67.4)5 (62.5)0.541CCB, n (%)20 (46.5)5 (62.5)0.329ACEI, n (%)13 (30.2)2 (25.0)0.565ESRD end-stage renal disease, LVEF left ventricular ejection fraction, URR urea reduction ratio, nPCR normalized protein catabolic rate, CCB calcium channel blocker,ACEI angiotensin-converting-enzyme inhibitorHolter dataThe results of traditional HRV and MSE analyses inESRD and healthy groups are presented in Table 3 andFig. 1. For traditional HRV parameters and CI derivedfrom the MSE profiles, ESRD patients had significantlylower SDNN, RMSSD, pNN50, VLF, LF, HF, TP, LF/HF,SD1, SD2, α1, Slope 5, Area 1–5, Area 6–15 and Area6–20 in comparison to the healthy control subjects. Incontrast, patients with ESRD had significantly higherApEn and α2 values than those of healthy controls (allp 0.05, Table 3). The ESRD patients exhibited significantly reduced entropy values over most of the timescales, except scale 1, 2, 13 and 14 (Fig. 1). In addition,all of the average MSE curves of ESRD group had a pattern of an initial decrease which is different from that ofthe healthy control group.For all the analyzed traditional HRV analyses, therewere no significant differences between the survival andmortality groups (all p 0.05, Table 4). For MSEanalysis, the entropy values were significantly lower overdifferent time scales in the mortality group (Fig. 1).Meanwhile, the mortality group had significantly lowerCI including Area 1–5 (2.49 (1.79–3.68) vs. 4.11 (3.36–4.72), p 0.002), Area 6–15 (7.39 (6.27–9.92) vs. 11.92
Liu et al. BMC Nephrology(2020) 21:536Page 6 of 11Table 3 Traditional HRV measurements and CI over 4-h continuous ECG recordings for ESRD patients and healthy control subjectsVariablesESRD patients(n 51)Healthy control subjects(n 51)P valueTraditional HRV analysisMean RR (msec)779 (733–858)754 (690–836)0.137SDNN (msec)36 (28–50)71 (59–95) 0.001RMSSD (msec)12 (8–15)18 (13–29) 0.001pNN50 (%)0.14 (0.02–1.06)1.77 (0.42–6.64) 0.001VLF (msec2)18 (10–41)68 (45–142) 0.001LF (msec2)50 (23–178)333 (234–790) 0.001HF (msec2)34 (14–65)106 (46–270) 0.001TP (msec2)109 (55–280)511 (376–1232) 0.001 0.0012lnVLF (msec )2.88 (2.32–3.69)4.23 (3.85–4.84)lnLF (msec2)3.91 (3.17–5.17)5.81 (5.46–6.61) 0.001lnHF (msec2)3.51 (2.68–4.13)4.67 (3.86–5.48) 0.001lnTP (msec2)4.69 (4.10–5.62)6.24 (5.94–7.11) 0.001LF/HF1.68 (0.84–3.96)3.42 (2.37–6.85) 0.001SD1 (msec)8 (5–10)12 (9–20) 0.001SD2 (msec)14 (10–23)31 (26–47) 0.001ApEn1.47 (1.36–1.52)1.36 (1.27–1.46) 0.001α11.07 (0.83–1.26)1.32 (1.15–1.49) 0.001α20.62 (0.49–0.71)0.52 (0.46–0.61)0.0050.04 ( 0.04–0.08)0.10 (0.07–0.15) 0.0010.004MSE analysisSlope 5Area 1–53.90 (3.29–4.49)4.39 (3.95–5.24)Area 6–1511.62 (9.13–12.85)12.63 (11.42–13.65)0.013Area 6–2018.10 (14.34–20.28)19.79 (18.19–21.70)0.017ESRD end-stage renal disease, HRV heart rate variability, Mean RR mean heartbeat intervals, SDNN standard deviation of the heartbeat intervals, RMSSD square rootof the mean of sum of squares of the differences between adjacent heartbeat intervals, pNN50 percentage of the absolute change in consecutive heartbeatinterval exceeds 50 ms, VLF very low frequency, LF low frequency, HF high frequency, TP total power, ApEn approximate entropy, MSE multiscale entropyFig. 1 The sample entropy over different time scales. The orange square open symbols represented the entropy of patients with ESRD, and thelight blue open circles the entropy of healthy control subjects. The green open squares represented the entropy of the survival group aftersession hemodialysis treatment, and the pink solid squares the entropy of the mortality group after session hemodialysis treatment. Symbolspffiffiffirepresent the mean values of entropy for each group and bars represent the standard error (SE ¼ SD n, where n is the number of subjects).*p 0.05, **p 0.01, and ***p 0.001 for comparison between groups
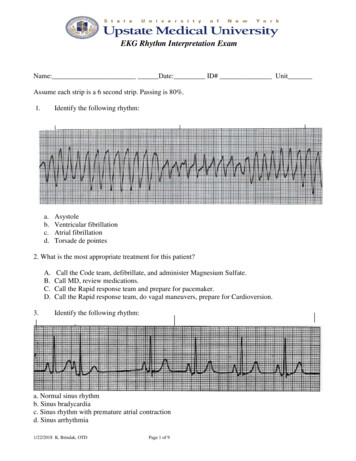
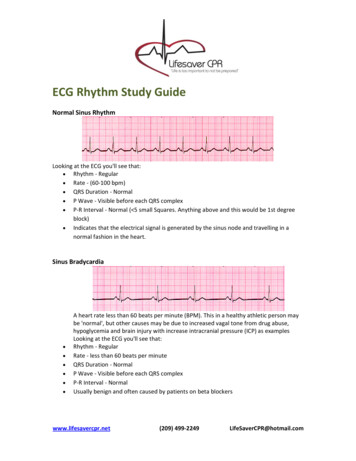
Liu et al. BMC Nephrology(2020) 21:536Page 7 of 11Table 4 Traditional HRV measurements and CI over 4-hcontinous ECG recordings for the study subjects in survival andmortality groupsVariablesSurvival(n 43)Mortality(n 8)P valueTraditional HRV analysisMean RR (msec)779 (732–885)795 (753–852)0.846SDNN (msec)34 (26–48)43 (35–53)0.143RMSSD (msec)13 (8–15)9 (6–19)0.445pNN50 (%)0.14 (0.02–1.06)0.07 (0.01–3.97)0.917VLF (msec2)21 (10–51)11 (4–22)0.117LF (msec2)53 (25–183)29 (11–70)0.344HF (msec2)34 (16–65)16 (7–102)0.526TP (msec2)141 (70–311)67 (32–155)0.271lnVLF (msec2)3.02 (2.36–3.82)2.43 (1.76–2.79)0.119lnLF (msec2)3.96 (3.23–5.20)3.37 (2.77–4.07)0.351lnHF (msec2)3.52 (2.85–4.10)2.76 (2.31–4.26)0.533lnTP (msec )4.95 (4.25–4.95)4.18 (3.71–4.98)0.277LF/HF1.92 (0.85–3.97)1.41 (0.46–3.46)0.460SD1 (msec)9 (5–10)6 (4–14)0.476SD2 (msec)15 (10–23)11 (7–16)0.344ApEn1.47 (1.36–1.52)1.45 (1.36–1.49)0.430α11.07 (0.83–1.27)1.04 (0.57–1.21)0.476α20.64 (0.52–0.71)0.59 (0.34–0.73)0.445Slope 50.05 (0.04–0.09)0.02 (0.05–0.07)0.509Area 1–54.11 (3.36–4.72)2.49 (1.79–3.68)0.002Area 6–1511.92 (10.16–13.69)7.39 (6.27–9.92) 0.001Area 6–2018.78 (16.63–21.60)11.96 (9.84–15.54) 0.0012MSE analysisHRV heart rate variability, Mean RR mean heartbeat intervals, SDNN standarddeviation of the heartbeat intervals, RMSSD square root of the mean of sum ofsquares of the differences between adjacent heartbeat intervals, pNN50percentage of the absolute change in consecutive heartbeat interval exceeds50 ms, VLF very low frequency, LF low frequency, HF high frequency, TP totalpower, ApEn approximate entropy, MSE multiscale entropy(10.16–13.69), p 0.001) and Area 6–20 (11.96 (9.84–15.54) vs. 18.78 (16.63–21.60), p 0.001) than those ofsurvival group (Table 4). Furthermore, the above independent risk factors or predictors derived from MSEquantification did not significantly correlate with anyclinical variables observed in the study (all p 0.05,Table 5).The ROC curves of the predictive parameters (Area1–5, Area 6–15 and Area 6–20) were depicted in Fig. 2.Area 6–20 (AUC 0.895) showed the best overall discriminative power than Area 1–5 (AUC 0.858) andArea 6–15 (AUC 0.892) in the outcome prediction forESRD patients receiving hemodialysis. Figure 3 showedKaplan-Meier survival curves for all-cause death according to the contribution of Area 6–20. For the ESRD patients undergoing hemodialysis, survival seems to beTable 5 Correlations between MSE parameters and clinicalcharacteristicsVariablesESRD patients (n 51)Area 1–5Area 6–15Area 6–20Age (year)0.061 0.024 0.050BP SYS (mmHg) 0.100 0.152 0.133BP DIA (mmHg) 0.0800.0390.055BMI (kg/m2)0.017 0.152 0.134LVEF (%) 0.058 0.061 0.069Duration of dialysis (year)0.1120.2130.235Kt/V0.022 0.045 0.038URR (%)0.2220.0380.009nPCR 0.183 0.219 0.219Sodium (mEq/dL)0.0960.0830.099Potassium (mEq/dL) 0.163 0.128 0.113Chloride (mEq/dL) 0.121 0.0050.005Bicarbonite (mEq/dL)0.1970.1060.111Blood Urea Nitrogen (mg/dL) 0.172 0.081 0.060Creatinine (mg/dL)0.0390.0680.072Glucose (mg/dL) 0.130 0.129 0.117Calcium (mg/dL)0.1020.1830.165Phosphate (mg/dL) 0.049 0.131 0.138Calcium Phosphate Product0.019 0.098 0.112Albumin (g/dL)0.1180.0870.071Hemoglobin (g/dL) 0.018 0.075 0.080Hematocrit (%) 0.045 0.232 0.243Values are correlation coefficients; ***p 0.001; **p 0.01; *p 0.05. ESRD endstage renal disease, BMI body mass index, BP SYS systolic blood pressure,BP DIA diastolic blood pressure, LVEF left ventricular ejection fraction, URRurea reduction ratio, nPCRnormalized protein catabolic raterelated to whether the values of Area 6–20 were low ( 13.43). Cox regression analysis demonstrated that ESRDpatients with Area 6–20 13.43 had a higher risk ofdeath (4.8% vs. 66.7%) than those with Area 6–20 13.43 (Hazard ratio 13.61, 95% CI: 2.74–67.77). However, no statistical risk factors were found in data ofdemographic characteristics, baseline clinical evaluation,or laboratory tests. The Area 6–20 may be a significantindependent predictor of all-cause mortality for patientswith ESRD, and when the cut-off value of Area 6–20was set at 13.43, the sensitivity and specificity were 88.4and 75%, respectively.DiscussionTo our knowledge, this is the first report to explore thepredictive value of heart rhythm complexity quantifiedby MSE analysis in chronic hemodialysis ESRD patients.The results of the present study confirm that heartrhythm complexity and cardiac autonomic function areimpaired in patients with ESRD. Importantly, the
Liu et al. BMC Nephrology(2020) 21:536Fig. 2 Analysis of the discrimination power of the survival andmortality by receiver operating characteristic (ROC) curve analysis.The areas under the curve of Area 1–5, Area 6–15 and Area 6–20were 0.858, 0.892 and 0.895, respectivelydeterioration of heart rhythm complexity seems to be related to a increased risk of subsequent motality. Specifically Area 6–20 among all the analyzed measures of HRVmay be a predictor of increased mortality risk for allcause death in ESRD patients. Undergoing sessionhemodialysis, which is complementary to existing riskstratification strategies.The dynamic balance of ANS plays a sophisticated andimportant role in maintaining the homeostasis of normalphysiological processes to stay healthy in the humanbody [26]. Since HRV measures provide information onthe degree of autonomic control of the heart rate, theyare often used as a non-invasive and effective tool for assessment of the cardiac autonomic function and ANSstate. Furthermore, low HRV is associated with mortalityin various diseases [27–30]. In the present study, wefound that all of the analyzed traditional HRV parameters, as well as conventional non-linear measures and CI,were significantly different between the ESRD andhealthy control groups except for the Mean RR. Consistent with previous studies [10, 31–33], lowered HRVmetrics and CI were observed in our study, which confirms that ESRD patients have impaired vagal control orcardiac autonomic function as well as heart rhythmcomplexity caused by disease pathology. Therefore, themultiscale method showed the phenomenon of heartrhythm decomplexification in ESRD patients, which contradicting the result obtained using the traditional ApEnalgorithms.DFA is often used to quantify the fractal correlationproperty of the HRV time series, and the short-termfractal scaling exponent α1 has been feasible to predictPage 8 of 11Fig. 3 Kaplan-Meier survival curves (P 0.001) for all-cause mortalityaccording to the the MSE parameters Area 6–20. The mortality forArea 6–20 13.43 and Area 6–20 13.43 were 4.80 and66.7%, respectivelymortality in various disease states [34–36]. Suzuki et al.showed that decreased α1 is an independent predictorfo
Background: Heart rhythm complexity, a measure of heart rate dynamics and a risk predictor in various clinical diseases, has not been systematically studied in patients with end-stage renal disease. The aim of this study is to investigate the heart rhythm complexity and its prognostic value for mortality in end-stage renal disease patients