Transcription
Comprehensive End StageRenal Disease Care (CEC) ModelPerformance Year 2 Annual Evaluation ReportContract #: HHSM-500-2014-00033ITask Order No. HHSM-500-T0001Prepared for:Centers for Medicare & Medicaid ServicesSubmitted by:The Lewin Group, Inc.September 2019
Performance Year 2 Annual Evaluation ReportCEC EvaluationComprehensive End-Stage RenalDisease Care (CEC) ModelPerformance Year 2 Annual EvaluationReportSeptember 2019The Lewin GroupAuthors:Grecia Marrufo, Brighita Negrusa, Darin Ullman, Richard Hirth,1 Joe Messana,1 BrandonMaughan, Jessica Nelson, Naya Lindsey, Daniel Gregory, Richard Svoboda, Court Melin,Andrea Chung, Claudia Dahlerus,1 Tammie Nahra,1 Amy Jiao,1 Katherine B. McKeithen,2 andZach GilfixLewin’s address:3160 Fairview Park Dr, Suite 600, Falls Church, VA 22042Federal Project Officer:Erin Murphy ColliganDivision of Health Systems Research (DHSR)Research and Rapid Cycle Evaluation Group (RREG),Center for Medicare & Medicaid Innovation (CMMI),Centers for Medicare & Medicaid Services (CMS)The statements contained in this report are solely those of the authors and do not necessarily reflect the views orpolicies of the Centers for Medicare & Medicaid Services. The Lewin Group assumes responsibility for the accuracyand completeness of the information contained in this report.12University of Michigan, Kidney Epidemiology and Cost Center (KECC)Independent Contractori
Performance Year 2 Annual Evaluation ReportCEC EvaluationTable of ContentsGLOSSARY OF TERMS .1EXECUTIVE SUMMARY .1A. Introduction .1B. Overview of Findings.21. Who Participates in the CEC Model? .32. Why Did Wave 2 ESCOs Join the CEC Model and How Did They Prepare? .43. How Did Wave 2 ESCOs Change Care Delivery to Meet CEC Model Goals? .54. What Were Beneficiaries’ Perceptions of the CEC Model? .65. What Was the Association between Alignment in the CEC Model and BeneficiaryQuality of Life? .66. What Were the Impacts of the CEC Model? .67. What Were the Differences in Performance between the CEC and Primary CareBased ACO Models? .148. Were There Unintended Consequences of the CEC Model? .14C. Discussion .15I.INTRODUCTION .17A. Research Questions Addressed in the Second Annual Report .171. Who Participates in the CEC Model? .192. Why Did Wave 2 ESCOs Join the CEC Model and How Did They Prepare? .193. How Did Wave 2 ESCOs Change Care Delivery to Meet CEC Model Goals? .194. What Were Beneficiaries’ Perceptions of the CEC Model? .205. What Was the Association between Alignment in the CEC Model and BeneficiaryQuality of Life? .206. What Were the Impacts of the CEC Model? .207. What Were the Differences in Performance between the CEC and Primary CareBased ACO Models? .218. Were There Unintended Consequences of the CEC Model? .21II.WHO PARTICIPATES IN THE CEC MODEL? .22A. Key Findings .23B. Methods .24C. Results .241. What Are the Characteristics of CEC Facilities? .242. What Are the Characteristics of CEC Markets? .26ii
Performance Year 2 Annual Evaluation ReportCEC EvaluationD. Discussion .28III. WHY DID WAVE 2 ESCOS JOIN THE CEC MODEL AND HOW DID THEYPREPARE? .29A. Key Findings .30B. Methods .30C. Results .311. Why Did Wave 2 ESCOs Join the Model? .312. What New or Enhanced Partnerships Did Wave 2 ESCOs Develop? .313. How Did Wave 2 ESCOs Prepare for the CEC Model? .324. What Were Wave 2 Owner Nephrologists’ Perceptions of ESCO FinancialArrangements, Risk Arrangements, and Anticipated Shared Savings? .335. What Waivers Did Wave 2 ESCOs Use?.35D. Discussion .36IV.HOW DID WAVE 2 ESCOS CHANGE CARE DELIVERY TO MEET CECMODEL GOALS? .37A. Key Findings .38B. Methods .38C. Results .381. How Did Wave 2 ESCOs Change Care? .382. Did the CEC Model Change Collection or Use of Quality-Oriented Data for Wave2 ESCOs? .463. What Early Implementation Challenges Did Wave 2 ESCOs Face? .474. How Did Wave 2 ESCOs Use the Learning System? .49D. Discussion .50V.WHAT WERE BENEFICIARIES’ PERCEPTIONS OF THE CEC MODEL? .51A. Key Findings .51B. Methods .52C. Results .521. What Did Beneficiaries Know about the CEC Model? .522. What Did Beneficiaries Perceive as the Strengths of Their ESCO? .523. What Were the Changes Beneficiaries Perceived as a Result of Their Facility’sParticipation in the ESCO? .53iii
Performance Year 2 Annual Evaluation ReportCEC EvaluationD. Discussion .53VI.WHAT WAS THE ASSOCIATION BETWEEN ALIGNMENT IN THE CECMODEL AND BENEFICIARY QUALITY OF LIFE?.54A.B.C.D.Key Findings .54Methods .55Results .57Discussion .58VII. WHAT WERE THE IMPACTS OF THE CEC MODEL? .59A. Key Findings .59B. Methods .60C. Results .631. What Was the Impact of CEC on Dialysis Care? .632. What Was the Impact of CEC on the Coordination of Care beyond Dialysis? .703. What Was the Impact of CEC on Hospitalizations and Emergency DepartmentVisits? .764. What Was the Impact of CEC on Medicare Spending across the Continuum ofCare? .865. What Was the Impact of CEC on Medicare Beneficiary Subpopulations? .91D. Discussion .92VIII. WHAT WERE THE DIFFERENCES IN PERFORMANCE BETWEEN THECEC AND PRIMARY CARE-BASED ACO MODELS? .94A.B.C.D.Key Findings .94Methods .95Results .98Discussion .100IX. DID THE CEC MODEL HAVE UNINTENDED CONSEQUENCES? .101A. Key Findings .102B. Methods .102C. Results .1041. Is There Evidence of Cost-Shifting to Medicare Part D? .1042. Is There Evidence of Adverse Selection within CEC Facilities? .1053. What Was the CEC Model’s Impact on Transplant Waiting List Participation? .105D. Discussion .107X.DISCUSSION .108iv
Performance Year 2 Annual Evaluation ReportCEC EvaluationGlossary of CPCSHMOHRQOLHRSADefinitionAcute Care HospitalAccountable Care OrganizationAmbulatory Care Sensitive ConditionAgency for Healthcare Research and QualityACO Investment ModelAdvanced Alternative Payment ModelArteriovenousBerenson-Eggers Type of ServicesBody Mass IndexComputer-Assisted Telephone InterviewsCore-Based Statistical AreaCondition CategoryCMS Claims and Claim Line FeedCMS Certification NumberClinical Classifications SoftwareChronic Conditions Data WarehouseCenters for Dialysis CareComprehensive End-Stage Renal Disease (ESRD) CareCongestive Heart FailureChronic Kidney DiseaseCommon Medicare EnvironmentCenter for Medicare & Medicaid InnovationCenters for Medicare & Medicaid ServicesCare Navigation UnitChronic Obstructive Pulmonary DiseaseConsolidated Renal Operations in a Web-enabled Networkcalendar yearDialysis Clinic, Inc.difference-in-differencesEvaluation and Managementemergency departmentemergency department information exchangeelectronic health recordsESRD Seamless Care Organizationend-stage renal diseaseFinancial Alignment Initiativefee-for-serviceGeneral Equivalence Mappingshemoglobin A1c testhierarchical condition categoryHealthcare Common Procedure Coding Systemhealth maintenance organizationhealth-related quality of lifeHealth Resources and Services Administration1
Performance Year 2 Annual Evaluation ReportAcronymIAHICCICD-10ICD-9ICH CAHPSIRBITKDQOL SPPSPQIPSMPY1PY2QIPQQRANDREMISSDOSF-12SHRCEC EvaluationDefinitionIndependence at Homeintra-cluster correlation coefficientsInternational Classification of Disease, 10th RevisionInternational Classification of Disease, 9th RevisionIn-Center Hemodialysis Consumer Assessment of Healthcare Providers and SystemsInstitutional Review Boardinformation technologyKidney Disease Quality of Life [Kidney Disease Quality of Life Short Form 36]low-density lipoproteinlarge dialysis organizationMedicare AdvantageMedicare Access and CHIP Reauthorization ActMaster Beneficiary Summary FileMental Component SummaryMahalanobis distance matchingLong Term Care Minimum Data SetMerit-Based Incentive Payment Systemmorphine milligram equivalentMinneapolis Medical Research Foundationmedication therapy managementNext Generation ACONorthwest Kidney Centersnon-large dialysis organization or small dialysis organizationNational Provider IdentifierNational Quality Forumordinary least squaresoral nutritional supplementsOrgan Procurement and Transplantation Networkoriginal reason for entitlement codepay-for-performancepost-acute careper beneficiary per monthprimary care providerPhysical Component SummaryProspective Payment SystemPrevention Quality Indicatorpropensity score matchingperformance year one (October 1, 2015 through December 31, 2016)performance year two (January 1, 2017 to December 31, 2017)Quality Incentive Programquantile-quantileResearch and Development CorporationRenal Management Information Systemsmall dialysis organizationShort Form 12 (for the KDQOL survey)standardized hospitalization ratio2
Performance Year 2 Annual Evaluation EC EvaluationDefinitionstandardized mean differencestandardized mortality ratioskilled nursing facilitystandardized readmission ratioScientific Registry of Transplant RecipientsShared Savings ProgramTaxpayer Identification Numbertotal quality scoreUnited StatesUS Renal Data SystemVirtual Research Data Center3
Performance Year 2 Annual Evaluation ReportCEC EvaluationExecutive SummaryA. IntroductionMedicare beneficiaries with end-stage renal disease (ESRD) are a medically complex group thatrequires significantly more resources than the general Medicare population.In 2016, fewer than 1% of the fee-for-service (FFS) Medicare beneficiary population had ESRD,yet they accounted for about 7% of FFS Medicare spending.3 Beneficiaries with ESRD have moreand longer hospitalizations than other beneficiaries and their readmission rates are more than twicethe rate of the general Medicare population.In an effort to provide better care for Medicare beneficiaries with ESRD, the Centers forMedicare & Medicaid Services (CMS) launched the Comprehensive ESRD Care (CEC) Modelin 2015 under the authority of the Center for Medicare & Medicaid Innovation (CMMI). TheCEC Model is an Advanced Alternative Payment Model (A-APM) that creates financialincentives for dialysis facilities, nephrologists, and other Medicare providers to coordinate carefor Medicare beneficiaries with ESRD. The model is designed to improve clinical and patientcentered outcomes for Medicare beneficiaries with ESRD, while promoting value and reducingper-capita spending.The CEC Model expands the reach of recent value-based payment initiatives targeting dialysisrelated care such as the ESRD Prospective Payment System (ESRD PPS) and the ESRD QualityIncentive Program (ESRD QIP). Under the CEC Model, dialysis facilities, nephrologists, andother providers, partner to form ESRD Seamless Care Organizations (ESCOs). ESCOs arespecialty-oriented Accountable Care Organizations (ACOs) that assume financial responsibilityfor the quality of care and Medicare Part A and Part B spending of their aligned beneficiaries.The ESCOs participating in the model are separated into two waves, differentiated by the date onwhich they joined the CEC Model. Wave 1 includes ESCOs that joined the model on October 1,2015; Wave 2 includes ESCOs that joined the model on January 1, 2017. The model runs fiveyears.This second annual report provides findings on the impact of the CEC Model during the first twoperformance years: October 1, 2015 through December 31, 2016 (PY1) and January 1, 2017through December 31, 2017 (PY2). It combines findings from quantitative and qualitative researchto address a core set of questions. For instance, data from interviews with ESCOs and facilitiesaddressed the questions of why organizations chose to participate and how they implemented themodel, including perceived successes and challenges. This second annual report focuses on Wave2 ESCO interviews, while the first annual report presents findings for Wave 1 ESCO interviews.4Quantitative research complements the qualitative data by addressing how participation in the CECModel for both Wave 1 and Wave 2 ESCOs affected dialysis care, coordination of care beyond3United States Renal Data System, 2018 Annual Data Report: Volume 2 – ESRD in the United States. National Institutesof Health, National Institute of Diabetes and Digestive and Kidney Diseases, Bethesda, MD, 2018.4For findings from the Wave 1 ESCO site visits, please see the first annual c-annrpt-py1.pdf).1
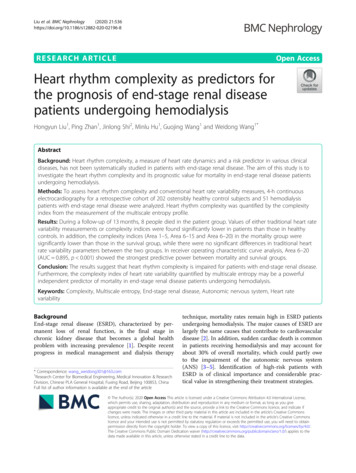
Performance Year 2 Annual Evaluation ReportCEC Evaluationdialysis, hospitalizations and emergency department (ED) visits, and Medicare spending across thecontinuum of care.B. Overview of FindingsThe CEC Model is designed to create incentives for dialysis facilities and nephrologists tocoordinate care for Medicare beneficiaries with ESRD across settings by making the ESCOresponsible – financially and clinically – for care delivered in other inpatient and outpatientsettings. The second performance year saw a major expansion of the CEC Model. In January2017, 24 new ESCOs joined the 13 original ESCOs that began operations in October 2015.Nationally, 12% of dialysis facilities are now participating in the model.Overall, the CEC Model showed promising results over the first two years, with improvementson some quality and health care utilization measures as well as a decrease in total spending (seeExhibit ES-1 for a summary of the evaluation findings). The CEC Model resulted in a 68million reduction in spending over the first two performance years. However, after accountingfor the 114.3 million in shared savings that ESCOs received across PY1 and PY2, Medicareexperienced aggregate net losses of 46.1 million (p 0.10). At the same time, beneficiaryreported quality of life remained largely unchanged. Results from the first two performance yearssuggest that the reduction in Medicare payments for CEC beneficiaries has primarily beengenerated through a reduction in hospitalizations. The percent of beneficiaries with at least oneED visit or readmission also decreased. Additionally, ESCOs reported various interventions toimprove adherence to dialysis. These resulted in an increase in the number of dialysis treatmentsand dialysis spending, but a decrease in spending for hospitalizations associated with dialysiscomplications.There is also evidence that, for beneficiaries with ESRD, the CEC Model performed better thanprimary care-based ACOs. We saw meaningful improvements in spending and utilizationoutcomes under the CEC Model, whereas primary care-based ACOs showed no evidence ofimproved outcomes or reduced spending for beneficiaries with ESRD. This suggests thatbeneficiaries with ESRD fare better in the specialized CEC Model than in primary care-basedACOs.2
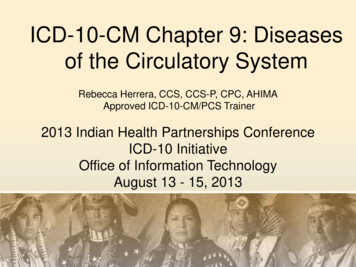
Performance Year 2 Annual Evaluation ReportCEC EvaluationExhibit ES-1. Summary of Evaluation Findings**Shows statistically significant evaluation impacts for all ESCOS across PY1 and PY2Notes: È boxes indicate measures with a statistically significant decrease; Ç boxes indicate measures with a statisticallysignificant increase. Each impact estimate is based on a difference-in-differences (DiD) analysis, and reflects thedifference in the regression-adjusted average outcome for beneficiaries in CEC facilities for the first two performanceyears with baseline relative to the same difference over time for beneficiaries in matched comparison facilities.Significance identified with p-values 0.10. *We evaluated the impact of the CEC Model on the odds of experiencing atleast one event in a given month and the number of events per month on the following outcomes: hospitalizations, EDvisits, and readmissions. For all other measures under this domain we only explored the impact of the CEC Model on theodds of experiencing at least one event in a given month.1. Who Participates in the CEC Model?Thirty-seven ESCOs, representing three large dialysis organizations (LDOs) (DaVita, Fresenius,and Dialysis Clinic, Inc. [DCI]) and four small dialysis organizations or non-LDOs (RogosinInstitute, Atlantic Dialysis, Centers for Dialysis Care [CDC], and Northwest Kidney Centers[NKC]), joined the CEC Model as of January 2017. Of these 37 ESCOs, 13 joined the CECModel on October 1, 2015 as Wave 1 ESCOs, while the remaining 24 ESCOs joined the CECModel as Wave 2 ESCOs on January 1, 2017. Collectively, these ESCOs had 685 dialysisfacilities and were spread across 27 states and Washington, D.C. Exhibit ES-2 shows thelocation of participating facilities.3
Performance Year 2 Annual Evaluation ReportCEC EvaluationExhibit ES-2. Location of CEC Dialysis FacilitiesSource: CEC Model participation data extracted from Salesforce on 01/03/2018.Dialysis Organization Representation. The 37 ESCOs are diverse along several importantdimensions, including geographic region, ownership, and size. While both LDOs and non-LDOsare represented in the model, Fresenius was the dominant participant, making up 72% of ESCOfacilities. DaVita was the next largest group, representing 16% of ESCO facilities. ESCOscovered a wide range of markets in terms of Medicare Part A and Part B payments perbeneficiary per month (PBPM), with no apparent selection into high-cost markets. However,ESCOs tended to operate in larger urban markets, likely reflecting the requirement to have atleast 350 patients with ESRD. In particular, ESCOs were located in many of the largestpopulation centers in the United States (US), with the average CEC Core-Based Statistical Area(CBSA) having a population three and a half times larger than the average non-CEC CBSA.2. Why Did Wave 2 ESCOs Join the CEC Model and How Did They Prepare?Reasons for Joining the CEC Model. Wave 2 ESCOs joined the model because of its potentialto improve patient care, increase efficiency, and reduce costs, as well as to build upon strongexisting relationships between dialysis providers and nephrologists and to develop or strengthenrelationships with other partners such as hospitals, hospice/palliative care providers, and vascularsurgery practices. The success and experience of Wave 1 ESCOs and the influence of theMedicare Access and CHIP Reauthorization Act (MACRA) also encouraged participation.Because the CEC Model was deemed an A-APM, participating nephrologists could exemptthemselves from reporting requirement and payment adjustments under MACRA’s Merit-basedIncentive Payment System (MIPS). Wave 2 ESCOs joined the model for reasons that weresimilar to the Wave 1 ESCOs.5 However, Wave 2 ESCOs were less likely to cite the desire to5Only detailed findings from the Wave 2 ESCO site visits are included in this annual report. For findings from theWave 1 ESCO site visits, please see the first annual report ptpy1.pdf).4
Performance Year 2 Annual Evaluation ReportCEC Evaluationinfluence future payment models and more likely to cite the success of Wave 1 ESCOs andMACRA as reasons for joining the model.New or Enhanced Partnerships. All dialysis organizations and their associated ESCOsestablished formal financial risk-sharing partnerships with nephrologists, as required forparticipation in the CEC Model. Similar to Wave 1 ESCOs in PY1, some Wave 2 ESCOs createdadditional risk-sharing partnerships with other providers such as vascular access centers, as wellas non-risk sharing partnerships with a wide range of organizations such as hospitals, additionalnephrologists and vascular surgeons, skilled nursing facilities (SNFs), information technology(IT) service providers, pharmacies, and hospice and palliative care organizations. On average,non-LDOs partnered with a more diverse set of organizations and had more partnershipscompared to the LDOs. This may be because the non-LDOs were exclusively local nonprofitorganizations that had existing community partnerships and continued outreach to form newpartnerships.Preparations for the Model. During our interviews with Wave 1 ESCOs in PY1, we learnedthat dialysis organizations invested in two major areas: new staff and IT to support carecoordination and care redesign efforts. Likewise, all Wave 2 ESCOs hired new staff, particularlycare coordinators. Care coordinators serve multiple functions, including coordinating nondialysis care, facilitating care transitions, following up with patients and staff to avoid potentialcare oversights, discussing social issues with patients (e.g., insurance and homelessness), andproviding encouragement to patients. Some ESCOs hired other types of staff, including dataanalysts, administrative assistants, admissions nurses, and palliative care staff. Wave 2 ESCOsalso made IT investments, including new equipment, electronic health records (EHR) upgrades,software updates, and notification systems to alert nephrologists and the dialysis facility whenpatients present to the ED.Use of CEC Model Waivers. The CEC Model offers a number of waivers under which ESCOscan apply to be allowed to provide extra services for their organizations or patients. ESCOrepresentatives discussed the use of patient engagement waivers (i.e., transportation, oralnutritional supplements [ONS], and patient IT) and did not mention other program waivers (i.e.,pay-for-performance [P4P], ESCO remuneration, ESCO IT, and care coordination). Of thepatient engagement waivers, the transportation waiver was used most frequently by both Wave 2ESCOs in PY2 and Wave 1 ESCOs in PY1.3. How Did Wave 2 ESCOs Change Care Delivery to Meet CEC Model Goals?Care Redesign Strategies. Wave 2 participants in the CEC Model implemented three generalstrategies to improve patient care:¡Increased Access to Dialysis Care. ESCOs used strategies such as extending facilityhours, increasing dialysis capacity at facilities, and improving flexibility aroundrescheduling treatments to help increase patients’ access to dialysis care and reducemissed dialysis treatments.¡Enhanced Coordination of Non-Dialysis Care. ESCOs developed risk stratificationmodels to identify patients vulnerable to hospitalizations and directed increased effortinto managing their care. Care management efforts included medication reconciliation,5
Performance Year 2 Annual Evaluation ReportCEC Evaluationreferrals to specialists, and coordination with non-dialysis providers. A few ESCOs alsoestablished partnerships with hospice and palliative care organizations.¡Improved Patient-Centered Care and Communication. ESCOs made changes totheir patient and family education strategies to improve patient-centered care andcommunication. These strategies included informing patients of the role and goals ofthe ESCO, preparing chronic kidney disease (CKD) patients for dialysis treatment, orproviding patients with contact information to triage their concerns and deterunnecessary hospitalizations.Implementation Challenges. ESCOs experienced several challenges in implementing themodel. Some of the most frequently noted challenges pertained to model design. For example,respondents commented on significant upfront costs associated with starting an ESCO, ESCOs’inability to engage outside providers to collaborate with the model
Comprehensive End Stage Renal Disease Care (CEC) Model Performance . Year 2 Annual Evaluation Report Contract #: HHSM-500-2014-00033I Task Order No. HHSM-500-T0001