Transcription
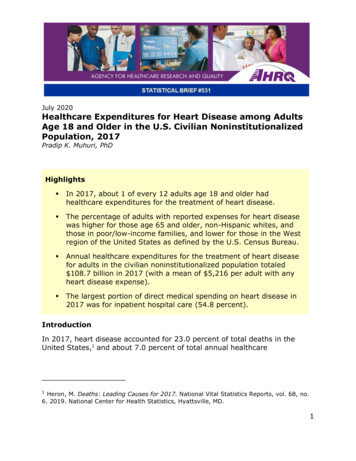
July 2020Healthcare Expenditures for Heart Disease among AdultsAge 18 and Older in the U.S. Civilian NoninstitutionalizedPopulation, 2017Pradip K. Muhuri, PhDHighlights In 2017, about 1 of every 12 adults age 18 and older hadhealthcare expenditures for the treatment of heart disease. The percentage of adults with reported expenses for heart diseasewas higher for those age 65 and older, non-Hispanic whites, andthose in poor/low-income families, and lower for those in the Westregion of the United States as defined by the U.S. Census Bureau. Annual healthcare expenditures for the treatment of heart diseasefor adults in the civilian noninstitutionalized population totaled 108.7 billion in 2017 (with a mean of 5,216 per adult with anyheart disease expense). The largest portion of direct medical spending on heart disease in2017 was for inpatient hospital care (54.8 percent).IntroductionIn 2017, heart disease accounted for 23.0 percent of total deaths in theUnited States,1 and about 7.0 percent of total annual healthcare1Heron, M. Deaths: Leading Causes for 2017. National Vital Statistics Reports, vol. 68, no.6. 2019. National Center for Health Statistics, Hyattsville, MD.1
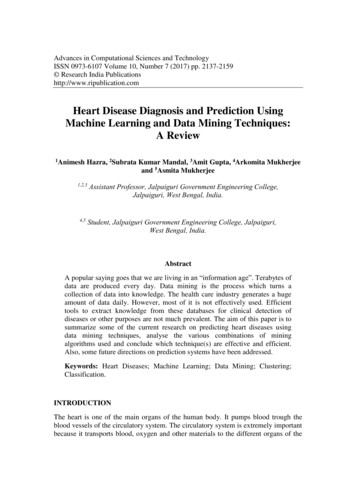
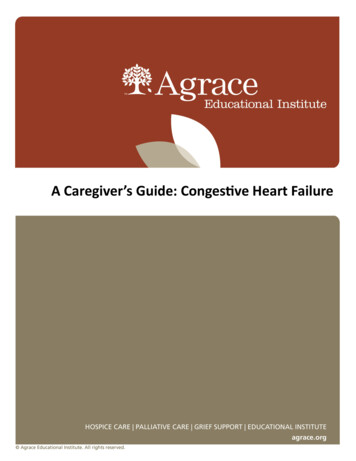
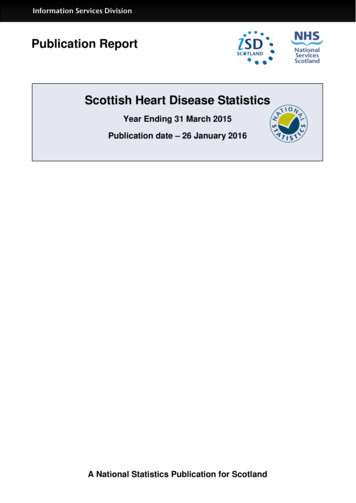
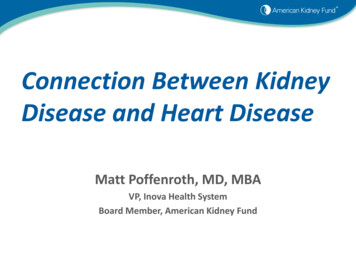
expenditures were for heart disease treatment in adults.2 Heart disease asdefined for this Statistical Brief includes coronary artery disease, angina,heart attacks, dysrhythmias, and heart failure. For more than two decades,the Medical Expenditure Panel Survey-Household Component (MEPS-HC) hasbeen a major data source for national estimates of healthcare expenses forthe U.S. civilian noninstitutionalized population. This Statistical Briefpresents estimates for healthcare expenditures for the treatment of heartdisease by selected characteristics among adults based on the 2017 MEPSHC. All analyses use MEPS full-year person-level sampling weights, whichtake disproportionate sampling and survey nonresponse into account. Onlydifferences between estimates that are statistically significant at the 0.05level are mentioned in the text of this Statistical Brief.FindingsExpenditures for heart disease treatment by selected characteristics (figures1 and 2)In 2017, an estimated 8.3 percent of adults age 18 years and older in theU.S. civilian noninstitutionalized population (about 20.9 million adults) hadsome healthcare expenditures for the treatment of heart disease (figure 1).The percentage with expenses was highest for adults age 65 and older (24.5percent) followed by age 45–64 (7.4 percent) and age 18–44 (1.6 percent).About 1 of every 10 non-Hispanic white adults (9.9 percent) hadexpenditures for the treatment of heart disease, while a lower percentage ofnon-Hispanic blacks (6.8 percent), non-Hispanic Asians (5.1 percent), andHispanics (4.5 percent) had healthcare expenses for this condition (figure 1).Men were more likely than women to have had expenses for heart diseasetreatment (9.6 versus 7.1 percent) (figure 1).A higher percentage of adults in poor and low-income families hadexpenditures for heart disease (9.8 and 10.9 percent, respectively) than infamilies with middle or high incomes (7.6 and 7.5 percent, respectively)(figure 2). About 9 percent of adults had healthcare expenses for thetreatment of heart disease in each geographic region except the West,where only 6.4 percent had expenses for this condition.Percentage equals direct medical spending for the treatment of heart disease ( 108.7billion) multiplied by 100, over total healthcare expenditures ( 1,543.8 billion) for adultsage 18 years and older in the U.S. civilian noninstitutionalized population (MedicalExpenditure Panel Survey-Household Component, 2017).22
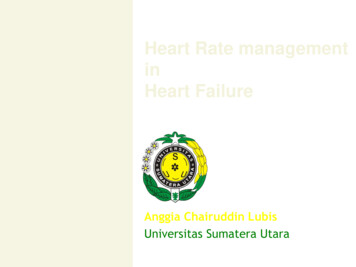
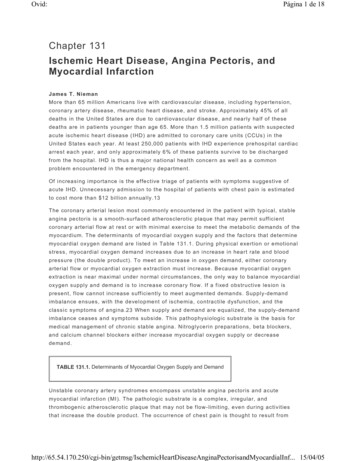
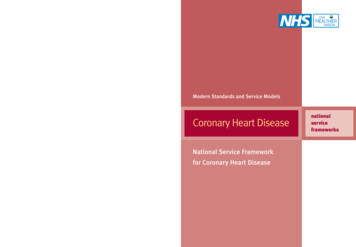
Expenditures for heart disease treatment by type of services (figures 3–5)Among all adults with any expense for the treatment of heart disease, nearlythree-quarters (71.5 percent) had prescription drug expenses, and twothirds (67.0 percent) had expenses for medical providers’ office-based care(figure 3). Smaller proportions had expenses for outpatient hospital visits(15.2 percent), emergency room visits (13.6 percent), inpatient hospitalstays (12.7 percent), and home health visits (6.0 percent).Among adults with reported expenses for the treatment of heart disease,median annual total expenditures per adult for treatment of the conditionwere 691, and the mean was 5,216 (figure 4). Of the six service types,median inpatient expenses for heart disease treatment among adults withexpenses for inpatient stays for the condition were highest ( 11,716). Thenext highest service type was home healthcare, for which median expensesfor heart disease treatment among adults with expenses for home healthvisits for that condition were 3,975. Median expenses for prescriptionmedicines for treatment of heart disease among those with any expense forthese medicines were lowest ( 153). Across service categories, meanexpenses were 1.9 to 5.5 times higher than median expenses because arelatively small proportion of adults had very high expenses.In 2017, an estimated 108.7 billion was spent for treatment of heartdisease among adults in the U.S. civilian noninstitutionalized population(figure 5). The largest portion (54.8 percent) of this spending was forinpatient hospital care. The remaining distribution of total spending was 12.0percent for medical providers’ office-based visits, 11.6 percent forprescription drugs, 9.8 percent for home health visits, 7.5 percent foroutpatient hospital care, and 4.3 percent for emergency department care.Data SourceThe estimates reported in this Brief are based on data from thefollowing 2017 MEPS data files: Medical Conditions fileCondition-Event Link fileOffice-Based Medical Provider Visits fileOutpatient Visits fileEmergency Room Visits filePrescribed Medicines filesHospital Inpatient Stays fileHome Health fileFull-Year Consolidated Data file3
The Medical Conditions file and the Condition-Event Link file used for thisanalysis are confidential internal use files (available to outside researchersthrough the Agency for Healthcare Research and Quality Data Center); therest are public use files. The public use files noted above are downloadablefrom https://meps.ahrq.gov/data stats/download data files.jsp.DefinitionsHeart diseaseIn the MEPS-HC, the medical conditions reported by respondents arerecorded by the interviewer as verbatim text. Since 2016, medical conditionshave been coded to fully specified International Classification of Disease,10th Revision, Clinical Modification (ICD-10-CM) codes (ICD-9-CM codes thatwere used in prior years were phased out). For this Brief, conditions wereregrouped into categories labeled as Clinical Classifications Software Refined(CCSR), which were designed to be as clinically homogeneous as possible.The following CCSR categories were used to identify heart disease.3CCSR CategoryDescriptionCIR001Chronic rheumatic heart diseaseCIR002Acute rheumatic heart diseaseCIR003Nonrheumatic and unspecified valve disordersCIR004Endocarditis and endocardial diseaseCIR005Myocarditis and cardiomyopathyCIR006Pericarditis and pericardial diseaseCIR009Acute myocardial infarctionCIR010Complications of acute myocardial infarctionCIR011Coronary atherosclerosis and other heart diseaseCIR012Nonspecific chest painThe CCSR codes are not available in the public use version of the 2017 Medical Conditionsfile. However, both CCSR codes and 3-character ICD-10 codes will be in the 2018 public usefile.34
CIR013Acute pulmonary embolismCIR014Pulmonary heart diseaseCIR015Other and ill-defined heart diseaseCIR016Conduction disordersCIR017Cardiac dysrhythmiasCIR018Cardiac arrest and ventricular fibrillationCIR019Heart failureUnlike a previous Statistical Brief on the same topic,4 the present Briefexcludes heart murmurs in the classification of heart disease.ExpendituresIn the MEPS, expenditures on treatment are defined as payments from allsources for prescribed medicines and for care provided in medical providers’offices, hospital outpatient departments, emergency departments, hospitals(inpatient), and patients’ homes (home health) (six service types).Payments for over-the-counter drugs are not included in MEPS totalexpenditures. Sources of payment include direct payments from privateinsurance, Medicare, Medicaid, out-of-pocket payments, and miscellaneousother sources.Expenses reported in this Brief were considered to be associated with heartdisease if a visit, stay, or purchase of a prescribed medicine was for one ofthe conditions listed above. Expenditures related to the treatment of heartdisease may include expenses associated with other conditions as well if theperson received care for multiple conditions concurrently. For each of thesix service-specific expenditure categories, the event-level expendituresassociated with the treatment of heart disease for each person weresummed to create a person-level total.Uberoi, N. and Cohen, J. Expenditures for Heart Disease among Adults Age 18 and Older:Estimates for the U.S. Civilian Noninstitutionalized Population, 2009. Statistical Brief #393.October 2012. Agency for Healthcare Research and Quality, Rockville, MD.45
AgeIndividuals were classified into three age groups (age 18–44, age 45–64, andage 65 and older) based on their age at the last time they were eligible fordata collection during the year (usually the end of the year).Race/ethnicityMEPS respondents were asked if each family member was Hispanic or Latinoand about each member's race. Based on this information, categories of raceand Hispanic origin were constructed as follows: 1) Hispanic; 2) white nonHispanic, with no other race reported; 3) black non-Hispanic, with no otherrace reported; and 4) Asian non-Hispanic, with no other race reported. The"other/multiple races, non-Hispanic" category is not shown separately in thisBrief due to small sample sizes or failure to meet minimum precisionrequirements. However, data from individuals in this category are included inthe overall total.IncomeIncome was classified based on the percentage of the federal poverty levelfor total family income, adjusted for family size and composition. A fourcategory income variable was used: poor (less than 100 percent of thefederal poverty level), low-income (100 percent to less than 200 percent),middle-income (200 percent to less than 400 percent), and high-income(greater than or equal to 400 percent) in the year of the data collection.Census regionThe Census region variable was based on the location of the household at theend of the year. If missing, the most recent location available was used. Northeast: Maine, New Hampshire, Vermont, Massachusetts, RhodeIsland, Connecticut, New York, New Jersey, and PennsylvaniaMidwest: Ohio, Indiana, Illinois, Michigan, Wisconsin, Minnesota, Iowa,Missouri, North Dakota, South Dakota, Nebraska, and KansasSouth: Delaware, Maryland, District of Columbia, Virginia, WestVirginia, North Carolina, South Carolina, Georgia, Florida, Kentucky,Tennessee, Alabama, Mississippi, Arkansas, Louisiana, Oklahoma, andTexasWest: Montana, Idaho, Wyoming, Colorado, New Mexico, Arizona,Utah, Nevada, Washington, Oregon, California, Alaska, and Hawaii6
About MEPSThe Medical Expenditure Panel Survey Household Component (MEPS-HC)collects nationally representative data on healthcare use, expenditures,sources of payment, and insurance coverage for the U.S. civiliannoninstitutionalized population. The MEPS-HC is co-sponsored by the Agencyfor Healthcare Research and Quality (AHRQ) and the National Center forHealth Statistics (NCHS). More information about the MEPS-HC can be foundat http://www.meps.ahrq.gov.ReferencesFor a detailed description of the MEPS-HC survey design, sample design, andmethods used to minimize sources of nonsampling error, see the followingpublications:Chowdhury, S.R., Machlin, S.R., and Gwet, K.L. Sample Designs of theMedical Expenditure Panel Survey Household Component, 1996–2006 and2007–2016. Medical Expenditure Panel Survey Methodology Report No. 33.January 2019. Agency for Healthcare Research and Quality, Rockville, MD.https://meps.ahrq.gov/data files/publications/mr33/mr33.shtmlCohen, J. Design and Methods of the Medical Expenditure Panel SurveyHousehold Component. Medical Expenditure Panel Survey MethodologyReport No. 1; Agency for Health Care Policy and Research (AHCPR) Pub. No.97-0026. 1997. AHCPR, Rockville, MD.https://meps.ahrq.gov/data files/publications/mr1/mr1.shtmlSuggested CitationMuhuri, P.K. Healthcare Expenditures for Heart Disease among Adults Age18 and Older in the U.S. Civilian Noninstitutionalized Population, 2017.Statistical Brief #531. July 2020. Agency for Healthcare Research andQuality, Rockville, MD.https://meps.ahrq.gov/data files/publications/st531/stat531.pdf***7
AHRQ welcomes questions and comments from readers of this publicationwho are interested in obtaining more information about access, cost, use,financing, and quality of healthcare in the United States. We also invite youto tell us how you are using this Statistical Brief and other MEPS data andtools and to share suggestions on how MEPS products might be enhanced tofurther meet your needs. Please email us atMEPSProjectDirector@ahrq.hhs.gov or send a letter to the address below:Joel W. Cohen, PhD, DirectorCenter for Financing, Access, and Cost TrendsAgency for Healthcare Research and Quality5600 Fishers Lane, Mailstop 07W41ARockville, MD 208578
Figure 1. Percentage with expenses for heart disease treatment bydemographic characteristics: Adults age 18 and older, 2017Demographic characteristicsAll18–4445–6465 White, non-HispanicBlack, non-HispanicAsian, 4%24.5%9.9%6.8%5.1%4.5%9.6%7.1%Source: Agency for Healthcare Research and Quality, Center for Financing, Access, and CostTrends, Medical Expenditure Panel Survey, Household Component, 2017.9
Figure 2. Percentage with expenses for heart disease treatment byincome and region: Adults age 18 and older, 2017Income and .5%8.6%8.8%9.0%6.4%Source: Agency for Healthcare Research and Quality, Center for Financing, Access, and CostTrends, Medical Expenditure Panel Survey, Household Component, 2017.10
Figure 3. Percentage with expenses for heart disease treatment bytype of service: Adults age 18 and older with any type of expenses,2017Type of serviceOffice-basedOutpatient hospitalEmergency roomInpatient hospitalHome healthPrescription : Agency for Healthcare Research and Quality, Center for Financing, Access, and CostTrends, Medical Expenditure Panel Survey, Household Component, 2017.11
Figure 4. Mean and median annual expenditures for heart diseasetreatment among adults age 18 and older with heart diseasetreatment expenses, overall and by service type, 2017Service typeAll categoriesPrescription drugsOffice-basedOutpatient hospitalEmergency roomHome healthInpatient hospitalMedian ( )6911533116448663,97511,71695% ,130–5,82010,011–13,420Mean ( )5,2168479382,5681,6518,46922,50995% 149–2,1526,459–10,47918,093–26,925Source: Agency for Healthcare Research and Quality, Center for Financing, Access, and CostTrends, Medical Expenditure Panel Survey, Household Component, 2017.Notes: CI confidence interval. For each service type, the mean/median annualexpenditures for heart disease treatment are for adults with any expense associated withheart disease treatment for that service type; the N for this calculation varies by servicetype.12
Figure 5. Percentage distribution of total medical expenditures forheart disease treatment by type of service: Adults age 18 and olderwith heart disease treatment expenses, 2017Type of serviceEmergency roomHome healthInpatientOffice-basedOutpatientPrescription drugsPercentage4.3%9.8%54.8%12.0%7.5%11.6%Source: Agency for Healthcare Research and Quality, Center for Financing, Access, and CostTrends, Medical Expenditure Panel Survey, Household Component, 2017.13
expenditures for heart disease (9.8 and 10.9 percent, respectively) than in families with middle or high incomes (7.6 and 7.5 percent, respectively) (figure 2). About 9 percent of adults had healthcare expenses for the treatment of heart disease in each geographic region except the West, where only 6.4 percent had expenses for this condition.