Transcription
Inquérito Alimentar Nacional e de Atividade Física, IAN-AF 2015-2016 Tutorial para análise ponderadaWEIGHTING COMPLEXSAMPLESIAN-AF DatabasesTutorial using software SPSS e R1
Inquérito Alimentar Nacional e de Atividade Física, IAN-AF 2015-2016 Tutorial para análise ponderadaTable of ContentsNota introdutória . 31. Software SPSS . 42. Software R . 17References[1] R Core Team (2017). R: A language and environment for statistical computing. R Foundation forStatistical Computing, Vienna, Austria. URL https://www.R- roject.org/.[2] T. Lumley (2017) "survey: analysis of complex survey samples". R package version 3.32.[3] T. Lumley (2004) Analysis of complex survey samples. Journal of Statistical Software. 9(1): 1-192
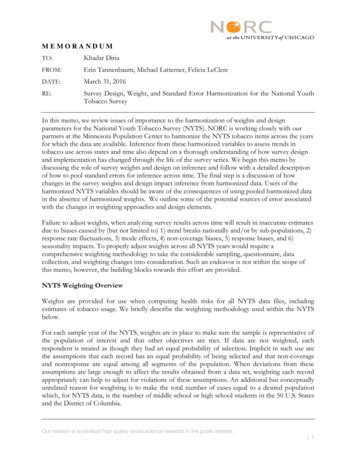
National Food and Physical Activity Survey, IAN-AF 2015-2016 Weighting Complex Samples TutorialIntroductory NotesIn the National Food and Physical Activity Survey, IAN-AF 2015-2016, participants were randomly selectedfrom the National Register of Users of the National Health Service, based on a two-stage complex samplingprocess. The sampling process proceeded as follows:i.Primary Health Units were randomly selected in each Territorial Unit for Statistical Purposes (NUTSII). In each region, the sampling was weighted taking into account the number of individuals. Thenumber of Primary Health Units selected was 21 in the North region, Centre and Metropolitan Areaof Lisbon, 12 in the Algarve and Alentejo regions and six in the Autonomous Regions of Madeiraand the Azores.ii.Individuals registered in each Primary Health Units were randomly selected, with a fixed numberof elements by sex and age group.To estimate the results according to the IAN-AF 2015-2016 complex sample design, at national and regionallevel (NUTS II), the results are weighted according to a created variable. The sample weights represent howmany individuals of the Portuguese population (in number) each individual of the sample represents. Thecalculation of sample weights included the following criteria:i.initial weighting to compensate for the different probabilities of selection of each Primary HealthUnits;ii.weighting to compensate for the different probabilities of selection of each individual in eachPrimary Health Units, by sex and age group (considering the individuals in each Primary HealthUnits, in the closest recruitment wave);iii.correction of the initial weights for the non-response bias.At the end, in order to correct data for non-response bias of both first and second interview, two weightvariables were created. The first, Ponderador1, is used for data collected in the first interview, and thesecond weight variable, Ponderador2, is used for data collected in the second interview. Thus, allestimates referring to the domains Physical Activity and Nutritional Status must use the weight variablePonderador1, while the domain Food must use the weight variable Ponderador2.Next, we present a brief tutorial on how to use the SPSS and R [1] software in order to obtain weightedestimates according to the complex sampling design of the IAN-AF 2015-2016, using the SPSS and R software[1].3
National Food and Physical Activity Survey, IAN-AF 2015-2016 Weighting Complex Samples Tutorial1.SoftwareSPSS4
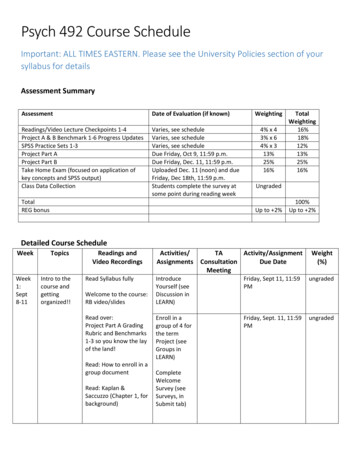
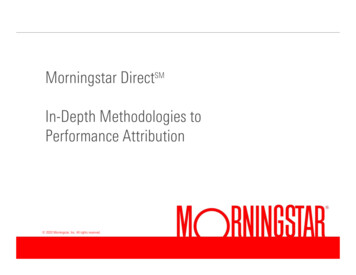
National Food and Physical Activity Survey, IAN-AF 2015-2016 Weighting Complex Samples TutorialIn order to obtain weighted estimates according to the IAN-AF 2015-2016 complex sampling design in SPSS,first it is necessary to create a file that indicates the complex sampling design used. To do it so, it ismandatory to have the variables "PSU", "NUT" and the respective weighting variable, which can be found inthe sociodemographic database. Thus, it is always necessary to merge the sociodemographic database withthe database containing the variables under study.5
National Food and Physical Activity Survey, IAN-AF 2015-2016 Weighting Complex Samples Tutorial6
National Food and Physical Activity Survey, IAN-AF 2015-2016 Weighting Complex Samples Tutorial7
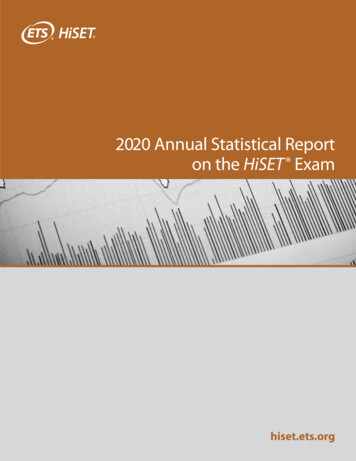
National Food and Physical Activity Survey, IAN-AF 2015-2016 Weighting Complex Samples TutorialThis file will be used to perform all weighted statistical analyses, which must be uniquely made in the Analyze Complex Samples menu.8
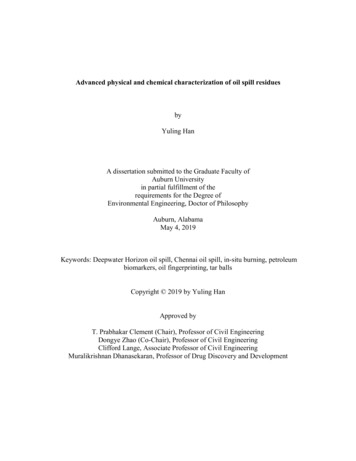
National Food and Physical Activity Survey, IAN-AF 2015-2016 Weighting Complex Samples Tutorial1.1. Weighted frequenciesIn order to estimate weighted frequencies, one should go to Analyze Complex Samples Frequenciesand select the previously created file.9
National Food and Physical Activity Survey, IAN-AF 2015-2016 Weighting Complex Samples TutorialNext, one should select the variable under study and the associated statistics.10
National Food and Physical Activity Survey, IAN-AF 2015-2016 Weighting Complex Samples TutorialResult:Sexo.xEstimatePopulation Size% of TotalStandard Error95% Confidence 00,0%0,0%100,0%100,0%11
National Food and Physical Activity Survey, IAN-AF 2015-2016 Weighting Complex Samples Tutorial1.2. Test independence/association between 2 categorical variablesIn order to test the independence/association between two categorical variables, one should access to theAnalyze Complex Samples Crosstabs menu and select the previously created file.Then, select the variables under hypothesis and the respective statistics.12
National Food and Physical Activity Survey, IAN-AF 2015-2016 Weighting Complex Samples TutorialResult:Sexo.x * DespDespSexo.xPopulation Size0% within Sexo.x% within DespPopulation Size1% within Sexo.x% within DespPopulation SizeTotal% within Sexo.x% within 20Standard ,7%100,0%Standard Error1,9%1,9%0,0%Estimate53,4%47,1%50,9%Standard 7036,590Standard ,7%100,0%Standard Error2,0%2,0%0,0%Estimate46,6%52,9%49,1%Standard 2900,210Standard ,6%100,0%Standard d Error0,0%0,0%0,0%13
National Food and Physical Activity Survey, IAN-AF 2015-2016 Weighting Complex Samples TutorialTests of IndependenceChi-SquareSexo.x * DespAdjusted Fdf1df2Sig.Pearson14,3886,020192,016Likelihood Ratio14,3946,022192,016The adjusted F is a variant of the second-order Rao-Scott adjusted chi-square statistic. Significance isbased on the adjusted F and its degrees of freedom.Measures of AssociationEstimateSexo.x * DespOdds Ratio1,286Statistics are computed only for 2-by-2 tables with all cells observed.14
National Food and Physical Activity Survey, IAN-AF 2015-2016 Weighting Complex Samples Tutorial1.3. Weighted meanIn order to estimate the weighted mean and the respective confidence interval of a continuous variable, oneshould access to the Analyze Complex Samples Descriptives menu and select the previously createdfile.Then, select the continuous variable under study and the respective statistics.Result:Univariate StatisticsMeanX1.1EstimateStandard Error2,14,02795% Confidence IntervalLowerUpper2,092,1915
National Food and Physical Activity Survey, IAN-AF 2015-2016 Weighting Complex Samples Tutorial1.4. Linear RegressionIn order to compare weighted mean values or a linear regression for weighted data, one should access to theAnalyze Complex Samples General Linear Model menu and select the previously created file.Then, select the dependent variable and the independent variables, as well as the respective statistics. If avariable is of type categorical, then the variable must be added in “Factors”. Otherwise, if a variable is oftype continuous, then the variable must be added in “Covariates”.Resultado:Parameter EstimatesaParameter(Intercept)Estimate95% Confidence IntervalLowerUpperHypothesis TestdftSig.2,1292,0562,20357,59292,000,000[Sexo.x 0],020-,068,108,45692,000,649[Sexo.x 1],000b.a. Model: X1.1 (Intercept) Sexo.xb. Set to zero because this parameter is redundant.16
National Food and Physical Activity Survey, IAN-AF 2015-2016 Weighting Complex Samples Tutorial2.SoftwareR17
National Food and Physical Activity Survey, IAN-AF 2015-2016 Weighting Complex Samples TutorialIn order to obtain weighted estimates according to the IAN-AF 2015-2016 complex sampling design in R, thelibrary “survey” is used [2,3]. install.packages(“survey”) library(survey)When creating the database, it is mandatory to include the variables "PSU", "NUT" and the respectiveweighting variable, which can be found in the sociodemographic database. Thus, it is always necessary tojoin the sociodemographic database with the variables under study.# mudar nome das tabelas de acordo com os nomes dos ficheiros exportados# mudar variável ponderador de acordo com as variáveis a analisar base read.csv2("Tabela Ponderador Sociodem.csv", stringsAsFactors F) atvfis read.csv2("Tabela AFisica.csv", stringsAsFactors F) b merge(base, atvfis) svdx -svydesign(id PSU, strata NUT, weights Ponderador1, data b) summary(svdx)Next, some statistical analysis using the indicated library are exemplified. More information about theimplemented functions in this library is available in the respective documentation.18
National Food and Physical Activity Survey, IAN-AF 2015-2016 Weighting Complex Samples Tutorial2.1. Weighted frequency and mean values of categorical and continuous variables,respectivelyThe "svymean" function calculates the weighted mean of a variable according to the complex samplingdesign previously established. If the variable under study is of type "factor", then this function calculatesthe weighted proportion of each category of the variable. svymean( idade, svdx)meanSEidade 42.686 0.3652 svymean( factor(Sexo), svdx)meanSEfactor(Sexo)0 0.51217 0.0064factor(Sexo)1 0.48783 0.00642.2. Statistics on subsetsIn order to estimate statistics on subsets defined by a factor, use the "svyby" function. svyby( idade, Sexo, svdx, svymean)Sexoidadese00 42.22272 0.473847611 42.11595 0.4994525It is also possible to define separately a subset, and proceed as usual. subsvdx subset(svdx, Sexo 1) svymean( idade, subsvdx)meanSEidade 42.116 0.47519
National Food and Physical Activity Survey, IAN-AF 2015-2016 Weighting Complex Samples Tutorial2.3. Hypothesis testst-test for comparison of mean values: svyttest(Idade factor(Sexo), svdx)Design-based t-testdata: Idade factor(Sexo)t -2.1346, df 91, p-value 0.03548alternative hypothesis: true difference in mean is not equal to 0 sample estimates:difference in mean-1.153271𝜒2-test to comparison of proportions: svychisq( GE4 Sexo, svdx)Pearson's X 2: Rao & Scott adjustmentdata:svychisq( GE4 Sexo, svdx)F 4.4883, ndf 1.9053, ddf 175.2800, p-value 0.0138520
National Food and Physical Activity Survey, IAN-AF 2015-2016 Weighting Complex Samples Tutorial2.4. Regression modelsLinear regression model: m1 svyglm(IMC Sexo Idade factor(EscolClass Prop) , family gaussian(), svdx) summary(m1)Call:svyglm(formula IMC Sexo Idade factor(EscolClass Prop),family gaussian(), subsvdx)Survey design:svdxCoefficients:(Intercept)Estimate Std. Error t value Pr( t )24.4456130.472124 51.778 2e-16 611.894factor(EscolClass Prop)2 -1.399916factor(EscolClass Prop)3 -2.0571810.2722370.269839-5.142 1.63e-06 ***-7.624 2.70e-11 ***--Signif. codes:0.172 2e-16 ***0 ‘***’ 0.001 ‘**’ 0.01 ‘*’ 0.05 ‘.’ 0.1 ‘ ’ 1(Dispersion parameter for gaussian family taken to be 20.84462)Number of Fisher Scoring iterations: 2 cbind(coef(m1),confint(m1))(Intercept)2.5 %97.5 %24.44561278 23.52026639 25.37095917SexoIdade-0.33260125 -0.806260590.08492765 0.070932210.141058080.09892308factor(EscolClass Prop)2 -1.39991563 -1.93349039 -0.86634087factor(EscolClass Prop)3 -2.05718129 -2.58605546 -1.5283071121
National Food and Physical Activity Survey, IAN-AF 2015-2016 Weighting Complex Samples TutorialLogistic regression model: m1 svyglm(factor(Desp) factor(GrupoEtario), family binomial(link 'logit'), svdx) summary(m1)Call:svyglm(formula factor(Desp) factor(GrupoEtario), family binomial(link "logit"),subsvdx)Survey design:svdxCoefficients:(Intercept)Estimate Std. Error t value0.446970.149802.984Pr( t )0.00367 **factor(GrupoEtario)2 -0.08235factor(GrupoEtario)3 -0.838730.180990.15511-0.455-5.4070.650235.32e-07 ***factor(GrupoEtario)4 -1.15278---0.18788-6.1362.30e-08 ***Signif. codes:0 ‘***’ 0.001 ‘**’ 0.01 ‘*’ 0.05 ‘.’ 0.1 ‘ ’ 1(Dispersion parameter for binomial family taken to be 1.000187)Number of Fisher Scoring iterations: 4 cbind(exp(coef(m1)),exp(confint(m1)))2.5 %97.5 %(Intercept)1.5601185 1.1636513 2.0916658factor(GrupoEtario)2 0.9240598 0.6467305 1.3203127factor(GrupoEtario)3 0.4309102 0.3187190 0.5825935factor(GrupoEtario)4 0.3164551 0.2187010 0.457902922
National Food and Physical Activity Survey, IAN-AF 2015-2016 Weighting Complex Samples Tutorial23
In order to obtain weighted estimates according to the IAN-AF 2015-2016 complex sampling design in SPSS, first it is necessary to create a file that indicates the complex sampling design used. To do it so, it is mandatory to have the variables "PSU", "NUT" and the respective weighting variable, which can be found in the sociodemographic database.