Transcription
MEMORANDUMTO:Khadar DiriaFROM:Erin Tannenbaum, Michael Latterner, Felicia LeClereDATE:March 31, 2016RE:Survey Design, Weight, and Standard Error Harmonization for the National YouthTobacco SurveyIn this memo, we review issues of importance to the harmonization of weights and designparameters for the National Youth Tobacco Survey (NYTS). NORC is working closely with ourpartners at the Minnesota Population Center to harmonize the NYTS tobacco items across the yearsfor which the data are available. Inference from these harmonized variables to assess trends intobacco use across states and time also depend on a thorough understanding of how survey designand implementation has changed through the life of the survey series. We begin this memo bydiscussing the role of survey weights and design on inference and follow with a detailed descriptionof how to pool standard errors for inference across time. The final step is a discussion of howchanges in the survey weights and design impact inference from harmonized data. Users of theharmonized NYTS variables should be aware of the consequences of using pooled harmonized datain the absence of harmonized weights. We outline some of the potential sources of error associatedwith the changes in weighting approaches and design elements.Failure to adjust weights, when analyzing survey results across time will result in inaccurate estimatesdue to biases caused by (but not limited to) 1) trend breaks nationally and/or by sub-populations, 2)response rate fluctuations, 3) mode effects, 4) non-coverage biases, 5) response biases, and 6)seasonality impacts. To properly adjust weights across all NYTS years would require acomprehensive weighting methodology to take the considerable sampling, questionnaire, datacollection, and weighting changes into consideration. Such an endeavor is not within the scope ofthis memo, however, the building blocks towards this effort are provided.NYTS Weighting OverviewWeights are provided for use when computing health risks for all NYTS data files, includingestimates of tobacco usage. We briefly describe the weighting methodology used within the NYTSbelow.For each sample year of the NYTS, weights are in place to make sure the sample is representative ofthe population of interest and that other objectives are met. If data are not weighted, eachrespondent is treated as though they had an equal probability of selection. Implicit in such use arethe assumptions that each record has an equal probability of being selected and that non-coverageand nonresponse are equal among all segments of the population. When deviations from theseassumptions are large enough to affect the results obtained from a data set, weighting each recordappropriately can help to adjust for violations of these assumptions. An additional but conceptuallyunrelated reason for weighting is to make the total number of cases equal to a desired populationwhich, for NYTS data, is the number of middle school or high school students in the 50 U.S. Statesand the District of Columbia.Our mission is to conduct high quality social science research in the public interest. 1
The health characteristics estimated from the NYTS pertain to students in grade 6 through 12, whoattend high school or middle school in either a public, private, or Catholic school in the UnitedStates. Students enrolled in an alternative school, special education school, Department of Defenseoperated school, or vocational school (that only serves students who are enrolled in another school)were excluded. Additionally, students who were unable to complete the questionnaire withoutspecial assistance were excluded.NYTS sample selection and weighting documentation are available online from 2004 to 2014through a Methodology Report published with each survey wave. The 1999, 2000, and 2002documentation is available upon request from the Office on Smoking and Health, National Centerfor Chronic Disease Prevention and Health Promotion. The documentation for these earlier yearsalthough not published on-line, were provided to NORC and used for this memo.A three stage stratified sample design was employed, for which the first stage is stratified by county,urban status, and/or region. The second stage stratifies by school, and the third stage selects classeswithin the school. A summary of changes detailed in the overview statements are included below in“Changes by Year.”Finally, the time-span of a long-lived survey such as the NYTS, means that changes are often madeto the sample design components (strata and clusters) as well as to the way survey weights arecalculated (including probabilities of selection, non-response adjustments and post-stratificationadjustments). These changes in sample design and survey weights can impact both point estimates ina series (e.g., such as the proportion of middle school students who smokes over time) and thevariance/standard errors of those estimates. Thus, focusing only on variable harmonization is notsufficient to guarantee the integrity of statistical inference. The impact of changes in study designand sampling methods can have as profound an impact on the analysis of time trends as changes inquestion wording and variable code frames.Standard Errors across YearsThis memo assumes the reader is familiar with standard errors as a statistical concept as well ascalculation methods to produce standard errors for the NYTS for a single year. In this section, wedescribe the implications of survey design changes on standard error estimation from data frommultiple years of a survey.There are several valid ways to compute estimates from data that are combined across survey years.The adjustment of the weights and standard error calculations depends on the desired finalinferential population. For the sake of presentation, the following formulas assume that samplingand weighting methodologies are similar across time. In theory, one could make a weight adjustmentfor each estimate to be computed and for each domain, or subpopulation of interest (i.e. anindividual state or area within a state).Assume that a researcher would like to combine years of survey results to improve precision. Forexample, suppose is an average derived from n consecutive years’ data, i.e.are the estimates for the individual years.where theOur mission is to conduct high quality social science research in the public interest. 2
If we use an appropriate formula within a particular year’s NYTS to estimate the standard error,of each year’s estimate, then the standard error of , is,whereThe correlation between consecutive years, r, is approximately 0 as the NYTS is a cross-sectionalsurvey. That is, the probability of selecting the same person in two consecutive years is rare. As suchthis reduces toThis formulation assumes, however, that the standard errors are calculated similarly across all yearsof the survey.Changes by YearPooling standard errors across years assumes that the weight construction and calculation arecomparable from year to year. We examined the methods used to construct survey weights overtime in the NYTS that might introduce changes to the estimates or standard error calculations.Weights represent the inverse probability of selection of a sample element and are also generallyadjusted for differential non-response and coverage error using a process of post-stratification oriterative proportionate fitting, depending on the survey year.An overview of changes that may impact estimates across time are presented at the bottom of thismemo in the form of five figures: Figure 1 outlines increases to the nonresponse rate. Figures 2 and3 outline changes in race and ethnicity oversampling across time. Figures 4 and 5 provide a detailedlook at the changes made within sampling stage 3 across time. Figure 6 outlines the number of strataselected at each sampling stage across time. Lastly, Figure 7 outlines additional changes that mayimpact comparisons from year to year. The changes across these tables represent a myriad ofmethodological changes, some of which will directly impact the estimates from the NYTS acrosstime. The analytic impact of these changes are substantial and the breath of their impact is beyondthe scope of this document. The primary goal is to alert users to the potential for substantialinferential bias.NORC recommends creating an “adjusted” set of harmonized weights that account for knownissues that could influence key estimates of interest (e.g., smoking status). There are many examplesin which underlying design issues can impact inference. For example, the NYTS used variousmethods to oversample minority populations. Additionally in 2002, the NYTS used a panel sampledesign and subsequently removed the panel design in the next survey wave (2004). The inclusion ofidentical school respondents was touted as a way to determine changes in smoking behaviors andattitudes between 2002 and 2006. Because race and ethnicity are related to smoking behavior, theOur mission is to conduct high quality social science research in the public interest. 3
overall percentage of students who smoke may appear to have changed as an artifact of theseadjustments alone. We recommend smoothing the introduction of large changes over a longer timeto avoid any incorrect conclusions.We also examined the sample methodology used over time for potential estimation issues. Forexample, the NYTS switched from administering surveys at the beginning of the school year (fall) tothe end of the school year (spring) between 1999 and 2000. When the NYTS used a fall datacollection, it was likely that fewer students had taken up smoking or tried smoking because theywere as many as six months younger in age. We recommend further investigation of potential biasesbefore the introduction of 1999 data and smoothing or adjusting the introduction of this changeover a longer time.Another major complication in harmonizing strata over time is that the Public Use Files of federalsurveys with variables relevant to tobacco policy and tobacco control often have limited samplingstrata identifiers. Sample design information such as PSUs and strata often provide detailedgeographic identifiers that could be used with other information to re-identify respondents.Inference across Public Use Files over time will likely neglect important design changes that are notrepresented in the strata available to adjust standard errors for survey design effects.Given the large number of changes across time, researchers should carefully examine the years ofinterest, determine all methodological changes across those years, test for substantive differenceswithin the survey results, and adjust the estimates and weights as appropriate.Our mission is to conduct high quality social science research in the public interest. 4
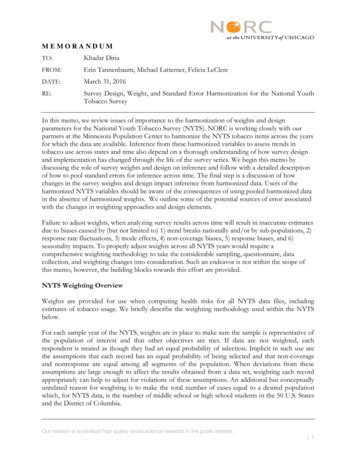
Figure 1. NYTS Response Rate by Year and TypeNote: Increases in nonresponse rates may cause nonresponse biases. These effects ideally should bemeasured and taken into consideration across survey waves.YearResponse RateType1999 2000 2002 2004 2006 2009 2011 2012 2013 201490.3908393 91.6 92.3 83.2 80.3 74.8 80.2School93.2939088 87.6 91.988 91.7 90.7 91.4Student84.2 83.7 74.7 81.8 80.2 84.8 73.2 73.6 67.8 73.3OverallOur mission is to conduct high quality social science research in the public interest. 5
Figure 2. NYTS Oversampling Strategy by YearNote: The number of units per sampling stage vary by year. Thus, the probability of selection for asingle school of the same size may change from sample wave to wave. Small changes in probabilityof selection may lead to trend breaks.YearMinorityOversampled1999 Hispanic and Black2000 Hispanic, Black, andAsian/PacificIslanders2002 Hispanic, Black, andAsian/PacificIslanders2004 Hispanic, Black, andAsian2006 Hispanic, Black, andAsian2009 Hispanic and BlackOversamplingPSUsImplicitMethod EmployedWeightedUnweightedMOSMOSDouble Class 75% of the selected largeschools, schools with thehighest concentrations ofHispanics and black studentsfor each level.2011 Hispanic and Black2012 NoneImplicitExplicitYes2013 BlackExplicitYes2014 BlackExplicitYesTestedLarge schools randomlyselected.Any school with greater than5 percent non-Hispanic blackstudent enrollment.Large schools that had greaterthan 3 percent non-Hispanicblack student enrollment.Our mission is to conduct high quality social science research in the public interest. 6
Figure 3. NYTS Oversampling Factor by Race and YearBelow are equations provided by year within the weighted measurement of size which is a techniqueused to oversample minorities. Changes in sample design also impacts weights which likely impactssub-populations and thus, breaks any potential trends within those groups.Note: O Other, H Hispanic, B Non-Hispanic Black, API Asian, Pacific Islander, A eighted MOS FactorFull Equation1.0 O 3.0 H 2.0 B1.0 O 3.0 H 2.0 B 4.0 API1.0 O 10.0 H 8.0 B 16.0 API1.0 O 9.0 H 5.0 B 16.0 A1.0 O 10.0 H 5.0 B 20.0 A1.0 O 2.0 H 2.0 B1.0 O 2.5 H 3.0 B1.0 O 1.0 H 1.0 B[1.0 O 1.0 H 1.0 B][1.0 O 1.0 H 1.0 e 4. NYTS Stage Three Sampling Strategy Stratification Definitional Changes by YearNote: School stratification proportions vary by year. Thus, the probability of selection for a singleschool of the same size may change from sample wave to wave. Small changes in probability ofselection may lead to trend 4Percent of Schools Selected by Strata A9%14%NA78%77%14%9%NAOur mission is to conduct high quality social science research in the public interest. 7
Figure 5. NYTS Stage Three Sampling Strategy Stratification Definitional Changes by YearNote: School stratification definitions vary by year. Thus, the probability of selection for a singleschool of the same size may change from sample wave to wave. Small changes in probability ofselection may lead to trend breaks.Sample Design,SchoolDesignationas LargeYear1999 - 20062009 - 201220132014Able tosample 125studentsSchools with at least50 students at eachgradeBetween 25 and 49 studentsper gradeMediumNANASmallNot able tosample 125studentsMore than 25students but fewerthan 50 students inone or more of theeligible grades for thelevelSchools with 25 orfewer students in oneor more of the eligiblegrades for the levelContained at least56 students ateach grade levelper schoolContainedbetween 28 and55 students pergrade per schoolDoubleNANALess than 25 students at anygrade levelContained lessthan 28 studentsper grade perschoolContain at least 50 studentsat each grade level. Thoseselected for two classes hadNon-Hispanic blackenrollments over 5%NAFigure 6. NYTS Number of Sampling Strata by YearNote: Number of units per sampling stage vary by year. Thus, the probability of selection for asingle school of the same size may change from sample wave to wave. Small changes in probabilityof selection may lead to trend 99200020022004661455 or 6classes1653605 or 6classes1002985 or 6classes912894 to 6classesYear2006912894 to 6classes20092011201220132014802001 or 2pergrade18210085931942442192201 or 2 1 or 2 1 or 2 1 or 2perperperpergrade grade grade gradeTwo per grade in large high minority schools for 2009, 2011 - 2014Our mission is to conduct high quality social science research in the public interest. 8
Figure 7. NYTS List of Substantial Changes by YearData Year20002002DescriptionSurvey fielding period moved from thefall to the spring.First stage stratification change fromdegree of urbanization and percent ofBlacks and Hispanics in the PrimarySampling Unit (PSU) to degree ofurbanization and geographic location.Increased sample sizes for TexasCalifornia and New York.Race ethnicity questions changed.Weighting adjustments for other nonresponse adjustments changed.Weight trimming calculations altered.The threshold of weights trimmedchanged from 10.0 to 3% of all weights.Weight post-stratification changes frompost-stratifying to the nation to poststratifying to Texas, California, NewYork, and the balance of the UnitedStates.Partial panel design for sample ofschools. This results in substantialchanges to the sampling methodologyand weighting.Selection of “large” PSU’s changedfrom selection with certainty to anyPSUs larger than the sampling intervalare split into a set of sub-PSUs such thatthe selection probability for theresulting PSU is less than 50%, witheach resulting PSU having a roughlyequal number of schools.Selection of PSUs changed fromstratifying by degree of urbanization andgeographic location to Census Regionand levels of truthsm exposure.Selection of PSUs changed fromimplicit stratification by 3-digit ZIP toimplicit stratification by 5-digit ZIP.Weighting changed in its entirety toinclude the panel survey respondents.Weights were not adjusted for nationalestimates before weight trimming butwere instead post-stratified after weighttrimming to national estimates of racialpercentages by grade.Post-stratification weighting changed.Other and unknown combined withWhite race/ethnicity.Potential ImpactRate of tobacco product usagelikely increased due to changesin fielding period (studentsolder).Changes in weights likely impactsub-populations and thus breakany potential trends within thosegroups.Changes in samplingmethodology and weightinglikely impact sub-populationsand thus break any potentialtrends.Our mission is to conduct high quality social science research in the public interest. 9
200420062009Incentive changed from 1,000 perschool to no mention of an incentive.Selection of PSUs changed fromstratifying by Census Region and levelsof truthsm exposure to stratifying byCensus Region and MSA status.Selection of secondary sampling units(SSUs or schools) changed to includeimplicit stratification by first sorting theschools by highest grade, lowest grade,zip code and enrollment.Partial panel design retired. Thisresulted in substantial changes to thesampling methodology and weighting.NYTS oversight changed fromAmerican Legacy Foundation toCDC/OSH.Weighting changed in its entirety toexclude equations for the 2002 panelsurvey design.PSU Definition changed from largecounties or groups of smaller adjacentcounties to a county, or a group of smallcounties, or portions of large counties.Race/ethnicity questions changed.Post-stratification weighting changed.Other and unknown race/ethnicity firstimputed using hot-deck methods.First student exclusions mentionedincluding those enrolled in: regular schools who are unableto complete the questionnairewithout special assistance, alternative schools, special education schools, Department of Defenseoperated schools, vocational schools that onlyserve students who are enrolledat another school.Four Louisiana schools removed due toHurricane Katrina emergency response.Post-stratification weighting changed.Categories changed to grade, as well asalready used race/ethnicity categories.Selection of schools (SSUs) changed toinclude implicit stratification by firstsorting the schools by grade, zip codeand enrollment.Sampling and weighting realigned to beSchool may choose to notparticipate due to the reducedincentive. A thorough bias studyis needed to determine potentialimpacts.Changes in weights andrace/ethnicity questions likelyimpact sub-populations and thusbreak any potential trends withinthose groups.Deviations from the originalsample design likely impactstrends. The Louisiana schoolswere not replaced and thusfewer southern schools wereincluded in the sample for 2006.Changes in weights likely impactsub-populations and thus breakany potential trends within thosegroups.Changes in sampling andOur mission is to conduct high quality social science research in the public interest. 10
2011consistent with Youth Risk BehaviorSurvey (YRBS). The samples weredrawn to be non-overlapping samples ofschools between surveys.Stratification: minority concentrationand urban status.Selection of PSUs changed fromstratifying by Census Region and MSAstatus to stratifying by non-Hispanicblack or Hispanic composition andMSA status.Selection of PSUs changed fromimplicit stratification by 5-digit ZIP toimplicit stratification by state and 5-digitZIP.SSU definition changed to include"fragment" schools.SSU selection changed from school sizeto school level (middle schools, highschools), size, and proportion ofminorities.Selection of students changes fromclustering by class to clustering by gradeand class.Weights changed to take fragmentschools into consideration.Weight trimming: survey weights notadjusted to stratum population totalbefore trimming, post stratification totalused for population adjustments aftertrimming.Weights were not adjusted for nationalestimates before weight trimming butwere instead post-stratified after weighttrimming to national estimates of schooltype, sex, as well as already used gradeand race/ethnicity categories.The Centers for Disease Control andPrevention, Office on Smoking andHealth (OSH) and the Food and DrugAdministration, Center for TobaccoProducts (CTP) began collaboratingtogether on the NYTS. NYTS is nowfielded on an annual basis.Selection of PSUs changed fromstratifying by Census Region and MSAstatus to stratifying by ethnic/racialcomposition and MSA status. Schoolsampling weights formulas changed.Post-stratification: survey weights notadjusted to race/ethnicity whereasbefore it was adjusted only to race.weights likely impact subpopulations and thus break anypotential trends within thosegroups.Changes in weights likely impactsub-populations and thus breakany potential trends within thosegroups.Changes in questionnaire designmay impact response rates aswell as the quality of responses.Our mission is to conduct high quality social science research in the public interest. 11
201220132014The NYTS questionnaire will align totasks assigned to OSH in odd years (e.g.2011).SSU selection changed from schoollevel (middle schools, high schools),size, and proportion of minorities toschool level and size only.Base weights, moved from conditionalstudent weights to adjusted conditionalstudent weights. Also, moved fromcluster schools to linked schools.Post-stratification weights firstcalculated for middle school and highschools separately.The NYTS questionnaire will moreclosely align to tasks assigned to CTPon even years (e.g. 2012).The development and implementationwas coordinated with the 2013 YRBS toavoid duplicative efforts and tominimize potential burden on schoolparticipants.Selection of PSUs changed fromstratifying by ethnic/racial compositionand MSA status to ethnic/racialcomposition, non-Hispanic black andHispanic, and MSA status.Post-stratification race/ethnicitycategories redefined.PSU selection changed by removingMOS component.SSU selection changed from probabilityproportional to weighted schoolenrollment with weighted MOS toprobability proportional to eligibleschool enrollment.Frame source was merged with asecondary source resulting in a coverageincrease among all public and nonpublic high schools of 23%, (15.5%increase public schools, 46% increasenon-public high schools).Odd year, OSH alignment ofquestionnaire.Changes in weights likely impactsub-populations and thus breakany potential trends within thosegroups.Changes in questionnaire designmay impact response rates aswell as the quality of responses.Changes in weights likely impactsub-populations and thus breakany potential trends within thosegroups.Changes in questionnaire designmay impact response rates aswell as the quality of responses.Changes in sample frame werelinked to an increase in coveragewhich may in turn reducecoverage biases.Additional literature sources:Kennickell, A. B. (1999). Revisions to the SCF Weighting Methodology: Accounting forRace/Ethnicity and Homeownership. Federal Reserve Board, mimeo.Our mission is to conduct high quality social science research in the public interest. 12
NYTS Weighting Overview Weights are provided for use when computing health risks for all NYTS data files, including estimates of tobacco usage. We briefly describe the weighting methodology used within the NYTS below. For each sample year of the NYTS, weights are in place to make sure the sample is representative of
