Transcription
Tweeting Left,Right & Center:How users and attentionare distributed across TwitterDeen FreelonAssociate Professor in the HussmanSchool of Journalism and Media
Executive summaryMore than 48 million Americansuse Twitter, one of the most popularsocial networking platforms, andone used extensively by media andpolitical junkies. This study analyzedmore than 86 million tweets postedin 2017 to reveal how users fromacross the political spectrum engagedifferently with news issues andmajor media outlets on Twitter. Weassigned randomly-sampled usersideology scores based on who theyfollow, then divided them into foursegments: extreme left, center left,center right, and extreme right.Key findings:The center left is the largest segment present on Twitter byfar. The extreme right is a distant second in size, followed bythe center right and extreme left.The extreme right is more extreme than the extreme left.The ideology scores for users in the extreme right segment aresubstantially further from the center than those in the extremeleft.The center-left and extreme-left segments behave morelike each other than the center-right and extreme-rightsegments do. Both left segments referenced more of thesame accounts, whereas the center-right and extreme-rightwere generally engaged with very different types of accountsfrom one another.Pundits for the extremes, mainstream media for the center.Users in the two center segments referenced mainstreammedia accounts much more frequently than extreme users,who engaged more with opinionated sources.02
IntroductionThis report examines how American Twitter users of differingideologies expressed themselves in political contexts.The four main questions addressed are:1. What is the ideological balance of politicaldiscussions on Twitter? In particular, are theydominated by the center or the extremes?2. Who do politically-interested Twitter usersmention and reply to most often, and howdoes this differ based on their ideology?3. To what extent do users of differing ideologiesexpress civil and uncivil sentiments towardjournalists and news outlets?Key findings (continued):Users are more likely to insult news outlets than praiseor substantively criticize them; the extreme right is mostlikely to insult. No segment emerged as a clear leader insubstantive criticism, and praise is by far the rarest of thethree sentiments.The center segments attract more attentionthan the extremes. As the largest segment, sampled usersfrom the center left attracted the most retweets, mentions,or replies overall; but the much smaller center right segmentaccrued the most per user, indicating greater attention toposts on average.4. How is attention distributed acrossusers of differing ideologies?03
About our datasetsThroughout this analysis, we use three distinct,U.S.-focused Twitter datasets. The first, which wecall the “issue dataset,” consists of 60,735,013tweets posted throughout 2017 containingkeywords related to one or more of the followingmajor news issues of that year: Hurricanes North Korea Robert Mueller’sRussia investigation Sexual harassment White nationalism Mass shootingsOur second dataset, which we call the “newsoutlet dataset,” contains replies to the main Twitteraccounts of five leading American news outlets: New York TimesWashington PostCNNYahoo! NewsFox NewsThese replies span from Nov. 8, 2016 (Election Dayin the U.S.) through June 6, 2018. This datasetcontains 25,893,747 tweets in total.Our third dataset contains 1,000 unique screennames of users who claimed to live in the UnitedStates. These were sampled randomly from allpublic tweets posted between March 11 and March18, 2019.Additional details about our sample can be found inthe Methodological Appendix.04
Twitter user ideology scoring and segmentationAll the findings below rely on amethod of scoring Twitter usersbased on the ideological balanceof who they follow. It is a longrunning assumption in politicalscience and communicationresearch that “birds of a featherflock together;” in other words,that individuals of similar politicalpersuasions tend to communicateand associate with one another morethan with those of differing beliefs.This assumption led digital politics researcher Pablo Barbera to createa method of assigning ideology scores to Twitter users on a left-rightdimension based on who they follow, specifically “elite user” accounts.Barbera generally defines “elites” as well-known individualswith some degree of interest in politics, including actors,musicians, organizations of various types and media outlets,in addition to elected officials and other governmentalauthorities. To oversimplify a bit, the more right-wing eliteusers you follow (and the more extreme they are), the morelikely you are to be right-wing yourself, and the same for leftwing elites. His scoring algorithm uses a database of 1,186elites whose scores are known, and the scores of unknownusers are generated based on which of these known elitesthey follow. More details on this method are available in theMethodological Appendix and in Barbera’s research articleintroducing the algorithm.1The ideology score spans a single numerical dimensioncentered on zero. Users who follow a balance of progressiveand conservative elite accounts will have a score near zero,those who mostly follow the latter will have a positive score, andthose who mostly follow the former will have a negative score.Once user ideology scores in our datasets were calculated,we categorized each into one of four ideological segmentsbased on their score: extreme left (less than -1.0), center left(-1.0 to 0), center right (0 to 1.0), and extreme right (greaterthan 1.0).2 (For an in-depth explanation of why we chose theseparticular boundaries, consult the Methodological Appendix.)Table 1 displays a few example elites and theircorresponding ideology scores and segments in order frommost progressive to most conservative:05
Table 1Example ideology scores and segmentsScreen nameDescriptionIdeology score@MomsDemandMoms Demand Action (gun control advocacy group)@repjohnlewisJohn Lewis (D-GA, House representative for GA’s 5th district andcivil rights leader)-1.44@LeoDiCaprioLeonardo DiCaprio (actor and environmental activist)-0.87@sen joemanchinJoe Manchin (D-WV, senior senator of West Virginia, known for hisbipartisanship)-0.26@sendeanhellerDean Heller (R-NV, former senator from Nevada, a moderate whoinitially repudiated President Trump and later embraced him)0.31@FoxNewsFox News Channel (conservative-leaning US cable news network)0.76@HeritageThe Heritage Foundation (conservative think tank)1.17@WayneDupreeShowWayne Dupree (conservative radio show host and USAF veteran)1.58Segment-1.66EXTREME LEFTCENTER LEFTCENTER RIGHTEXTREME RIGHTWe should note that while this method works well in the aggregate,there are certain classes of users for whom it does not workwell. Probably the most relevant example here is journalists, whooften follow accounts of different ideological persuasions withoutnecessarily agreeing with them. This limitation notwithstanding,we believe the method is valid for most non-journalist users, whoconstitute the majority of our data samples.06
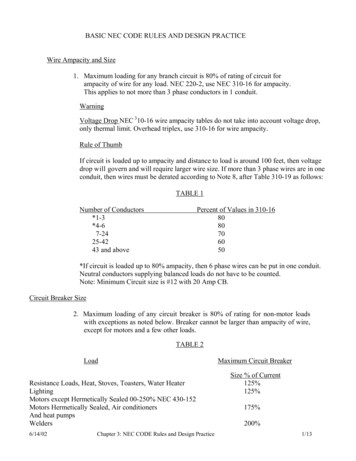
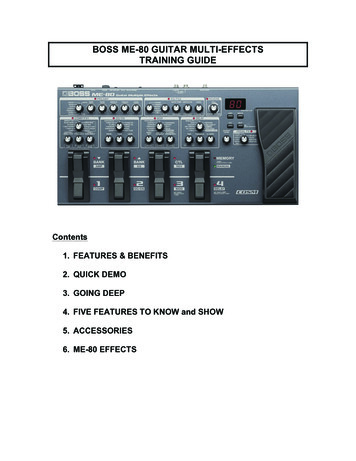
Twitter ideologies: Baseline measureWe obtained a baseline measure of Twitter ideology by drawing andassigning ideological scores to a random sample of 1,000 AmericanTwitter users during one week in March 2019.3 This sample was nottopically bounded and thus includes users who engage on a varietyof political and non-political subjects. The result is an ideologicaldistribution of American Twitter users that is not biased by priorchoices of topic or addressee (Figure 1).Figure 1Figure1Baseline: American Twitter Ideology Score DistributionBaseline: American Twitter Ideology Score DistributionEXTREME LEFT10%CENTER LEFT57%CENTER RIGHTEXTREME RIGHT8%25%07
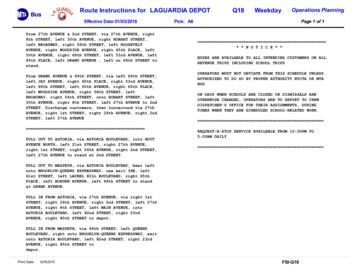
Figure 2Histogram of baseline ideology scores (see Apendix on page 26)The general pattern revealed inFigures 1 and 2, which will also bepresent in most of the subsequentanalyses, is that most AmericanTwitter users are center-left.Specifically, 57 percent of users fallbetween -1 and 0 on the ideologyscale: by comparison, 10 percentfall below -1 (far left), 8 percent arebetween 0 and 1 (center right), and25 percent are above 1 (far right).Thus, as far as ideology can beinferred through follower patterns,the center left is the largest segment,followed by the far right, then the farleft, with the center right in last place.News Engagement by IdeologyAs with the baseline, we find that the users in our issue andnews outlet samples are heavily concentrated in the centerleft, with much smaller numbers in the extreme left, centerright, and extreme right.To reach this conclusion, we drew random samples of 1,000users from each outlet or issue within each dataset andcalculated an ideology score for each user.Engagement on news issuesFigure 3 (See Appendix on page 26) displays the ideologicaldistribution for all users sampled from the news issue dataset.Overall, there are far more left-leaning users than right-leaningones engaging with these news issues on Twitter: 77.5 percentof all users have scores below zero. On the left, most usersstick fairly close to the center: two-thirds (67 percent) of allusers fell between -1 and 0. Only three users fell below -1.5,but 393 users scored above 1.5, indicating a stark differencebetween the extreme left and extreme right. Generally, theleft is crammed into a narrow ideological range, while rightleaning users are spread much more evenly over a broaderrange. Overall, these figures skew to the left of the baseline,containing 0.2 percentage points fewer far left users, 10.3points more center left users, 0.8 points fewer center rightusers, and 9.3 points fewer far right users.Figure 5 shows the center and extremes for the issue sample.08
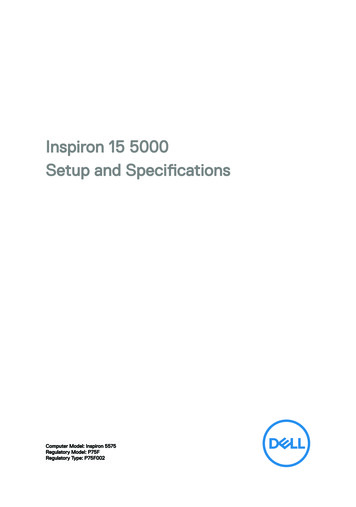
Figure5Figure logical segmentby rassmentMuellerinvestigationEXTREME LEFT11.4%CENTER EXTREME RIGHT60.2%11.5%North KoreaBASELINE (SEE FIGURE 1)CENTER LEFT5.1% 8.7%4.4% 3%12.6%25%09
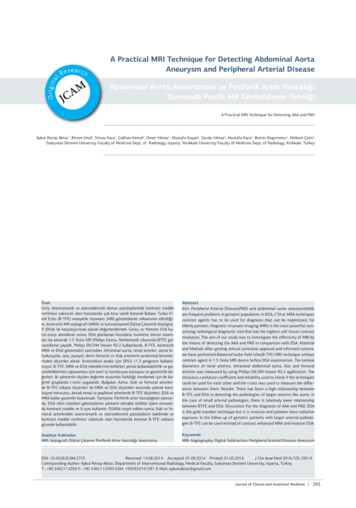
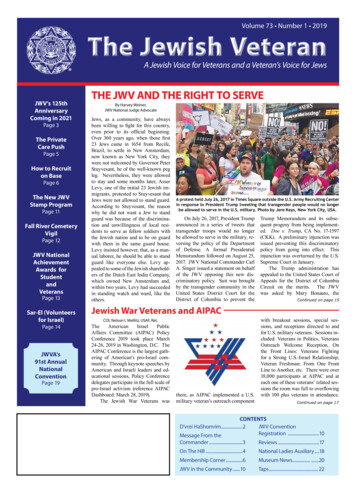
The bars show the proportions of each issue’s sampled users thatfalls into each segment. The center left definitively dominates Twitterdialogue on all six issues, while the extreme left occupies a tinyproportion of each issue’s audience. The two conservative segmentsare comparatively small, but it is notable that the center right is muchsmaller across all issues than the extreme right, which is generallycomparable in size to the extreme left.Engagement with news outletsNow let’s turn to users who reply directly to news outlets. While thisgroup is by no means representative of the U.S. population, they areamong the most engaged with current events generally and newscoverage thereof specifically. When we look at all sampled usersacross the five outlets who followed five or more political elites(94.8 percent of the total), we see that 56.2 percent of users are leftof-center while 43.8 percent are right-of-center. This might at firstseem fairly balanced, but a closer look at Figure 6 reveals that theleft again occupies a much narrower ideological range than the right.Without exception, every left-of-center user falls between 0 and -1.49,while the right features 962 users with scores above 1.5. As withthe issue tweets, there appears to be a large but narrow center leftsegment, a small extreme left, and a much wider spectrum of rightwing opinion.Applying this same analysis to each outlet individually revealsthree distinct patterns of ideological participation (Figure 7, seeappendix page 29). The first is exemplified by the New York Timesand the Washington Post, both of which attract primarily progressiverespondents (67.8 percent left-of-center for the former and 69.4percent for the latter). CNN and Yahoo! News are more ideologicallybalanced, with 53 percent and 53.9 percent left-of-center respectively.Finally, as might be expected, Fox News’ respondents are mostlyright-wing, with only 36.9 percent scoring less than zero. Thesefindings defy the conventional wisdom that social media commentaryon journalism comes mostly from disgruntled trolls who don’t evenread the content they’re writing about. Instead, they suggest thateach outlet has an ideological “mainstream” that produces most ofits digital responses, as well as a substantial minority of commentersfrom outside that mainstream. The Times’ and the Post’s mainstreamsare left-of-center, CNN’s and Yahoo’s are more centrist, and FoxNews’ is right-of-center. These findings are consistent with whatwe already know about which news outlets progressives andconservatives trust most.4Breaking the user distributions down by segment reveals a ratherdifferent picture than we saw with the issue tweets (Figure 8). As withthe issue tweets, the center accounts for majorities or pluralities ofeach outlet’s audience except for Fox News, which is understandablydominated by the far right. But compared to the issue conversations,the two right-wing segments claim a much larger combined presencehere. The main similarity to the issue distributions is the small size ofthe extreme left, which does not differ substantially between outlets.These figures skew slightly to the right of the baseline, containing6.3 percentage points fewer far left users, 4.8 points fewer center leftusers, 4.7 points more center right users, and 6.5 points more centerright users.10
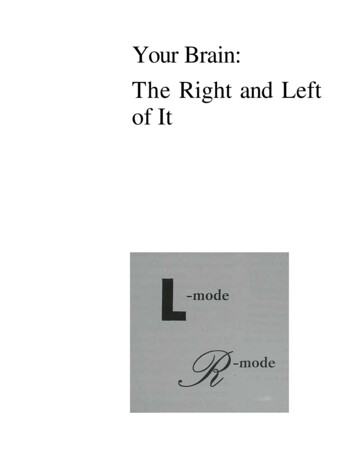
Together, Figures 5 and 8 paint a picture that is consistent with priorresearch on Twitter users’ politics: a dominant center left, a moribundfar left and center right, and a far-right that is much more extreme thanany other segment.5 The center left especially dominates discussionof popular political issues, while the right seems to be more interestedin interacting directly with news outlets. However, the right onlyoutnumbers the left in replies to @FoxNews, falling below 50 percentof users in the remaining 10 samples across both datasets. Thereare some interesting differences between news outlets, with the twonational papers appearing to draw a more left-wing audience thanCNN and Yahoo! Finally, it is worth noting how the opposing centerand extreme segments differ in size between the datasets: with theissues, the extremes are relatively close in size, while the center-leftdwarfs the center-right. The news dataset reprises the pattern amongthe center segments, but here the extreme right vastly outnumbers theextreme left.Baseline comparisonComparing ideological distributions between the two datasetsis instructive, but by comparing the baseline to the two datasetsstatistically, we can demonstrate how much more right- or left-wingeach subsample is relative to Americans on Twitter generally. Themath here is fairly simple: the proportions of each segment withineach subsample is subtracted from the corresponding proportion inthe baseline. Each difference thus represents the degree of deviationfrom the baseline segments, or in other words, how much more eachsegment is represented compared to a random sample of AmericanTwitter conversation. Figure 9 displays the results of this analysis,which supports a clear distinction between the two datasets. Amongall six issue subsets, the center left is overrepresented while the farright is underrepresented. But for news outlets the general patternis reversed: the right is overrepresented in the replies to three offive outlets, while the center left is underrepresented in those samethree. The extreme left and center right hew close to the baseline forthe issues, but the former is consistently underrepresented for newswhile the latter is consistently overrepresented. The most importantconclusion to draw here is that the right seems more interested inaddressing news outlets than the left, which is more concerned withdiscussing specific political issues.11
FigureFigure 8 toutletIdeological segmentNEWS OUTLETNew E (SEE FIGURE 1)EXTREME LEFTCENTER LEFT9.4%CENTER %16.6%13.9%47.9%4.9%EXTREME RIGHT35%13.8%12.5%57%32.4%50.5%8%25%12
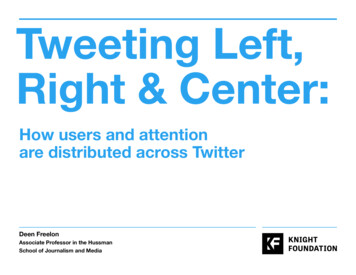
Analyzing Twitter users’ ideological distributions within variouspolitical contexts is only the first step toward understanding politicaldifference on the platform. We continue by exploring who the centersand the extremes reply to in their tweets, and how these replypatterns overlap. We assume that segments that reply to similar setsof accounts are participating in the same general conversations,while those that reply to separate sets of accounts are talking pastone another. To quantify this property, we extracted from each newsoutlet dataset the complete list of screen names replied to by atleast one of the users we sampled.6 Then, we calculated a “similarityscore” by computing the cosine similarity between each segmentpair’s reply lists for each issue and outlet. The higher the similarityscore between two segments, the more similar their reply lists (seethe Methodological Appendix for more details). Each outlet has sixsimilarity scores, one per segment pair.News issue tweetsIn Figure 10 (see page 17), the bars represent the degree of overlap inusers referenced by each segment. The height of each bar representsthe magnitude of the similarity score. In other words, higher barsreference similar sets of users; lower bars reference very different setsof users. The extreme and center lefts share the most similar referencegroups, as their similarity score is the highest of the six across all sixissues. Most of the other segments are fairly far apart in terms of whothey reference, with the exception of the center right and extreme rightfor the Russia investigation.13
Figure 9Figure9 of news issues and outlet ideology segments to baselineComparisonComparison of news issues and outlet ideology segments to baselineISSUESEXTREME LEFTCENTER LEFTCENTER RIGHTEXTREME tionalismNorth Korea MuellerMassSexualInvestigation ShootingsHarassment14
FigureFigure 9,9con’t.Comparisonof logysegmentsto baselineComparison ofsegmentsto baselineNEWS OUTLETEXTREME LEFTCENTER LEFTNew YorkTimesYahoo!NewsCENTER RIGHTEXTREME ws15
News Outlet References:Who is replying to whom?Next, we analyzed which types of users each segment referencesmost often (by “reference,” we mean retweet, mention, or reply).We divided each account into one of six categories:Executive branch: Any accounts associated with the executivebranch or Donald Trump’s family.Non-executive government: Any other government account notincluded in the previous category.“Old” (traditional) pundits: Individuals and institutions associatedwith established media outlets who produce opinions as a substantialpart of their jobs.“New” pundits: Individuals who operate independently fromestablished institutions and are known for their opinions. Some ofthese are self-made internet personalities who make their living writingor broadcasting, while others are amateurs or volunteers.Mainstream media (MSM): Major news media outlets that produceat least some original journalism.Other: Accounts that do not fit into any of the above categoriesor that were suspended or deleted when we tried to classify them.The height of each bar in Figure 11 indicates the proportion of eachsegment’s top10 most popular references accounted for by each ofthe six types. For each segment, we divided the raw count for eachaccount type by 60 since there are 10 accounts for each of the sixissues. The clearest patterns here involve the mainstream media andthe two pundit categories. The extremes engage disproportionatelywith pundits, while the center segments rely much more on traditionalmedia. Despite its well-known distrust of mainstream media outlets,the extreme right engages with its members more often than theextreme left. Government accounts are fairly unpopular across theboard, as are unclassifiable or deleted accounts.To illustrate the above, Tables 2a through 2f (see Apendix onpages 31-33) show the 10 most-referenced users by issue withineach segment, along with how often they were referenced. Thecolors indicate the account types described above. These show thatthe segment’s engagement with different account types dependedsomewhat upon the issue. For example, mainstream media accountsgenerally did not make it into the extreme left’s top 10, but the issue ofsexual harassment was a major exception. Similarly, the extreme rightengaged with mainstream media outlets much more than usual onsexual harassment and on the Russia investigation.These tables also reveal which accounts are major sources ofgeneral information and opinion across issues for each segment.As might be expected, Donald Trump (via either @realdonaldtrumpor @potus) shows up in most of the lists regardless of ideologicalleaning. @foxnews appears at either #1 or #2 on all of the extremeright’s lists, with conservative actor @realjameswoods (five lists) andconspiracy theorist @prisonplanet (four lists) also proving popular.16
Figure 1010FigureUser overlapbybyissueUseroverlap referencesissueEXTREME LEFTCENTER LEFTEXTREME LEFTCENTER RIGHTEXTREME LEFTEXTREME RIGHTCENTER LEFTCENTER RIGHTCENTER LEFTEXTREME RIGHTCENTER RIGHTEXTREME RIGHT0.90.80.70.60.50.40.30.20.10HurricanesNorth Korea MuellerSexualWhiteMassInvestigation Harassment Nationalism Shootings17
Figure 11References by account type (news issue tweets)Figure 11References by account type (news issue tweets)EXECUTIVE BRANCHNON-EXECUTIVEGOVERNMENTTRADITIONAL PUNDITSNEW PUNDITSMAINSTREAM MEDIAOTHER0.60.50.40.30.20.10Extreme LeftCenter LeftCenter RightExtreme Right18
Congressman and prominent Trump opponent @tedlieu (D-CA)appears on all 12 left lists, making him the left’s most popular accountby far. Other prominent accounts on the left and center-left includeVirginia Commonwealth University graduate student @rvawonk (sevenappearances), “Never Trump” Republican pundit @ananavarro(six appearances), and anti-Trump law professor and author@sethabramson (five appearances).News outlet tweetsReprising the similarity scores (cosine analysis) for the news outlettweets, we see some similarities and differences from the issue data.The bars in Figure 12 fall into three loose categories. The NYT showsa high relative degree of ideological separation: most segment pairsdo not share substantial numbers of replied-to users, except for theextreme left and center left, which are much higher than the others.Users who reply to Fox News, in contrast, experience the mostideologically integrated conversation of the five outlets in that thesame reply targets appear in large numbers across all segments. Inthe middle are the Washington Post, CNN, and Yahoo! News, whichdisplay intermediate levels of separation. If we take the averagesimilarity score as an indication of the overall polarization of eachoutlet, the Times has the lowest scores (0.3), the Post, CNN, andYahoo! are in the middle (0.57, 0.64, and 0.65 respectively), and FoxNews is the highest (0.94).A second set of conclusions pertains to how each segment relates toone another across outlets. The center- and extreme left consistentlyreply to similar sets of screen names, but for the center- and extremeright, this tendency varies by outlet. The two right-wing segments ofthe Times are talking to very different groups of users, but they aremore similar for the Post, CNN, and Yahoo! and close to identicalfor Fox News. The two extremes increasingly occupy the sameconversational space as we move from left to right. The content ofthese conversations is contentious in many cases and sometimesdownright uncivil, themes to which we will return in the next section.Direct feedback to outlets:Praise, constructive criticism or insult?Our third analysis considers the content of the messages thatcommenters directed at the outlets and other users discussed in theprevious section. We collected this data by randomly sampling 1,000replies from each outlet’s tweet collection (5,000 tweets in total),ensuring that each was authored by a different user. A team of fourresearch assistants read each reply and judged whether it containedpraise, constructive criticism, or insults directed at the outlet or itsemployees. Each tweet had to be judged as containing the sentimentby a majority of the research assistants to be designated as such inthe final dataset. For more details on how we conducted this analysis,please see the Methodological Appendix.(See Figure 13 on page 22)19
Figure 12Figure12User overlap in ideological segment references by outletUser overlap in ideological segment references by outletEXTREME LEFTCENTER LEFTEXTREME LEFTCENTER RIGHTEXTREME LEFTEXTREME RIGHTCENTER LEFTCENTER RIGHTCENTER LEFTEXTREME RIGHTCENTER RIGHTEXTREME RIGHT10.90.80.70.60.50.40.30.20.10New YorkTimesWashingtonPostCNNYahoo! NewsFox News20
Figure 13 provides a first look at our findings. It shows that everysentiment occupies the same ranked position within each outlet.Without exception, insult is the most common sentiment, followed bycriticism, then praise. Moving to between-outlet differences, the NewYork Times has the highest amounts of all three sentiments, while FoxNews has the least of all three (or is tied for least). Users seem to bemost motivated to speak out about coverage they take issue with,while rarely seeing anything worth praising or endorsing publicly.However, we should note that these comments collectivelyrepresent a minority of all replies posted in each sample. Users rarelyaddressed their comments to the quality of news coverage of a givenevent; instead, they typically remarked directly on the event itself. Insome cases, they aimed their ire against one another in the kinds ofpartisan flame wars for which social media are notorious. But at leastin our data, the social media discussions around major media outletswere largely not cesspits of anti-journalist enmity, even in this era ofso-called “fake news.”When we analyze praise, criticism and insults according to whichsegment posted each, several interesting conclusions emerge (seeFigures 14d - 14e). The colored bars represent the numbers of eachtype of sentiment per capita. For example, Figure A shows that therewere 0.54 insulting tweets per New York Times-commenting extremeright user. Correcting for the number of users in each segment isessential because the segments differed greatly in size. In fact, Yahoo!News was the only outlet that contained any extreme left users thattweeted messages falling into one of the sentiment categories.These charts provide clear evidence that most of the insulting tweetscame from extreme right users. The major exception to this is Fox,from which most insulting messages come from center-left users.Yahoo appears to be another exception, but the large swath of darkblue is deceptive: there were only two insulting extreme left messagesout of seven total extreme left individuals, which inflated the per capitaquantity. In contrast, the group of 293 extreme right users that repliedto Yahoo! News produced 61 insulting messages. So the extreme leftoutpaces the extreme right proportionately in terms of insults, but onlybecause of the former’s extremely small numbers.Comparing the two center segments to one another in terms ofinsults, we see that for every outlet except Fox News, the centerright posts more than the center left. This pattern is reversed for FoxNews. As we might expect, the center right is more insulting towardFox than the extreme right is, and across all outlets sends far fewerinsulting tweets than the extreme right. Given that the extreme left isnonexistent except for in Yahoo! News, this is clear evidence that thecenter segments behave very differently from the extremes.The patterns are less clear when we move to criticism. Nounambiguous leader emerges among the four segments across thefive outlets — the tendency to substantively critique news coverage ismuch more evenly distributed than insulting behavior. It is notable thatalthough the extreme right lobbed more insults per capita than theother segments, its members did not differ substantially from others interms of substantive critique. Another key difference from the insultingcategory is that Fox News does not differ greatly from the otheroutlets in the ideological distribution of criticism it receives, although itdoes receive the lowest total amount of every sentiment.21
Figure 13Figure13prevalence by type and outletSentimentFeedback Sentiment by OutletNEW YORK TIMESWASHINGTON POSTCNNYAHOO NEWSFOX NEWS0.60.50.40.30.20.10PraiseCriticismInsult22
References by Ideology:Who gets the most attention?In our final analysis, we looked at which of the issue dataset segmentsreceived the most references. After extracting all tweets mentioningat least one of the users we sampled, we counted how many timesthey had been mentioned, replied to, or retweeted and then adjustedfor the number of users in each segment. This generates counts ofreferences per capita for each segment, allowing us to understandhow much attention it garners relative to its size.Figures 15 and 16 show us that the center segments clearlyattracted the most attention, but before we explore further, let’s startby considering the raw numbers. As Figure 15 shows, the center leftsample accounted for the most references by far (183,274 in total), butit is also the largest segment, with over 4.5 times more unique accountsthan the next largest segment, the extreme right. When we correctfor such vast differences in segment size (Figure 16), we se
left again occupies a much narrower ideological range than the right. Without exception, every left-of-center user falls between 0 and -1.49, while the right features 962 users with scores above 1.5. As with the issue tweets, there appears to be a large but narrow center left segment, a small extreme left, and a much wider spectrum of right-