Transcription
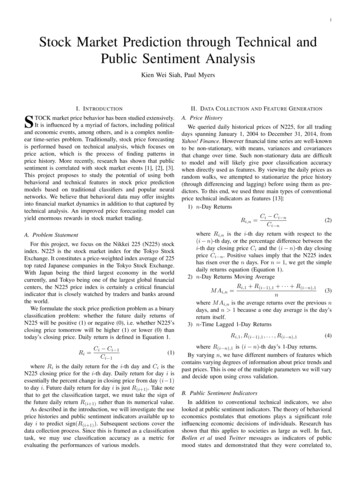
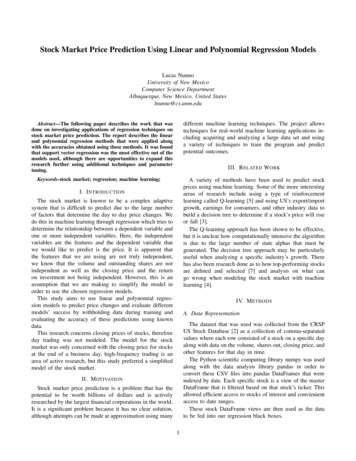
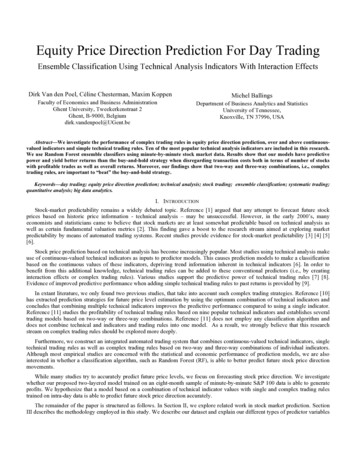
Equity Price Direction Prediction For Day TradingEnsemble Classification Using Technical Analysis Indicators With Interaction EffectsDirk Van den Poel, Céline Chesterman, Maxim KoppenFaculty of Economics and Business AdministrationGhent University, Tweekerkenstraat 2Ghent, B-9000, Belgiumdirk.vandenpoel@UGent.beMichel BallingsDepartment of Business Analytics and StatisticsUniversity of Tennessee,Knoxville, TN 37996, USAAbstract—We investigate the performance of complex trading rules in equity price direction prediction, over and above continuousvalued indicators and simple technical trading rules. Ten of the most popular technical analysis indicators are included in this research.We use Random Forest ensemble classifiers using minute-by-minute stock market data. Results show that our models have predictivepower and yield better returns than the buy-and-hold strategy when disregarding transaction costs both in terms of number of stockswith profitable trades as well as overall returns. Moreover, our findings show that two-way and three-way combinations, i.e., complextrading rules, are important to “beat” the buy-and-hold strategy.Keywords—day trading; equity price direction prediction; technical analysis; stock trading; ensemble classification; systematic trading;quantitative analysis; big data analytics.I. INTRODUCTIONStock-market predictability remains a widely debated topic. Reference [1] argued that any attempt to forecast future stockprices based on historic price information - technical analysis – may be unsuccessful. However, in the early 2000’s, manyeconomists and statisticians came to believe that stock markets are at least somewhat predictable based on technical analysis aswell as certain fundamental valuation metrics [2]. This finding gave a boost to the research stream aimed at exploring marketpredictability by means of automated trading systems. Recent studies provide evidence for stock-market predictability [3] [4] [5][6].Stock price prediction based on technical analysis has become increasingly popular. Most studies using technical analysis makeuse of continuous-valued technical indicators as inputs to predictor models. This causes prediction models to make a classificationbased on the continuous values of these indicators, depriving trend information inherent in technical indicators [6]. In order tobenefit from this additional knowledge, technical trading rules can be added to these conventional predictors (i.e., by creatinginteraction effects or complex trading rules). Various studies support the predictive power of technical trading rules [7] [8].Evidence of improved predictive performance when adding simple technical trading rules to past returns is provided by [9].In extant literature, we only found two previous studies, that take into account such complex trading strategies. Reference [10]has extracted prediction strategies for future price level estimation by using the optimum combination of technical indicators andconcludes that combining multiple technical indicators improves the predictive performance compared to using a single indicator.Reference [11] studies the profitability of technical trading rules based on nine popular technical indicators and establishes severaltrading models based on two-way or three-way combinations. Reference [11] does not employ any classification algorithm anddoes not combine technical and indicators and trading rules into one model. As a result, we strongly believe that this researchstream on complex trading rules should be explored more deeply.Furthermore, we construct an integrated automated trading system that combines continuous-valued technical indicators, singletechnical trading rules as well as complex trading rules based on two-way and three-way combinations of individual indicators.Although most empirical studies are concerned with the statistical and economic performance of prediction models, we are alsointerested in whether a classification algorithm, such as Random Forest (RF), is able to better predict future stock price directionmovements.While many studies try to accurately predict future price levels, we focus on forecasting stock price direction. We investigatewhether our proposed two-layered model trained on an eight-month sample of minute-by-minute S&P 100 data is able to generateprofits. We hypothesize that a model based on a combination of technical indicator values with single and complex trading rulestrained on intra-day data is able to predict future stock price direction accurately.The remainder of the paper is structured as follows. In Section II, we explore related work in stock market prediction. SectionIII describes the methodology employed in this study. We describe our dataset and explain our different types of predictor variables
as well as our prediction model and the evaluation metrics. In Section IV, we discuss our results in terms of variable importance.Finally, Section V details our conclusions.II. LITERATUREWhen dealing with the complex, non-linear and dynamic behavior of financial markets the use of more sophisticated tradingalgorithms is necessary. In search for methods to address these weaknesses and thanks to the advances in computing andtechnology, research focuses on the various tools of computational intelligence. The most popular algorithms reported in literatureare Logistic Regression, Neural Networks, K-Nearest Neighbors and Support Vector Machines [12]. Evidence of profitability ofthese trading algorithms is provided by numerous research articles [13] [14]. Among these machine learning techniques, NeuralNetworks have received the most attention.An important development in machine learning is the use of ensemble models, which simultaneously combine different types ofclassifiers. For complex problems involving noisy inputs, it has been shown to be extremely challenging to obtain accurate results.The premise of ensemble classification methods is the observation that classifiers of different types and/or using different dataexhibit distinct strengths and weaknesses, which has led to the belief that combining multiple classifiers can improve predictionaccuracy [15]. While most studies use single classifiers for forecasting stock prices, ensemble classification methods such asRandom Forest, AdaBoost and Kernel Factory remain largely unexplored [12].Reference [6] compares four prediction models (RF, ANN, SVM and Naive-Bayes) and concludes that for continuous-valueddata Random Forest outperforms the other three models, while it is ranked second in the case the algorithms are trained on trenddeterministic data. Reference [16] obtains better than random predictions when applying Random Forest on three different stockindices. Study [17], aimed at predicting the direction of daily change of the S&P CNF NIFTY INDEX, find that Random Forestperforms better than Neural Networks, Logit Models and Discriminant Analysis in terms of hit ratio. Only Support VectorMachines (SVM) perform marginally better. While it is clear that both Random Forest and SVM achieve good results, noconsensus is reached on which algorithm of the two performs best. In order to provide clarity on the matter, [12] carried out anextensive benchmark comparing seven machine learning techniques on yearly stock data. Their findings indicate that RandomForest is the top-performing algorithm. The proven superior performance of Random Forest makes it an excellent algorithm for usein this study.A second recent observation in stock price prediction is the gradual shift from using daily, weekly, monthly or yearly entries tointra-day high frequency data for algorithmic learning. The main motivation in favor of intraday trading horizons is the notion ofself-destruction of predictable patterns in stock prices [18]. This implies that predictability of stock returns is expected to weakenover time, as profitable trading strategies become known to the general public. Reference [19] finds that prediction models basedon daily or longer data intervals for predicting future stock returns mostly underperform. Incited by the observed profits, tradersunanimously start exploiting the profit opportunity, which in doing so, forces prices to adjust to new equilibria [20]. Similarly, [21]introduces the concept of the Adaptive Markets Hypothesis, arguing that arbitrage opportunities do exist from time to time, asprofitable trading opportunities are exploited, they disappear. But at the same time, changing business conditions induce new profitopportunities that exist until they – too – eventually collapse.Despite the relevance of intraday data among professional traders in practice, short-term stock price prediction is still largelyunder-represented in academic research [22]. Worth mentioning, however, are the contributions [10] [23] [24] [22]. These researcharticles commonly find evidence for intra-day market inefficiency, either totally or partially.In order to fill the existing gap in literature, it is worthwhile to investigate the performance and profitability of Random Foreston intraday one-minute stock data.III. METHODOLOGYA. ApproachIn our empirical analysis, we set out to examine whether the proposed model is capable of predicting future stock pricemovements and is able to translate this information into valuable buy/sell signals. We are mainly concerned with the profitability ofthe system. More specifically, we will investigate whether trading in accordance with the model predictions over a four-monthperiod yields a positive return, disregarding transaction costs.The developed model employs two different reasoning modules or architectural layers. We coin the first layer the FeatureEngineering layer and the second layer the Prediction layer. The first layer derives a set of simple and complex trading rules fromthe input data. The output of the Feature Engineering layer consists of the discrete values 1, -1 or 0, representing buy, sell or holdsignals, respectively. These signals serve as inputs to the Prediction layer, which employs Random Forest for feature learning andclassification.
B. DataFor this study we gathered a one-year sample of minute-by-minute stock data extracted from Bloomberg. The use of intra-dayhigh frequency data requires highly liquid equity markets. Therefore, we opt for stocks listed on the S&P100. The index consists ofalmost 45% of the market capitalization of the U.S. equity markets. The gathered data comprises the date and time, open-high-lowclose price levels and the volume traded for each stock. The entire dataset covers the period from April 8, 2014 to April 14, 2015.Due to some irregularities in the extracted data, only 91 stocks of the original 100 are suitable for use. Furthermore, we employ areduced dataset ranging from October 20, 2014 to April 14, 2015 for the following stocks: CMCSA, DD, DOW, HPQ, MDT,MET, NKE and GE. Lastly, ACT and CELG replaced APA and FCX in the S&P100 at the beginning of 2015. For the stock datato be consistent, historical prices and/or volume are adjusted to reflect spin-offs, stock splits/consolidations, stocks dividend/bonusand right offerings/entitlement. In this study, we use eight months for training (April 8, 2014 to December 5, 2014) and fourmonths for testing (December 6, 2014 to April 14, 2015). For the reduced datasets, the training set comprises three months(October 20, 2014 – February 18, 2015) and the test set two months (February 19, 2015 – April 14, 2015).C. ImplementationsWe used open-source R 3.2.1 using the parallel version of the randomForest package and RStudio as a modeling platform.Analyses required compute nodes of 512 GB RAM. Hence, the analysis is run on the Flemish Supercomputer featuring 16 of thosebig data HPC nodes.D. Feature EngineeringTaking into account computational limitations, we selected ten popular technical indicators that have proven to be successful inpredicting the direction of stock price movement in extant literature [25] [6] [26]. The ten indicators are: 1. Bollinger Bands (BB),Commodity Channel Index (CCI), Chaikin Accumulation/Distribution (ChaikinAD), Moving Average Convergence/Divergence(MACD), Relative Strength Index (RSI), Moving Average (MA), Weighted Moving Average (WMA), Stochastic Oscillator(Stoch), Triple Smoothed Exponential Oscillator (TRIX), Williams’ %R (WPR). These same ten indicators are used for a similarby [25] and [6].As previously mentioned in the Introduction Section of the paper, we employ a combination of continuous-valued indicators,single technical trading rules and complex trading rules as input variables to the prediction model.D.1. Continuous-Valued IndicatorsThe continuous-valued indicators are calculated using the standard formulae presented. In order to prevent features with largervalues from overwhelming those with smaller values, we standardize the obtained indicator values into new scores with mean zeroand standard deviation one.D.2. Single Technical Trading RulesNumber Trading rules give strict signals based on well-defined criteria for identifying market entry and exit points [27]. TheFeature Selection layer of our model is in charge of devising such trading rules for each of the technical indicators employed in thestudy.The first two technical indicators are moving averages (MA). The moving average crossover aims at detecting trend reversals,thereby generating buy and sell signals [28]. Two moving averages with differing lengths are plotted simultaneously. In this study,we set the moving average length for the short and long MA equal to ten and one hundred, respectively. A buy signal is triggeredwhen the short moving average crosses the long moving average from below, while a sell signal is generated when the shortmoving average intersects the long moving average from above [29].D.3. Complex Technical Trading RulesBesides single technical trading rules, the Feature Selection layer also generates complex trading rules based on two-way andthree-way indicator combinations. The main motivation for devising complex trading strategies is the observation that marketanalysts in practice do not rely on a single indicator for detecting trend reversals but rather combine the outcome of varioustechnical indicators [30].For combining multiple signals into a final buy/sell decision, we assign a larger weight to trade signals (buy or sell) than to holdsignals. For instance, in case two indicators generate a hold signal and the third indicator a buy signal, the final decision is to buy.In case of multiple trade signals we employ majority voting for deriving the final outcome. Thus, when two indicators generate asell signal and one indicator a buy signal, the final decision is in favor of selling. This way, we are able to model interactionsbetween the various indicators.In short, we employ ten technical indicators. This results in 18 continuous-valued indicators, 10 single technical trading rules,45 two-way combinations and 120 three-way combinations. In total, the feature selection layer of our model consists of 193
predictors used as input to the Prediction layer of the developed model. All technical trading rules are transformed to binaryvariables.D.4. ReturnsAs summarized in Section II numerous empirical studies provide evidence that classification algorithms are capable of beatingthe market. These results indicate that it may be possible to set up profitable trading strategies. Reference [16], for instance,constructed a trading system with break-even costs and finds the returns of the single day trading systems to exceed those of therandom walk and contrarian investment strategies.The trading strategy proposed in this study assumes a daily investment horizon. Profits and losses are determined per minutewith no reinvestment and no trading positions are held overnight. Finally, we exclude the presence of transaction costs. The tradingsystem works as follows: whenever a buy signal is triggered, the investor takes a long position in the respective share until a sellsignal is generated, at which point the trader simultaneously sells and goes short. This position is held until the next buy signal orthe end of the trading day, no positions are held overnight. In case the model generates two or more consecutive buy or sell signals,we focus on the first signal only, thereby ignoring subsequent signals.The 193 predictors presented above (Sections 3.3.1-3.3.3), which constitute the independent variables, along with the returnvalues, which form the dependent variable, serve as inputs to the prediction model.E. Predictive ModelAs discussed in the Data Section, the shares included in the S&P 100 index serve as input to the Feature Engineering layer,which is in charge of deriving continuous-valued indicators, single technical trading rules and complex trading rules yieldingdiscrete buy, sell or hold signals. Subseqently, the returns are determinded by applying the trading strategy to the generatedsignals. The predictors along with the return values are used for learning purposes. The ensemble algorithm identifies how stockmarket data and returns were related in the past and projects these insights to new data. The final classification decision of theensemble algorithm is one or zero, indicating a positive or negative return, respectively. The Random Forest model discernsvaluable signals from invaluable ones, thereby focusing on those trades expected to generate profit. Whenever the predictedprobability on a positive return exceeds the cut-off value, we assume the investor will execute the respective trade. The overallreturn generated by the model is then calculated by adding up the returns of the performed trades. Besides the overall profitabilityof the strategy over a four-month period, we also compute the return per trade.F. Model AssessmentAs discussed in the Data Section, the shares included in the S&P 100 index serve as input to the Feature Engineering layer,which is in charge of deriving continuous-valued indicators, single technical trading rules and complex trading rules yieldingdiscrete buy, sell or hold signals.IV. RESULTSOur results warrant the conclusion that complex trading rules seem to be more important than single trading rules. On average,two-way combinations add more than 15% to the accuracy (cfr. Fig. 1). Even more, adding a third rule increases the accuracy withalmost 7% on top of the 15%.Fig. 1: Average (RF) importance technical trading rules.These findings are confirmed when we consider the average importance per indicator (Fig. 2). The mean decrease accuracyincreases for two-way and three-way combinations. Interestingly, CHAIKIN, MACD, WPR and WMA clearly underform as single
technical trading rules but, on average, their importance increases when adding a second and a third trading rule. On average, CCI,STOCH, BB and its two-way and three-way combinations are among the trading rules that add most to the accuracy of our model.Fig. 2 Average (RF) importance per technical indicator.We find that five out of ten of the single technical trading rules are in the lower quartile (Fig. 3). The top quartile only consistsof complex trading rules. Our findings show that combinations with MA, TRIX and RSI increased accuracy the most. We observethat combinations of these trading rules with the best performing rules from our ten indicator analysis (CCI, STOCH, BB) results inthe largest mean decrease accuracy (Fig. 3). These findings confirm [11] as they conclude that the best models are based oncombinations with RSI, MA, STOCH, OBV and MFI.Fig. 3: Top ten technical trading rulesAs can be observed from Fig. 4, the partial dependence plot for the relative time indicator (rel.time) shows that the largestprobability for positive returns is during the opening of a trading day. This is in line with the findings by [31] indicating that tradersare most active in the morning since they can benefit from the existence of high volatility. The partial dependence plot for RSI(value.rsi) demonstrates that normalized RSI values smaller than -1 have large log-odds for positive returns. By rescaling thesevalues, we find that buying equity based solely on RSI values smaller than 39 results in an enhanced possibility of a positive return.Bollinger Band indicator (BB) consists of three values: lower Bollinger Band (lbb), upper Bollinger Band (ubb) and %B (pctB).Both lbb and ubb are relative since this allows us to compare between different stocks.1 The lbb and ubb partial dependence plotsare almost the exact opposite, which could be expected (Fig. 5). From the normalized lbb value of 0.5 we derive a relative lbb valueof 0.99. As a consequence, from the moment the stock price crosses the lower Bollinger Band, prices are considered to be oversold.Traders are able to buy at cheap prices and generate a positive return [29]. Thus, we find a large possibility for positive returns forrelative lbb values smaller than 0.99. The opposite is true for relative ubb values larger than 1.0003 (stock price crosses the upperBollinger Band). As a result, promising buy-and-sell signals can be derived by using these Bollinger Bands.1These indicator values are divided by the stock price.
V. CONCLUSIONThis study attempted to forecast intra-day stock price movement by combining continuous-valued technical indicators, singletechnical trading rules and complex technical trading rules. Random Forest was used as a prediction algorithm in our tradingsystem.Analyzing the importance of the different predictor variables resulted in interesting findings. It can be shown from the empiricalresults that continuous-valued technical indicators add most to the accuracy of our trading system. The variable indicating therelative time in a trading day is among the most important predictors, proving that the possibility of a positive return is largestduring opening and closing of a trading day. Complex trading rules outperform single trading rules for both the five-indicatoranalysis and the ten-indicator analysis. Two-way and three-way combinations with moving average cross-overs and signals derivedfrom a triple smoothed exponential oscillator yield the most important technical trading rules. Furthermore, these results arecomplemented by two trading signals with signals derived from the commodity channel index (CCI), stochastics (STOCH) andBollinger Bands (BB) is preferable. Some single trading rules (RSI, WMA, WPR) performed badly but their importance sharplyincreased combined with other technical trading rules. The V-shaped partial dependence plots of the continuous-valued technicalindicators suggest that extreme technical indicator values result in large log-odds of positive returns proving that both buying andselling based on these extreme values can yield positive returns.As a future study, it would be interesting to employ different ensembles for this model. In particular, an important contributionto existing literature would be to use hybrid ensemble methods suchs as hybridEnsemble by [12] which consists of eight differentsub-ensembles. Implementing transaction costs would be of further interest since it allows to better test the practicality of ourmodel. Analyzing multiple parameter settings for the best performing technical indicators may be subject to another futureresearch. Since our results show that many two-way and three-way combinations of technical trading rules have a higher meandecrease accuracy than the single trading rules, it would be interesting to further examine these effects in more detail.Detailed results for each of the 91 stocks in our test period - reported in Table I - reveal that 50 of the 91 stocks result in overallprofitable trades. This compares favorably to profitable trades in just 46 stocks in case of a buy-and-hold strategy, which barelyoutperforms the number of stocks resulting in losses (45 stocks). Hence, our active daytrading strategy clearly outperforms a buyand-hold strategy when disregaring transactions costs. The same conclusion holds when aggregating total returns. Future researchshould investigate the risk/return trade-off of such automated trading systems.VI. ACKNOWLEDGEMENTSThe computational resources (Stevin Supercomputer Infrastructure) and services used in this work were provided by the VSC(Flemish Supercomputer Center), funded by Ghent University, the Hercules Foundation and the Flemish Government –Department EWI.
Fig. 4. Partial dependence plotsFig. 5. Partial dependence plots (continued)
StockSymbolTABLE I.StockSymbolOUT-OF-PERIOD RETURN PER INDIVIDUAL STOCKPerformance During Test PeriodTotal ReturnReturn per TradeBuy and -0.0807CPerformance During Test PeriodTotal ReturnReturn per TradeBuy and 499GS
StockSymbolPerformance During Test PeriodTotal ReturnReturn per TradeBuy and RENCES[1]Malkiel, B.G., & Fama, E.F. (1970). Efficient capital markets: A reviewof theory and empirical work . The Journal of Finance, 25(2), 383 – 417.[2] Malkiel, B. G., & Burton, G. (2003). The efficient market hypothesisand its critics. The Journal of Economic Perspectives, 17(1), 59 – 82.[3] Hafezi, R., Shahrabi, J., & Hadavandi, E. (2015). A Bat-neural networkmulti-agent system (BNNMAS) for stock price prediction: Case study ofDAX stock price. Applied Soft Computing, 29, 196-210.[4] Huang, C.-J., Yang, D.-X., & Chunag, Y.-T. (2008). Application ofwrapper approach and composite classifier to the stock price prediction.Expert Systems with Applications, 34(4), 2870-2878.[5] Lee M.-C. (2009). Using support vector machine with a hybrid featureselection method to the stock trend prediction. Expert Systems withApplications, 36, 10896-10904.[6] Patel, J., Shah, S., Thakkar, P., & Kotecha, K. (2015). Predicting stockand stock price index movement using Trend Deterministic DataPreparation and machine learning techniques. Expert Systems withApplications, 42, 259-268.[7] Brock, W., Lakonishok, J., & LeBaron, B. (1992). Simple TechnicalTrading Rules and the Stochastic Properties of Stock Returns. Journal ofFinance, 47, 1731-1764.[8] Metghalchi, M., Chang, Y.-H., & Garza-Gomez, X. (2011). TechnicalAnalysis of the Taiwanese Stock Market. International Journal ofEconomics and Finance, 4(1), 90-102.[9] Gençay, R. (1997). The predictability of security returns with simpletechnical trading rules. Journal of Empirical Finance, 5, 347-359.[10] Tanaka-Yamawaki, M., & Tokuoka, S. (2007). Adaptive use oftechnical indicators for the prediction of intra-day stock prices. PhysicaA 383, 125-133.[11] Metghalchi M., Glasure Y., Garza-Gomez X. & Chen Ch. (2007),Profitable Technical Trading Rules For The Austrian Stock Market,International Business & Economics Research Journal, 6 (9), 49-58.[12] Ballings, M., Van den Poel, D., Hespeels, N., & Gryp, R. (2015).Evaluating multiple classifiers for stock price direction prediction.Expert Systems with Applications, 42, 7046-7056.[13] Miró-Julià, M., Fiol-Roig, G., & Isern-Deyà, A.P. (2010). DecisionTrees in Stock Market Analysis: Construction and Validation. Trends inApplied Intelligent Systems Lecture Notes in Computer Science, 6096,185-194. doi: 10.1007/978-3-642-13022-9 19[14] Chang, P-C., Fan, C-Y., & Liu, C-H. (2009). Integrating a PiecewiseLinear Representation Method and a Neural Network Model for StockTrading Points Prediction. Systems, Man, and Cybernetics, 39(1).[15] Ho, T.K., Hull, J.J., & Srihari, S.N. (1994). Decision Combination inMultiple Classifier Systems. IEEE Transactions on Pattern Analysis andMachine Intelligence, 16(1), 66-75.[16] Rodriguez, Pedro N., & Rodriguez, A. (200
intra-day high frequency data for algorithmic learning. The main motivation in favor of intraday trading horizons is the notion of self-destruction of predictable patterns in stock prices [18]. This implies that predictability of stock returns is expected to weaken over time, as profitable trading strategies become known to the general public.