Transcription
Trend-following strategies for tail-riskhedging and alpha generationArtur Sepphttps://artursepp.com, artur.sepp@gmail.com23 April 2018IntroductionBecause of the adaptive nature of position sizing, trend-following strategies can generate the positiveskewness of their returns, when infrequent large gains compensate overall for frequent small losses.Further, trend-followers can produce the positive convexity of their returns with respect to stockmarket indices, when large gains are realized during either very bearish or very bullish markets. Thepositive convexity along with the overall positive performance make trend-following strategies viablediversifiers and alpha generators for both long-only portfolios and alternatives investments.I provide a practical analysis of how the skewness and convexity profiles of trend-followers dependon the trend smoothing parameter differentiating between slow-paced and fast-paced trendfollowers. I show how the returns measurement frequency affects the realized convexity of thetrend-followers. Finally, I discuss an interesting connection between trend-following and stockmomentum strategies and illustrate the benefits of allocation to trend-followers within alternativesportfolio.ContentsIntroduction. 1Key takeaway. 2Risk-profile of quant strategies . 4Illustrations using hedge fund indices . 5The risk-profile of Trend-Following CTAs as function of return measurement frequency . 7Realized Skewness . 7Realized Convexity. 8Summary . 10Trend-following CTAs as hedge against the tail risk . 10Autocorrelation as explanatory factor for trend-followers returns . 12Measuring Autocorrelation . 13Returns on Trend-following CTAs conditional on autocorrelation . 16Construction of Trend-following strategy for the S&P 500 index . 171
Trend smoothing . 17Position size generation . 19S&P 500 Trend-following strategy. 21Risk profile of S&P 500 Trend-following strategy. 22Convexity profile . 23Impact of the frequency of the position rebalancing. 25Convexity Betas . 25Skewness . 27Linear beta . 28Performance . 29Trend-following vs Stock Momentum . 31Benefits of Trend-following CTAs for Allocations in Alternatives . 34References . 36Key takeaway1. The skewness and the convexity of strategy returns with respect to the benchmark are thekey metrics to assess the risk-profile of quant strategies. Strategies with the significantpositive skewness and convexity are expected to generate large gains during market stressperiods and, as a result, convex strategies can serve as robust diversifiers. Using benchmarkindices on major hedge fund strategies, I show the following. While long volatility hedge funds produce the positive skewness, they do not producethe positive convexity. Tail risk hedge funds can generate significant skewness and convexity, however at theexpense of strongly negative overall performance. Trend-following CTAs can produce significant positive convexity similar to the tail riskfunds and yet trend-followers can produce positive overall performance delivering alphaover long horizons.See Risk-profile of quant strategies2. Trend-following strategies adapt to changing market condition with the speed of changesproportional to the trend smoothing parameter for the signal generation. As result, when wemeasure the realized performance of a trend-following strategy, the return measurementfrequency should be low relative to the expected rebalancing period of the trend-followingstrategy. Using the data of SG Trend-following CTAs index, I show that trend-followers areexpected to produce both the positive skewness and convexity for monthly, quarterly andannual returns. As a result, trend-following strategies should not be seen as diversifiers forshort-term risks measured on the scales less than one month. Overall, I recommend applyingquarterly returns for the evaluation of the risk-profile of a trend-following strategy.See The risk-profile of Trend-Following CTAs as function of return measurement frequency3. By analyzing quarterly returns on the SG trend-following CTAs index conditional on thequantiles of quarterly returns on the S&P 500 index, I show that trend-following CTAs can2
serve as diversifiers of the tail risk. On one hand, the trend-followers generate significantpositive average returns with positive skewness conditional on negative returns on the S&P500 index. On the other hand, the trend-followers generate large positive returns, but withinsignificant skewness conditional on large positive returns on the S&P 500 index. Conditionalon index returns in the middle of the distribution during either range-bound or slow updrifting markets, the trend-followers generate negative returns yet with significant positiveskewness.See Trend-following CTAs as hedge against the tail risk4. The nature of trend-followers is to benefit from markets where prices and returns are autocorrelated, which implies the persistence of trends over longer time horizons. I present theevidence that the recent underperformance of trend-followers since 2011 to 2018 could beexplained because the lag-1 autocorrelation of monthly and quarterly returns on the S&P 500index become significantly negative in this sample period. The negative autocorrelationindicates the presence of the mean-reverting regime, even though the overall drift is positive,in which trend-followers are not expected to outperform. I introduce an alternative measureof the autocorrelation that can be applied to test for the presence of autocorrelation in shortsample periods. I show that my autocorrelation measure has a strong explanatory power forreturns on SG trend-following CTAs index.See Autocorrelation as explanatory factor for trend-followers returns5. To quantify the relationship between the trend smoothing parameter, which defines fastpaced and slow-paced trend-followers, and the risk profile of fast-paced and slow-pacedtrend-followers, I create a quantitative model for a trend-following system parametrized by aparameter of the trend smoothing and by the frequency of portfolio rebalancing. The backtested performance from my model has a significant correlation with both BTOP50 and SGtrend-following CTAs indices from 2000s using the half-life of 4 months for the trendsmoothing.See Construction of Trend-following strategy for the S&P 500 index6. Using the trend system parametrized by the half-life of the trend smoothing, I analyze atwhich frequency of returns measurement the trend-following strategy can generate thepositive convexity. The key finding is that the trend-following system can generate thepositive convexity when the return measurement period exceeds the half-life of the trendsmoothing and the period of portfolio rebalancing. I recommend the following. If a trend-following strategy is sought as a tail risk hedge with a short-time horizon ofabout a quarter, allocators should seek for trend-followers with relatively fast smoothingof signals with the average half-life less than a quarter. If a trend-following strategy is sought as an alpha strategy with a longer-time horizon,allocators should seek for trend-followers with medium to low smoothing of signals withthe average half-life between a quarter and a year.An alternative way to interpret the speed of the trend smoothing is to analyze the trendfollowing strategy beta to the underlying asset. For the slow-moving smoothing, the strategymaintains the long exposure to the up-trending asset with infrequent rebalancing. As a result,the higher is the half-life of the trend smoothing, the higher is the beta exposure to the index.Thus, while fast-paced trend-followers can provide better protection during sharp short-livedreversals, they suffer in periods of choppy markets. There is an interesting article onBloomberg that some of fast-paced trend-following CTAs fared much better than slowerpaced CTAs during the reversal in February 2018.3
See Risk profile of S&P 500 Trend-following strategy7. I examine the dependence between returns on the trend-following CTAs and on the marketneutral stock momentum. I show that the trend-followers have a stronger exposure to theautocorrelation factor and a smaller exposure of higher-order eigen portfolios. As a result, thetrend-following CTAs produce the positive convexity while stock momentum strategiesgenerate the negative convexity of their returns.See Trend-following vs Stock Momentum8. The allocation to trend-following CTAs within a portfolio of alternatives can significantlyimprove the risk-profile of the portfolio. In the example using HFR Risk-parity funds and SGtrend-following CTAs index, the 50/50 portfolio equally allocated to Risk-parity funds andtrend-following CTAs produces the drawdown twice smaller than the portfolio fully allocatedto Risk-parity funds. The 50% reduction in the tail risk is possible because the occurrence ofthe drawdowns of Risk-parity HFs and Trend-following CTAs are independent. While trendfollowers tend to have lower Sharpe ratios than Risk-parity funds, trend-followers serve asrobust diversifiers with 50/50 portfolio producing the same Sharpe ratio but with twicesmaller drawdown risk.See Benefits of Trend-following CTAs for Allocations in AlternativesRisk-profile of quant strategiesAll quantitative strategies have specific risk profiles characterized by the skewness of returns,performance in tail events, and cyclicality risk, when strategies perform only in certain market cycles.I have discussed the cyclicality risk of quantitative strategies in detail here.I consider the following key risk metrics to evaluate the risk profile and the performance attributionof quantitative investment strategies.1. Realized historical volatility of strategy returns. The volatility serves as a normalizing factorto compare different strategies on the same scale. I emphasize that, while the volatilityserves only as a static measure of the second-order risk, on one hand, the volatility targetingcan be applied to align return profiles of different strategies and, on the other hand, thevolatility targeting along with dynamic forecasting of volatility can serve as risk-control. It istypical for trend-following programs to apply the volatility targeting both as a scaler and riskcontrol of portfolio positions.2. Skewness of realized returns. The skewness serves as a static measure of the third orderrisk-profile of investment strategies. Strategies with the negative skewness typically includecarry and mean-reversion strategies, in which frequent small gains are followed byinfrequent large losses. Strategies with positive skewness tend to include trend-following andlong volatility strategies, in which case strategies tend to produce infrequent large gainsfollowed by a series of frequent small losses.3. Convexity of realized returns with respect to the flagship index or benchmark. I define theconvexity as the beta coefficient of strategy returns to the square of returns on thebenchmark. In this way, the convexity measures the dynamic risk of strategy performance intails of the performance of the flagship index. On one hand, the strategies with negativeconvexity underperform considerably the index in stressed periods with large negativeperformance on the index and yet they tend to underperform the benchmark when it4
produces large positive gains. On the other hand, the strategies with positive convexity tendto outperform the benchmark in both negative and positive periods with strong emphasis ondelivering positive performance in stressed periods.The quantitative way to analyze the convexity profile of a quantitative investment strategy is toestimate the quadratic (parabolic) regression of returns on the strategy predicted by returns on theflagship or benchmark index and index returns 𝑆𝑆𝑆𝑆𝑆𝑆𝑆 𝐴𝐴𝐴𝐴𝐴𝐴ℎ𝑎𝑎 ��𝐿𝐿𝐿𝐿𝐿𝐿𝐿 ��𝐼𝐼𝐼𝐼𝐼𝐼𝐼𝑛𝑛𝑠𝑠 𝐶 ��𝐼𝐼𝐼𝐼𝐼𝐼𝐼𝐼𝐼𝐼𝐼 2The estimate of the linear beta indicates the direct first-order exposure to the performance of thebenchmark index. Market-neutral strategies have insignificant linear betas.The estimate of the convexity beta assesses the second-order exposure indicating how the strategyperforms in markets with strong bias to either downside or to upside. The convex strategies benefitfrom extreme returns on the benchmark index while the concave strategies suffer in extrememarkets.The alpha is the estimate of the excess return that the strategy can generate. I caution that typicallythe explanatory power of this regression may not be strong because of limited sample size and noise.However, the estimate of the convexity beta helps to understand the behavior of strategies in tailevents.The skewness and convexity profiles of major quant strategies are illustrated below in Figures 1 and2, respectively. One of drawbacks of the skewness and convexity statistics is that both measuresdepend on the measurement frequency of realized returns. It is typical that the skewness andconvexity profiles are different for daily and monthly returns on quantitative strategies for the trendfollowing strategies. I will investigate this topic further.Illustrations using hedge fund indicesTo illustrate the risk profile of different quantitative strategies, I apply hedge fund indices that showthe aggregated performance of niche quant hedge funds (HF):1. Short Vol HF index is CBOE Eurekahedge Short Volatility Index measuring the equal-weightedperformance of 13 hedge funds which have short exposures to the implied volatility.2. Relative Value Vol HF index is Relative Value Volatility Hedge Fund Index of 35 hedge fundsthat run volatility strategies with long, short, or neutral exposure using the relative valueapproach.3. Long Vol HF index is Long Volatility Index of 11 hedge funds that have net long exposures tothe implied volatility.4. Tail Risk HF index is Tail Risk Hedge Fund Index including 8 hedge funds that seek to generatesignificant upside during market stress periods.5. SG Trend-following CTAs is SG Trend Index (NEIXCTAT Index) consisting of 10 systematictrend-following commodity trading advisors (CTAs).5
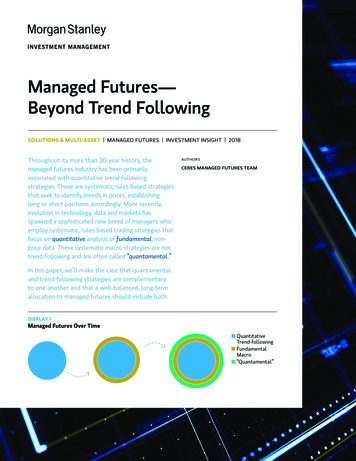
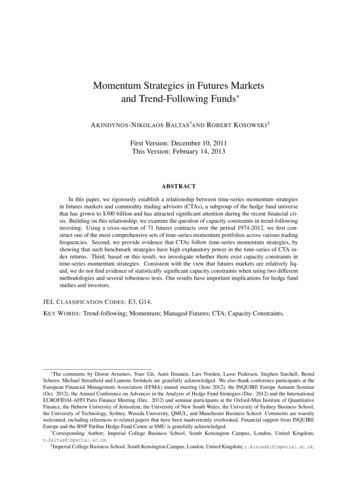
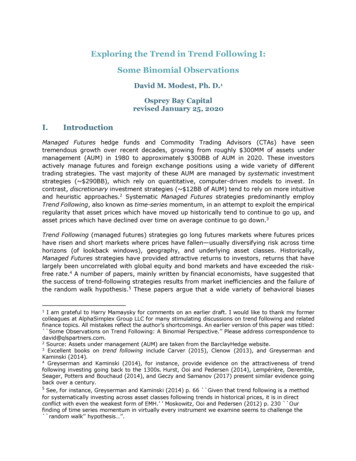
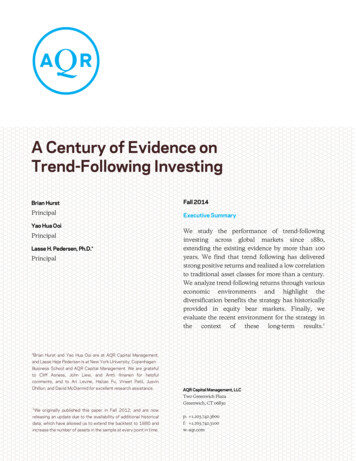
Both the CBOE HF and SG CTA indices are equal-weighted and reconstituted annually accounting forthe survivorship bias. CBOE HF indices are updated on monthly basis while the SG trend-followingCTAs index is updated daily. The time series of monthly returns for the first three Eurekahedge HFindices are available from January 2005, the data for Tail Risk HF index and SG Trend-following CTAsare available from January 2008 and January 2000, respectively.In the figure below, I show the realized skewness on the HF strategies. The short vol strategies arethe most negatively skewed, which is a typical feature of this strategies. The positive performanceover the stressed periods on short volatility strategies is seen as a compensation to bear theskewness risk of these strategies. I presented some ideas for filtering and hedging of short volstrategies to improve their risk-adjusted performance.The relative value vol funds have insignificant skewness by combining short and long exposures toimplied volatility, while the long volatility funds can generate positive skewness by maintaining thenet long exposure to the implied volatility. The tail risk hedge funds have a strong positive skewnesswhich come however at the expense of extended periods of losses during normal markets.The trend-following CTAs do not appear to generate significant skewness for monthly returns,however the skewness of quarterly returns becomes significant. I also point out because we have alimited number of monthly returns – about 200 observations – the sample volatility of the skewnessestimate is relatively high of about 0.17.5.0Skewness of monthly returns on Quant Hedge Fund strategies .0-2.5S&P500 TR index Short Vol HFsRelative ValueVol HFsLong Vol HFsTail Risk HFsSG Trendfollowing CTAsIn the figure below, I show the realized convexity with respect to the S&P 500 index using monthlyreturns. The overall explanatory power of the regression is not strong, only about 10%, However, itprovides the indication on the tail risk of quant strategies.Short volatility HFs generate strong negative convexity losing during stress periods. Relative valueand long vol HFs have an insignificant convexity profile. It is instructive that for long Vol HFs, thepositive skewness does not produce positive convexity: while the long vol HFs are expected to6
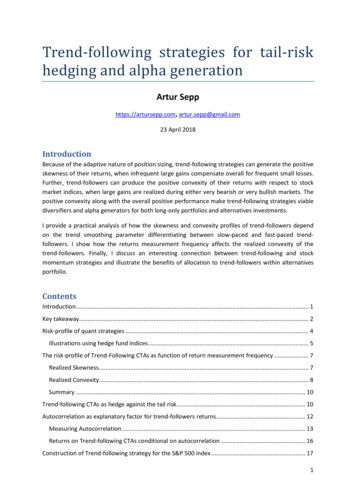
produce infrequent large gains, the arrival of these gains is not expected to occur in the tail. Incontrast tail risk HFs do produce both positive skewness and convexity, however at a cost of negativeoverall performance which can be seen from their negative alpha. Trend-following CTAs producesignificant positive convexity even though they have insignificant positive skewness.Monthly Returns on Quant Hedge Fund strategies vs S&P500 Index '05-18Short Vol HFs Short Convexityy -2.02x2 0.28x 0.01Relative Value Vol HFs Zero Convexityy 0.07x2 0.05x 0.01Long Vol HFs Zero Convexityy -0.02x2 - 0.13x 0.0125%Tail Risk HFs Long Convexityy 1.17x2 - 0.34x - 0.0020%SG Trend-following CTAs Long Convexity y 1.03x2 - 0.10x 0.0010%5%0%-5%-10%-15%-20%Y Monthly return of HF strategies15%-25%-30%X Monthly Return on S&P500 Index-20%-10%0%10%20%30%The risk-profile of Trend-Following CTAs as function of returnmeasurement frequencyThe return measurement frequency is defined by the non-overlapping periods for computing realizedreturns on the strategy. Common examples include daily, weekly, monthly, quarterly, and annualperiods. The return measurement frequency has a strong impact on the realized risk-profile of atrend-following strategy. The reason is that the trend-following strategy need to adapt to changingmarket condition with the speed of changes proportional to the length of observation window forthe signal generation. Fast-paced CTAs apply narrow window of recent return to determine thedirection of the trend while slow-paced CTAs use longer windows. As a result, the sign of theexposure and the realized performance can be different for both slow- and fast-paced CTAs, inparticular, when the measurement frequency is slow.I start with the analysis of the skewness and convexity of realized returns on trend-followingstrategies using SG Trend-following CTAs index with time series data from January 2000 to March2018. I will analyze the impact of window for signal generation later. I apply the S&P 500 index as thebenchmark.Realized SkewnessIn the figure below, I show the skewness measured at different frequencies. The skewness of returnson the S&P 500 index is almost zero for daily returns while it becomes negative with magnitude of7
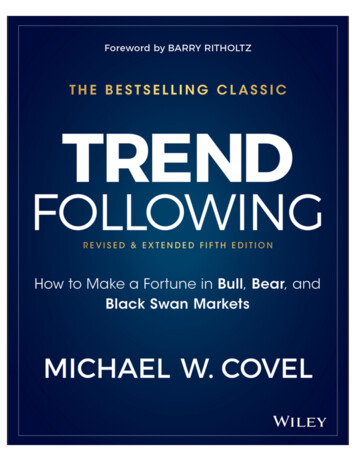
about -0.5 for returns sampled at lower frequencies. At the same time the skewness of Trendfollowing CTAs is negative for daily and weekly returns, slightly positive for monthly returns andstrengthens further for quarterly and annual returns.The indication is that the trend-following CTAs are more likely to have bigger gains than losses whentheir returns are sampled at slower frequencies. As a result, because of the dynamic nature of CTAs,the positive skewness manifests at slower frequencies.Realized Skeweness of Returns from 2000 to 2018S&P500 index1.50SG Trend-Following ns measurement frequencyRealized Convexity1. For daily and weekly frequencies of return measurement, we observe a negative convexity ontrend-following CTAs. We also observe a similar pattern of negative convexity for weeklyfrequency of returns measurement. Trend-following CTAs should not be sought for short-termprotection.8
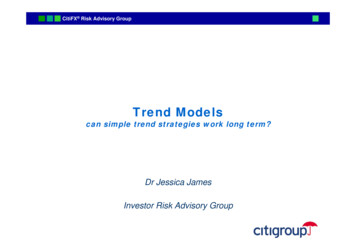
Daily returns on SG Trend-Following CTAs vs S&P 500 index% Return on SG Trend-Following CTA10%y -0.39x2 - 0.05x 0.00R² 0.010%-10%-20%-10%0%% Return on S&P 500 index10%20%2. For monthly and quarterly frequencies of return measurement, we observe that the convexityof trend-following CTAs becomes positive and strong. Similarly, for quarterly frequency, weobserve that the magnitude of the trend-following CTAs becomes smaller than for monthlyreturns, but the explanatory power of the regression increases.% Return on SG Trend-Following CTAMonthly returns on SG Trend-Following CTAs vs S&P 500 index20%y 1.03x2 - 0.10x 0.00R² 0.0210%0%-10%-20%-20%-10%0%% Return on S&P 500 index10%20%3. For annual frequency of return measurement, we observe that the magnitude of the TF CTAsincreases, and the explanatory power of the regression strengthens.9
% Return on SG Trend-Following CTAAnnual returns on SG Trend-Following CTAs vs S&P 500 index30%y 0.92x2 - 0.23x 0.04R² 0.3020%10%0%-10%-40%-30%-20%-10%0%10%% Return on S&P 500 index20%30%40%SummaryIn the figure below, I illustrate the linear beta and the convexity beta for the trend-following CTAs asfunctions of return measurement frequency.Betas of SG Trend-following CTAs to S&P500 index: 2000-2018Linear Beta1.2Convexity ualReturns measurement frequencyTrend-following CTAs as hedge against the tail riskNow I analyze conditional quarterly returns on trend-followers using SG Trend-following CTAs indexfrom January 2000 to March 2018. To compute the conditional return, I divide quarterly returns onthe S&P 500 total return index into the four buckets corresponding to four quantiles measured with25% intervals:10
1. 0-25%Q includes quarterly returns between -35% to -1% and represents the stressed market.2. 25-50%Q includes quarterly returns between -1% to 2% and represents the range-boundmarkets.3. 50-75%Q includes quarterly returns between 2% to 6% and represents the normal uptrending market.4. 75-100%Q includes quarterly returns between 6% to 35% and represents a strong bullishmarket.In the figure below, I plot the conditional quarterly returns. We see that the trend-following CTAsdeliver strong conditional performance when markets are either in the stress or in the bullish regime.The worst period of performance is the range-bound market. Trend-followers also produce negativeperformance in the period with normal up-trending market.Quarterly Returns on SG Trend-following CTAs conditional on quantiles ofreturns on S&P 500 index: -1.0%-2.0%-1.8%-3.0%All: 35% SP500 35%0-25%Q: 35% S&P500 -1%25-50%Q: 1% S&P500 2%50-75%Q:2% S&P500 6%75-100%Q:6% S&P500 35%In the next figure I analyze the conditional performance of the trend-following CTAs by the riskreward frontier with the reward measured by the average of conditional quarterly returns and riskmeasured by the skewness of conditional quarterly returns. We see that overall the skewness ontrend-following CTAs does not depend on market regimes for all but the bullish period. In the bullishperiod, while the trend-following CTAs still deliver the performance, the skewness of returns in thisperiod is almost zero. As a result, the trend-following CTAs can experience both large gains and largelosses in bullish markets.11
5%Average Quarterly Return4%Average quarterly return versus skeweness on SG Trend-following CTAsconditional on quantiles of returns on the S&P 500 index: 2000-20180-25%Q: 35% S&P500 -1%75-100%Q:6% S&P500 35%3%2%All: -35% SP500 35%1%0%50-75%Q:2% S&P500 6%-1%25-50%Q: 1% S&P500 2%-2%-3%0.000.200.400.600.801.00Skeweness of Quarterly Returns1.201.401.60Autocorrelation as explanatory factor for trend-followers returnsPreviously I showed the evidence that the trend-followers outperform when the S&P 500 index iseither in a bear market or in a strong bull market. Now I turn my analysis into understanding theperformance of trend-followers conditional on the autocorrelation of the S&P 500 returns. Thenature of trend-followers is to benefit from markets where prices and returns are auto-correlatedimplying the persistence of trends.The visual inspection of the past performance of the SG trend-following CTAs index indicates the tworegimes:1. Outperformance period from January 2000 to June 2011 with the realized Sharpe ratio of0.49 vs Sharpe of 0.05 on the S&P 500 total return (TR) index.2. Flat performance period from June 2011 to March 2018 with the realized Sharpe ratio of 0.06vs Sharpe of 1.13 on the S&P 500 TR index.One variable that has changed the sign in a significant way during these two periods is the lag-1autocorrelation between quarterly returns on the S&P 500 index (the same conclusions are reachedwhen using monthly returns):1. During the outperformance period, the lag-1 autocorrelation is positive and insignificant.2. During the flat performance period, the lag-1 autocorrelation is negative and significant.In the table below, I summarize the realized quantities using quarterly returns.PeriodStartEndAll SampleJan-2000OutperformanceJan-2000Flat performance Jun-2011SharpeLag-1 autocorrelation of quarterly returnsTrend-followersS&P 500 TR index S&P 500 TR index95% Significance BoundsMar-20180.350.350.06 0.23Jun-20110.490.060.13 0.29Mar-20180.061.13-0.43 0.3712
In Figure below I visualize the Sharpe ratios in the three samples as function of the lag-1autocorrelation.Realized Sharpe of SG CTAs vs Lag-1 autocorrelation of quarterlyreturns on the S&P500 in out/underpeformance periods0.60OutperformanceSample, 20002010, Sharpe 0.49CTAs Sharpe Ratio0.500.40All Sample, 20002018, Sharpe 0.360.300.20 Flat PerformanceSample 2011-2018,Sharpe 0.060.100.00-0.5-0.2500.25Lag-1 autocorrelation of quarterly returns on the S&P 5000.5Measuring AutocorrelationThe traditional measure of the autocorrelation using lagged return is noisy for a short period ofobservations, say one month or one quarter.An alternative way to measure the autocorrelation is to investigate the realized volatility of returnssampled at different frequencies:1. When the autocorrelation is negative, returns revert to the mean over lower frequencies andthe volatility of returns measured at lower frequencies, say, monthly or quarterly, will belower than the volatility of returns measured at higher frequencies, say, daily.2. When the autocorrelation is positive, returns tend to grow over lower frequencies and thevolatility of returns at low frequency tend to increase than the volatility of returns at lowfrequency.3. When the autocorrelation is zero, returns sampled at low and high frequencies tend to havethe same volatility.I introduce the following ratio of the volatility of returns measured at low frequency (weekly,monthly, etc) and the volatility of daily 𝐴𝐴𝐴𝐴𝐴𝐴𝐴 𝑉𝑉𝑉𝑉𝑉𝑉 𝑅𝑅𝑅𝑅𝑅𝑅𝑅𝑅𝑅𝑅 ��𝑖𝑖𝑖𝑖𝑖𝑖𝑖 𝑜𝑜𝑜𝑜 ��𝑅 𝐴𝐴𝐴𝐴 𝐿𝐿𝐿𝐿𝐿𝐿 ��𝐹𝐹𝐹𝐹𝐹 ���𝑉𝑉𝑉𝑉𝑉𝑉𝑉 𝑜𝑜𝑜𝑜 ��𝑅 𝐴𝐴𝐴𝐴 𝐷𝐷𝐷𝐷𝐷𝐷𝐷𝐷𝐷𝐷 ��𝐹𝐹𝐹𝐹𝐹The figure below illustrate the how the autocorrelation affects the autocorrelation vol ratio using atheoretical quantitative model. In the presence of strong positive autocorrelation, the volatility ofquarterly returns (about 60 days in returns measurement), the ratio is expected to be around two13
indicating that quarterly returns are three time more volatile than daily returns. In opposit
Construction of Trend-following strategy for the S&P 500 index. 6. Using the trend system parametrized by the half-life of the trend smoothing, I analyze at which frequency of returns measurement the trend-following strategy can generate the positive convexity. The key is that the trend-