Transcription
Excel Power PivotAbout the TutorialExcel Power Pivot is an efficient, powerful tool that comes with Excel as an Add-in. WithPower Pivot, you can load hundreds of millions of rows of data from external sources andmanage the data effectively with its powerful xVelocity engine in a highly compressedform. This makes it possible to perform the calculations, analyze the data, and arrive at areport to draw conclusions and decisions.AudienceThis guide targets professionals with hands-on experience with Excel, to perform the highend data analysis and decision making in a matter of few minutes.PrerequisitesBefore you proceed with this tutorial, we are assuming that you are already aware aboutthe basics of Excel. If you are not well aware of these concepts, then we will suggest youto go through our short tutorials on Excel charts and MS Access.Copyright & Disclaimer Copyright 2016 by Tutorials Point (I) Pvt. Ltd.All the content and graphics published in this e-book are the property of Tutorials Point (I)Pvt. Ltd. The user of this e-book is prohibited to reuse, retain, copy, distribute, orrepublish any contents or a part of contents of this e-book in any manner without writtenconsent of the publisher.We strive to update the contents of our website and tutorials as timely and as precisely aspossible, however, the contents may contain inaccuracies or errors. Tutorials Point (I) Pvt.Ltd. provides no guarantee regarding the accuracy, timeliness or completeness of ourwebsite or its contents including this tutorial. If you discover any errors on our website orin this tutorial, please notify us at contact@tutorialspoint.comi
Excel Power PivotTable of ContentsAbout the Tutorial . iAudience . iPrerequisites . iCopyright & Disclaimer . iTable of Contents . ii1.Power Pivot – Overview . 12.Power Pivot – Installing . 3Power Pivot on the Ribbon . 3Power Pivot Add-in . 3What is Power Pivot? . 4Why is Power Pivot a Strong Tool? . 5Power Features to Excel with Power Pivot . 5Uses of Power Pivot . 6Data Modelling with Power Pivot . 6Business Intelligence with Power Pivot . 63.Power Pivot – Features . 7Loading Data from External Sources . 7Excel Window and Power Pivot Window . 7Data Model . 7Memory Optimization . 8Compact File Size . 8Power PivotTables . 8Power PivotCharts . 8DAX Language . 84.Power Pivot – Loading Data . 9Data Sources Supported by Power Pivot . 9Loading Data Directly into PowerPivot . 10Table Import Wizard . 15Opening Existing Connections . 19Creating Linked Tables. 21Loading from Excel Files . 23Loading from Text Files. 23Loading from the Clipboard . 26Refreshing Data in Power Pivot . 315.Power Pivot – Data Model (Database) . 33Excel and Data Model . 33Power Pivot and Data Model . 33Creating a Data Model . 34Tables in Data Model . 34Excel Tables and Data Tables . 34Data View of Data Model . 35Diagram View of Data Model . 35Relationships in Data Model . 36ii
Excel Power Pivot6.Power Pivot – Managing Data Model . 37Adding Excel Tables to Data Model with PivotTable . 37Adding Excel Tables from a Different Workbook to Data Model . 42Adding Excel Tables to Data Model from the PowerPivot Ribbon . 45Creating Relationships from Data View . 49Creating Relationships from Diagram View . 50Managing Relationships . 53Refreshing Power Pivot Data . 547.Power PivotTable – Creation . 55Creating a Power PivotTable . 55Power PivotTable Fields . 578.Power Pivot – Basics of DAX. 62Calculated Column . 62Extending the Data Model using Calculated Columns . 62Calculated Field . 719.Power PivotTable – Exploring Data . 75Loading Data from Access Database . 75Creating a PivotTable from the Data Model . 80Exploring Data with PivotTable . 82Summarizing Data from Different Sources in Power Pivot . 84Extending Data Exploration . 87Extending the Data Model using Calculated Columns . 88Creating a Relationship Using Calculated Columns . 9010. Power PivotTables – Flattened. 93Creating a PivotTable. 93Creating a Flattened PivotTable . 95Exploring Data in Flattened PivotTable . 9611. Power PivotCharts – Creation . 100Creating a PivotChart. 100PivotChart Fields List . 105Filters in PivotChart . 106Slicers in PivotChart . 108PivotChart Tools . 11012. Table and Chart Combinations . 111Chart and Table (Horizontal) . 112Chart and Table (Vertical) . 11513. Power Pivot – Hierarchies . 118Creating a Hierarchy . 118Renaming a Hierarchy . 119Creating a PivotTable with a Hierarchy in Data Model. 120Creating a Hierarchy based on Multiple Tables . 125Removing a Child Level from a Hierarchy . 126Adding a Child Level to a Hierarchy . 127Changing the Order of a Child Level in a Hierarchy . 128PivotTable with Changes in Hierarchy . 129Hiding and Showing Hierarchies . 130iii
Excel Power PivotCreating a Hierarchy in Other Ways . 131Deleting a Hierarchy . 134Calculations Using Hierarchy . 135Drilling Up and Drilling Down a Hierarchy . 13714. Power Pivot – Aesthetic Reports . 139Reports based on Power PivotChart . 139Report Layout . 143Using a Common Slicer . 147Selecting Objects for Display in the Report . 152iv
1. Power Pivot – OverviewExcel Power PivotExcel Power Pivot is an efficient, powerful tool that comes with Excel as an Add-in. With PowerPivot, you can load hundreds of millions of rows of data from external sources and managethe data effectively with its powerful xVelocity engine in a highly compressed form. This makesit possible to perform the calculations, analyze the data, and arrive at a report to drawconclusions and decisions. Thus, it would be possible for a person with hands-on experiencewith Excel, to perform the high-end data analysis and decision making in a matter of fewminutes.This tutorial will cover the following-Power Pivot FeaturesWhat makes Power Pivot a strong tool is the set of its features. You will learn the variousPower Pivot features in the chapter – Power Pivot Features.Power Pivot Data from Various SourcesPower Pivot can collate data from various data sources to perform the required calculations.You will learn how to get data into Power Pivot, in the chapter – Loading Data into PowerPivot.Power Pivot Data ModelThe power of Power Pivot lies in its database- Data Model. The data is stored in the form ofdata tables in the Data Model. You can create relationships between the data tables tocombine the data from different data tables for analysis and reporting. The chapter –Understanding Data Model (Power Pivot Database) gives you the details about the Data Model.Managing Data Model and RelationshipsYou need to know how you can manage the data tables in the Data Model and the relationshipsbetween them. You will get the details of these in the chapter - Managing Power Pivot DataModel.Creating Power Pivot Tables and Power Pivot ChartsPower PivotTables and Power Pivot Charts provide you a way to analyze the data for arrivingat conclusions and/or decisions.You will learn how to create Power PivotTables in the chapters – Creating a Power PivotTableand Flattened PivotTables.You will learn how to create Power PivotCharts in the chapter – Power PivotCharts.5
Excel Power PivotDAX BasicsDAX is the language used in Power Pivot to perform calculations. The formulas in DAX aresimilar to Excel formulas, with one difference – while the Excel formulas are based onindividual cells, DAX formulas are based on columns (fields).You will understand the basics of DAX in the chapter – Basics of DAX.Exploring and Reporting Power Pivot DataYou can explore the Power Pivot Data that is in the Data Model with Power PivotTables andPower Pivot Charts. You will get to learn how you can explore and report data throughout thistutorial.HierarchiesYou can define data hierarchies in a data table so that it would be easy to handle related datafields together in Power PivotTables. You will learn the details of the creation and usage ofHierarchies in the chapter – Hierarchies in Power Pivot.Aesthetic ReportsYou can create aesthetic reports of your data analysis with Power Pivot Charts and/or PowerPivot Charts. You have several formatting options available to highlight the significant data inthe reports. The reports are interactive in nature, enabling the person looking at the compactreport to view any of the required details quickly and easily.You will learn these details in the chapter - Aesthetic Reports with Power Pivot Data.6
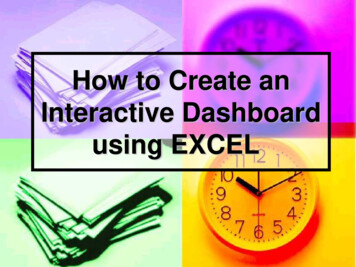
2. Power Pivot – InstallingExcel Power PivotPower Pivot in Excel provides a Data Model connecting various different data sources basedon which the data can be analyzed, visualized, and explored. The easy-to-use interfaceprovided by Power Pivot enables a person with hands-on experience in Excel to effortlesslyload data, manage the data as data tables, create relationships among the data tables, andperform the required calculations to arrive at a report.In this chapter, you will learn, what makes Power Pivot a strong and sought after tool foranalysts and decision makers.Power Pivot on the RibbonThe first step to proceed with Power Pivot is to ensure that the POWERPIVOT tab is availableon the Ribbon. If you have Excel 2013 or later versions, the POWERPIVOT tab appears on theRibbon.If you have Excel 2010, POWERPIVOT tab might not appear on the Ribbon if you have notalready enabled the Power Pivot add-in.Power Pivot Add-inPower Pivot Add-in is a COM Add-in that needs to be enabled to get the complete features ofPower Pivot in Excel. Even when POWERPIVOT tab appears on the ribbon, you need to ensurethat the add-in is enabled to access all the features of Power Pivot.Step 1: Click the FILE tab on the Ribbon.Step 2: Click Options in the dropdown list. The Excel Options dialog box appears.7
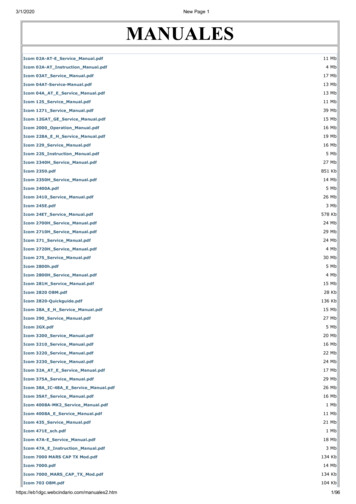
Excel Power PivotStep 3: Follow the instructions as follows Click Add-Ins. In the Manage box, select COM Add-ins from the dropdown list. Click the Go button. The COM Add-Ins dialog box appears. Check Power Pivot and click OK.What is Power Pivot?Excel Power Pivot is a tool for integrating and manipulating large volumes of data. With PowerPivot, you can easily load, sort and filter data sets that contain millions of rows and performthe required calculations. You can utilize Power Pivot as an ad hoc reporting and analyticssolution.The Power Pivot Ribbon as shown below has various commands, ranging from managing DataModel to creating reports.8
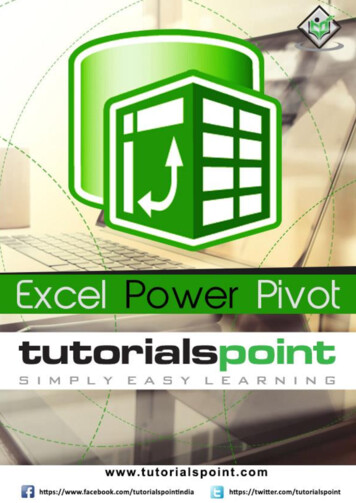
Excel Power PivotThe Power Pivot window will have the Ribbon as shown below-Why is Power Pivot a Strong Tool?When you invoke Power Pivot, Power Pivot creates data definitions and connections that getstored with your Excel file in a compressed form. When the data at the source is updated, itis refreshed automatically in your Excel file. This facilitates the usage of the data maintainedelsewhere but is required for study time-to-time study and arriving at decisions. The sourcedata can be in any form – ranging from a text file or a web page to the different relationaldatabases.The user-friendly interface of Power Pivot in the PowerPivot window enables you to performdata operations without the knowledge of any database query language. You can then createa report of your analysis within few seconds. The reports are versatile, dynamic andinteractive and enable you to further probe into the data to get the insights and arrive at theconclusions / decisions.The data that you work on in Excel and in the Power Pivot window is stored in an analyticaldatabase inside the Excel workbook, and a powerful local engine loads, queries, and updatesthe data in that database. Since the data is in Excel, it is immediately available to PivotTables,PivotCharts, Power View, and other features in Excel that you use to aggregate and interactwith the data. The data presentation and interactivity is provided by Excel and the data andExcel presentation objects are contained within the same workbook file. Power Pivot supportsfiles up to 2GB in size and enables you to work with up to 4GB of data in memory.9
Excel Power PivotPower Features to Excel with Power PivotPower Pivot features are free with Excel. Power Pivot has enhanced the Excel performancewith power features that include the following Ability to handle large data volumes, compressed into small files, with amazing speed.Filter data and rename columns and tables while importing.Organize tables into individual tabbed pages in the Power Pivot window as against theExcel tables distributed all over the workbook or multiple tables in the same worksheet.Create relationships among the tables, so as to analyze the data in the tablescollectively. Before Power Pivot, one had to rely on heavy usage of VLOOKUP functionto combine the data into a single table before such analysis. This used to be laboriousand error-prone.Add power to the simple PivotTable with many added features.Provide Data Analysis Expressions (DAX) language to write advanced formulas.Add calculated fields and calculated columns to the data tables.Create KPIs to use in PivotTables and Power View reports.You will understand the Power Pivot features in detail in the next chapter.Uses of Power PivotYou can use Power Pivot for the following – To perform powerful data analysis and create sophisticated Data Models. To mash-up large volumes of data from several different sources quickly. To perform information analysis and share the insights interactively. To write advanced formulas with the Data Analysis Expressions (DAX) language. To create Key Performance Indicators (KPIs).Data Modelling with Power PivotPower Pivot provides advanced data modeling features in Excel. The data in the Power Pivotis managed in the Data Model that is also referenced as Power Pivot database. You can usePower Pivot to help you gain new insights into your data.You can create relationships between data tables so that you can perform data analysis onthe tables collectively. With DAX, you can write advanced formulas. You can create calculatedfields and calculated columns in the data tables in the Data Model.10
Excel Power PivotYou can define Hierarchies in the data to use everywhere in the workbook, including PowerView. You can create KPIs to use in PivotTables and Power View reports to show at a glancewhether performance is on or off target for one or more metrics.Business Intelligence with Power PivotBusiness intelligence (BI) is essentially the set of tools and processes that people use togather data, turn it into meaningful information, and then make better decisions. The BIcapabilities of Power Pivot in Excel enable you to gather data, visualize data, and shareinformation with people in your organization across multiple devices.You can share your workbook to a SharePoint environment that has Excel Services enabled.On the SharePoint server, Excel Services processes and renders the data in a browser windowwhere others can analyze the data.11
3. Power Pivot – FeaturesExcel Power PivotThe most important and powerful feature of Power Pivot is its database – Data Model. Thenext significant feature is the xVelocity in-memory analytics engine that makes it possible towork on large multiple databases in a matter of few minutes. There are some more importantfeatures that come with the PowerPivot Add-in.In this chapter, you will get a brief overview of the features of Power Pivot, which areillustrated in detail later.Loading Data from External SourcesYou can load data into Data Model from external sources in two ways – Load data into Excel and then create a Power Pivot Data Model.Load data directly into Power Pivot Data Model.The second way is more efficient because of the efficient way Power Pivot handles the data inmemory.For more details, refer to chapter – Loading Data into Power Pivot.Excel Window and Power Pivot WindowWhen you start working with Power Pivot, two windows will open simultaneously – Excelwindow and Power Pivot window. It is through PowerPivot window that you can load data intoData Model directly, view the data in Data View and Diagram View, Create relationshipsbetween tables, manage the relationships, and create the Power PivotTable and/or PowerPivotChart reports.You need not have the data in Excel tables when you are importing data from external sources.If you have data as Excel tables in the workbook, you can add them to Data Model, creatingdata tables in Data Model that are linked to the Excel tables.When you create a PivotTable or PivotChart from Power Pivot window, they are created in theExcel window. However, the data is still managed from Data Model.You can always switch between the Excel window and Power Pivot window anytime, easily.Data ModelThe Data Model is the most powerful feature of Power Pivot. The data that is obtained fromvarious data sources is maintained in Data Model as data tables. You can create relationships12
Excel Power Pivotbetween the data tables so that you can combine the data in the tables for analysis andreporting.You will learn in detail about the Data Model in the chapter – Understanding Data Model(Power Pivot Database).Memory OptimizationPower Pivot Data Model uses xVelocity storage, which is highly compressed when data isloaded into memory that makes it possible to store hundreds of millions of rows in memory.Thus, if you load data directly into Data Model, you will be doing it in the efficient highlycompressed form.Compact File SizeIf the data is loaded directly into Data Model, when you save the Excel file, it occupies veryless space on the hard disk. You can compare the Excel file sizes, the first one with loadingdata into Excel and then creating the Data Model and the second with loading data directlyinto the Data Model skipping the first step. The second one will be up to 10 times smaller thanthe first one.Power PivotTablesYou can create the Power PivotTables from Power Pivot window. The PivotTables so createdare based on the data tables in the Data Model, making it possible to combine data from therelated tables for analysis and reporting.Power PivotChartsYou can create the Power PivotCharts from Power Pivot window. The PivotCharts so createdare based on the data tables in the Data Model, making it possible to combine data from therelated tables for analysis and reporting. The Power PivotCharts have all the features of ExcelPivotCharts and many more such as field buttons.You can also have combinations of Power PivotTable and Power PivotChart.DAX LanguageThe strength of Power Pivot comes from the DAX Language that can be used effectively onthe Data Model to perform calculations on the data in the data tables. You can have CalculatedColumns and Calcu
If you have Excel 2013 or later versions, the POWERPIVOT tab appears on the Ribbon. If you have Excel 2010, POWERPIVOT tab might not appear on the Ribbon if you have not already enabled the Power Pivot add-in. Power Pivot Add-in Power Pivot Add-in is a COM Add-in that needs to be enabled to get the co