Transcription
University of IowaIowa Research OnlineDriving Assessment ConferenceJun 25th, 12:00 AMA Survey Study Measuring People's Preferences TowardsAutomated and Non-Automated RidesplittingFangda ZhangUniversity of Massachusetts AmherstShannon RobertsUniversity of Massachusetts AmherstClaudia GoldmanGeneral Motors Advanced Technical Center IsraelFollow this and additional works at: https://ir.uiowa.edu/drivingassessmentZhang, Fangda; Roberts, Shannon; and Goldman, Claudia. A Survey Study Measuring People's PreferencesTowards Automated and Non-Automated Ridesplitting. In: Proceedings of the Tenth International DrivingSymposium on Human Factors in Driver Assessment, Training and Vehicle Design, 24-27 June 2019,Santa Fe, New Mexico. Iowa City, IA: Public Policy Center, of Iowa, 2019: 92-98.This Event is brought to you for free and open access by the Public Policy Center at Iowa Research Online. It hasbeen accepted for inclusion in Driving Assessment Conference by an authorized administrator of Iowa ResearchOnline. For more information, please contact lib-ir@uiowa.edu.
PROCEEDINGS of the Tenth International Driving Symposium on Human Factors in Driver Assessment,Training and Vehicle DesignA SURVEY STUDY MEASURING PEOPLE’S PREFERENCES TOWARDS AUTOMATEDAND NON-AUTOMATED RIDESPLITTINGFangda Zhang1, Shannon Roberts1, Claudia Goldman21University of Massachusetts AmherstAmherst, MA, USA2General Motors Advanced Technical Center IsraelHerzliya Pituach, IsraelEmail: fzhang@umass.eduSummary: Ridesplitting is both common and important as it facilitates dailytransportation needs. Alongside an increase in ridesplitting is the introduction ofautomated driving systems, which together, bring out the possibility of automatedridesplitting. However, previous studies have identified resistance in the acceptanceof automated driving systems. In light of past research on automated drivingsystems, we used a survey to compare people’s preferences of automatedridesplitting to non-automated ridesplitting. Statistical and text mining techniqueswere leveraged to analyze the results. We found similarities in the numericresponses of important factors concerning automated and non-automatedridesplitting whereas there were large differences between automated and nonautomated ridesplitting in the text responses. Additionally, people prioritized costand time in both automated and non-automated ridesplitting. These results can beused in the design of future ridesplitting services, especially with respect toincreasing acceptance of and trust in automated ridesplitting services.INTRODUCTIONRidesplitting is a service where fares and rides are split among strangers who are traveling in thesame direction. This is differentiated from ridesharing, which is the formal or informal sharing ofrides between drivers and passengers with similar origin-destination pairings (e.g., carpooling).Dynamic real-time ridesplitting, wherein multiple passengers are matched with one vehicle for aone-time, one-way trip (Amey, Attanucci, & Mishalani, 2011) has increased in popularity asride-hailing companies like Uber and Lyft offer dynamic real-time ridesplitting to theircustomers (e.g., Uber Pool or Lyft Line).Given that ridesplitting services revolve around users, people’s attitudes towards them is ofinterest. Past research has identified which aspects encourage ridesplitting, including costs,personal preference (Thaithatkul, Seo, Kusakabe, & Asakura, 2015), wait time (Deakin, Frick, &Shively, 2010; Hanna, Albert, Chen, & Stone, 2016), safety, and security (Deakin et al., 2010;Thaithatkul et al., 2015). Other researchers (Morales Sarriera et al., 2017) reported that socialinteractions were important in ridesplitting, as well as riders’ prejudice with respect to age, socialclass, and race. Altogether, these studies have stressed the importance of people’s preferenceswhen choosing ridesplitting services.As time progresses, not only will there be more ridesplits, but ridesplits may take place inautomated driving systems. Past research has identified if people would accept the technology92
PROCEEDINGS of the Tenth International Driving Symposium on Human Factors in Driver Assessment,Training and Vehicle Designand how user characteristics impact their adoption of the technology (Bansal, Kockelman, &Singh, 2016; Krueger, Rashidi, & Rose, 2016). Although experts and the public are oftenpositive about automated driving systems, they also exhibit essential concerns (Kyriakidis,Happee, & de Winter, 2015). In addition, since automated ridesplitting is still a new concept, anduser acceptance is imperative for the successful implementation of this service (Pakusch &Bossauer, 2017), its acceptance by the public is of much importance. Moreover, Level 3 automated driving systems are a technological innovation that is not yet market-ready andtherefore has not yet been tested by users (Pakusch et al., 2017). This unquestionably increasesthe public’s uncertainty about automated ridesplitting, and therefore makes it difficult to have acomplete understanding of automation-related concepts, not to mention concrete opinions aboutthe technology. As such, this study was conducted to understand if there were differences inpreferences between automated ridesplitting (AR) and non-automated ridesplitting (non-AR).METHODSurvey Development and DescriptionAn online survey was developed with 66 questions and took approximately 20 minutes tocomplete. The survey was developed and administered using Qualtrics. Survey questionsconcerning people’s ridesplitting usage and perception of different transportation modes wereformulated based on previous studies (Abraham et al., 2016), (Ciari & Axhausen, 2013), (Dias etal., 2017), (Morales Sarriera et al., 2017), (Thaithatkul et al., 2015). Past research highlighted theimportance of time, cost, and gender in choosing a ridesplit (Hanna et al., 2016; Morales Sarrieraet al., 2017; Thaithatkul et al., 2015), hence additional survey questions were included tocompare these aspects. Since the main goal of this study was to identify differences in people’spreferences towards AR and non-AR, a set of important statements (factors) that might affectpeople’s preference were used (Ciari & Axhausen, 2013), and participants were asked to ratethem in both AR and non-AR settings. Demographic questions were also included in the survey,however, they are not analyzed here.ProcedureParticipants were recruited from Massachusetts and Connecticut by one of three means: postedflyers, email advertisements, and Facebook advertisements. Participants indicated their interestin the survey via email. A researcher screened them to ensure they were at least 18 years of age.After screening, participants were sent a link to an online consent form and the survey. Aftersurvey completion, they were compensated with a 10 Amazon gift card.ParticipantsA total of 117 participants responded to the survey. Most participants (75.2%) were between 1835 years old and were female (69.2%) versus male (27.4%). Most participants (77.78%) werefrom urban areas, 21.37% were from suburban areas and only 0.85% were from rural areas.More than half of participants were either employed full time (37.6%) or a student (40.2%).Forty one percent of participants did not have a car whereas 59% of participants did own a car.Most participants had a driver’s license (82.9%) and 79.5% thought they embraced a technology-93
PROCEEDINGS of the Tenth International Driving Symposium on Human Factors in Driver Assessment,Training and Vehicle Designdriven lifestyle. As for ridesplitting usage, 18.8% of the participants said they never used itbefore whereas 17.2% used ridesplitting at least 1 day per week. An additional 27.3% did not useridesplitting within the past 30 days and 36.7% used ridesplitting monthly.Data AnalysisNumeric and Multiple-choice Questions. For numeric and multiple-choice questions, we used theR statistical programming language to generate the results (e.g., percentage of response, averageratings, etc.). Chi-squared tests were used to investigate if participants’ preferences towardsridesplitting in the format of multiple-choice questions differed between AR and non-AR.Additionally, the dependent t-test (paired sample t-test) was employed to compare the differencein participants’ numeric responses to important factors that might influence their preferencestowards AR and non-AR. We used an alpha level of 0.05 for statistical tests.Open-ended Text Questions. We used text-mining to explore the open-ended text questions usingthe R statistical programming language. There were two open-ended questions: A) “Are thereany other factors that you think are important when it comes to ridesplitting? Does this factordiffer in non-automated versus automated contexts?”; B) “Would it make any difference if thecar were fully automated (no driver) when splitting a ride with multiple passengers?”. QuestionA was asked after a numeric question that required participants to rate the importance of 29statements regarding AR and non-AR (e.g., saving on expenses). Hence, the “other” referred toaspects that were not mentioned in the 29 statements. Question A was not required, and we onlyreceived 73 responses from 117 participants whereas Question B was required and we receivedresponses from all 117 participants.Similar to previous research (Ghazizadeh, Mcdonald, Lee, & Madison, 2014; Mehrotra &Roberts, 2018; Roberts & Lee, 2014), to begin data preprocessing, text answers were imported asa corpus data structure and punctuations and numbers were removed. Then, all text wasconverted to lowercase. Next, we defined and removed stop words, such as “a”, “the”, and“this”, which appear more frequently than other words yet do not provide useful information.The last step was to reduce the words to stems, which reduces variance in the data by convertingwords to their radical. After processing, we extracted the key words for each question toinvestigate words that appeared most frequently. The results were visualized by word clouds.As an exploratory measure, we also performed latent semantic analysis (LSA) to examine thetextual data. The underlying idea in this technique is that the aggregate of all the word contextsin which a given word does or does not appear provides a set of mutual constraints that largelydetermines the similarity of meaning of words and sets of words to each other (Landauer, Foltz,& Laham, 1998). In other words, it helps us analyze relationships among documents and terms.The key insight in LSA is to reduce the dimensionality of the information retrieval problem(Dumais, 2005). Singular-value decomposition (SVD) is often used as a data reduction methodand was leveraged in our study to reduce the dimension of the term-document matrix (where thedata were stored) and help extract desired relationships. Term similarities were obtained bycalculating the cosine value (Ghazizadeh et al., 2014) between terms in the reduced vector spaceobtained by SVD. We used heat maps to present the results.94
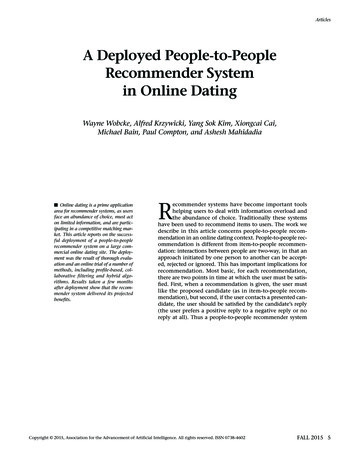
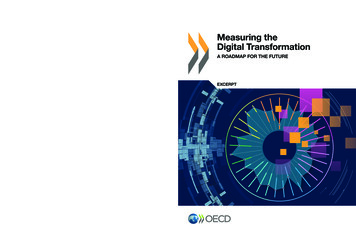
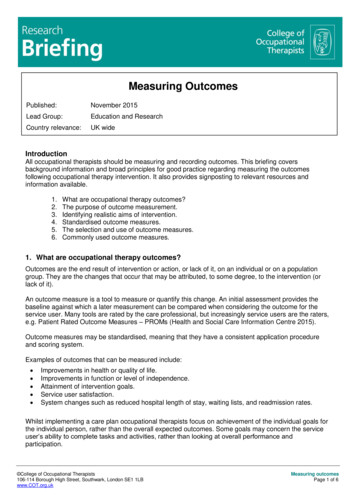
PROCEEDINGS of the Tenth International Driving Symposium on Human Factors in Driver Assessment,Training and Vehicle DesignRESULTSNumeric and Multiple-choice QuestionsMost participants (AR: 64.1%, non-AR: 74.4%) preferred to ride split with more passengers at alower cost over less passengers at a higher cost (AR: 22.2%, non-AR: 17.9%) and a smallproportion felt indifferent (AR: 13.7%, non-AR: 7.7%). The difference between AR and non-ARwas not significant ( 2(2, N 117) 2.9093, p 0.2335). More than half of participants (AR:59.0%, non-AR: 52.1%) preferred a shorter ridesplitting trip with dissimilar passengers than alonger ridesplitting trip with passengers who were similar to them (AR: 18%, non-AR: 21.4%).The remaining participants did not have a preference (AR: 23%, non-AR: 26.5%). No significantdifference was found ( 2(2, N 117) 0.9694, p 0.6159) between AR and non-AR. Themajority of participants (AR: 62.4%, non-AR: 68.4%) were more likely to wait a shorter amountof time for a ridesplit where the passengers were not similar to them, instead of waiting a longeramount of time for a ridesplit where the passengers were similar to them (AR: 14.6%, non-AR:11.9%), whereas some participants did not have a preference (AR: 23.0%, non-AR: 19.7%). Thedifference between AR and non-AR setting was not significant ( 2(2, N 117) 0.8054, p 0.6685). Last, a longer ridesplitting trip for less money was more preferred (AR: 58.1%, nonAR: 57.3%) than a shorter ridesplitting trip for more money (24.8% for both AR and non-AR). Asmall percentage of participants did not prefer either option (AR:17.1%, non-AR: 17.9%). Thedifference between AR and non-AR in people’s preferences was not significant ( 2(2, N 117) 0.0238, p 0.9982).Table 1. Average ratings and standard deviations of important factors for both non-automated andautomated ridesplitting with dependent t-test p valuesTable 1 refers to participants’ average ratings of important statements concerning both AR andnon-AR. Participants rated the statement “Safety risk with respect to the number of passengers”the highest and “Being paired with an unpleasant passenger(s)” as the second highest.“Preferences of gender of ride-mate” and “Having mobile phone number of rider/mate” seemedto be the least important statements. Dependent t-test was performed on each pair of thequestions and the resultant p-values are shown in Table 1. There was no significant differencebetween AR and non-AR in any statement.95
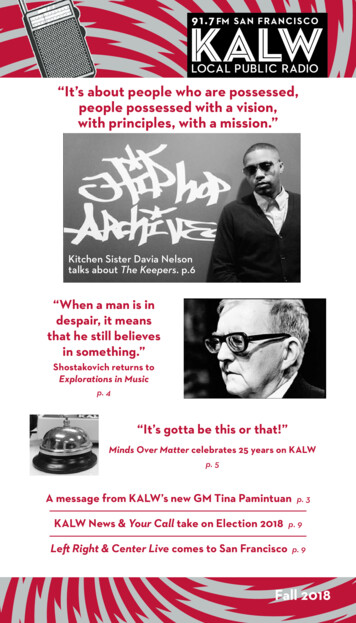
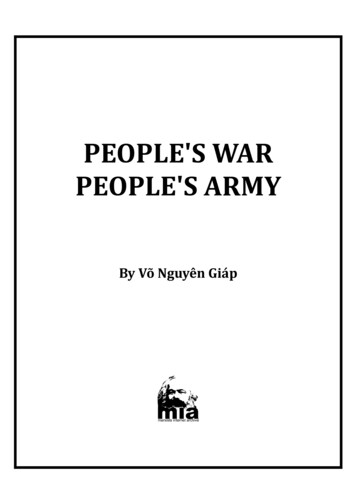
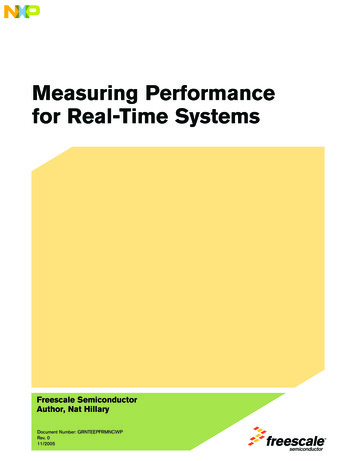
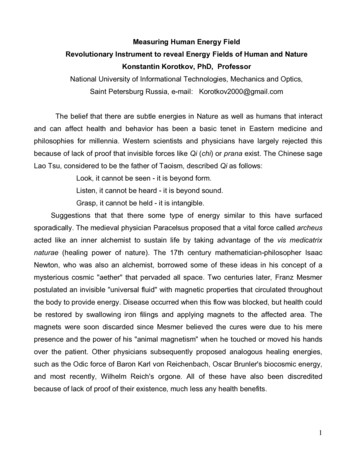
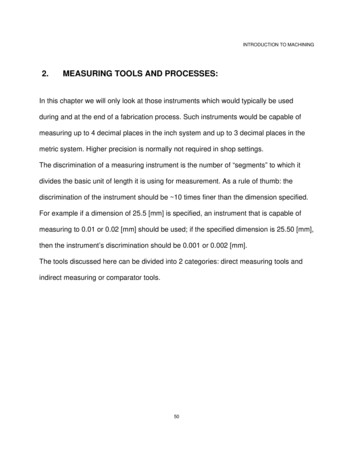
PROCEEDINGS of the Tenth International Driving Symposium on Human Factors in Driver Assessment,Training and Vehicle DesignOpen-ended Text QuestionsFigure 1 shows the most frequent terms in word clout format. For Question A, “driver”, “safety”,“passenger”, “time”, “route”, and “music” were the most common words. Figure 2 (a heat mapshowing the most associated words) indicates “map”, “efficiency”, “waste”, “route”, and “time”are c
ride-hailing companies like Uber and Lyft offer dynamic real-time ridesplitting to their customers (e.g., Uber Pool or Lyft Line). Given that ridesplitting services revolve around users, people’s attitudes towards them is of interest. Past research has identified which aspects encourage ridesplitting, including costs, personal preference (Thaithatkul, Seo, Kusakabe, & Asakura, 2015), wait .