Transcription
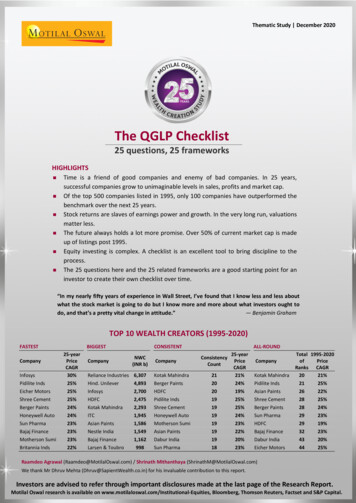
Thematic Study December 2020The QGLP Checklist25 questions, 25 frameworksHIGHLIGHTS Time is a friend of good companies and enemy of bad companies. In 25 years,successful companies grow to unimaginable levels in sales, profits and market cap.Of the top 500 companies listed in 1995, only 100 companies have outperformed thebenchmark over the next 25 years.Stock returns are slaves of earnings power and growth. In the very long run, valuationsmatter less.The future always holds a lot more promise. Over 50% of current market cap is madeup of listings post 1995.Equity investing is complex. A checklist is an excellent tool to bring discipline to theprocess.The 25 questions here and the 25 related frameworks are a good starting point for aninvestor to create their own checklist over time.“In my nearly fifty years of experience in Wall Street, I’ve found that I know less and less aboutwhat the stock market is going to do but I know more and more about what investors ought todo, and that’s a pretty vital change in attitude.”— Benjamin GrahamTOP 10 WEALTH CREATORS (1995-2020)FASTESTCompanyInfosysPidilite IndsEicher MotorsShree CementBerger PaintsHoneywell AutoSun PharmaBajaj FinanceMotherson SumiBritannia %23%22%CONSISTENTCompanyNWC(INR b)CompanyReliance IndustriesHind. UnileverInfosysHDFCKotak MahindraITCAsian PaintsNestle IndiaBajaj FinanceLarsen & 2998Kotak MahindraBerger PaintsHDFCPidilite IndsShree CementHoneywell AutoMotherson SumiAsian PaintsDabur IndiaSun panyKotak MahindraPidilite IndsAsian PaintsShree CementBerger PaintsSun PharmaHDFCBajaj FinanceDabur IndiaEicher MotorsTotal 1995-2020ofPriceRanks 425%Raamdeo Agrawal (Raamdeo@MotilalOswal.com) / Shrinath Mithanthaya (ShrinathM@MotilalOswal.com)We thank Mr Dhruv Mehta (Dhruv@SapientWealth.co.in) for his invaluable contribution to this report.Investors are advised to refer through important disclosures made at the last page of the Research Report.Motilal Oswal research is available on www.motilaloswal.com/Institutional-Equities, Bloomberg, Thomson Reuters, Factset and S&P Capital.
25th Annual Wealth Creation Study, 2020Motilal Oswal 25th Annual Wealth Creation StudyPage Celebrating 25 Years of Wealth Creation Studies! . 1 Wealth Creation 1995 to 2020: Findings . 2-16 25 for 25: Shortlisting Wealth Creators for the next 25 years .16-17 Appendix 1: The 100 Fastest Wealth Creators . 18-19 Appendix 2: The 100 Biggest Wealth Creators . 20-21 Appendix 3: The 100 Consistent Wealth Creators . 22-23 Appendix 4: The 100 All-round Wealth Creators . 24-25 Appendix 5: The 100 Wealth Creators (alphabetical) . 26-27 Theme 2021: The QGLP Checklist: 25 questions, 25 frameworks . 28-85 Wealth Creation 2015-20: Findings . 86-100 Appendix 6: The 100 Biggest Wealth Creators . 101-102 Appendix 7: The 100 Fastest Wealth Creators . 103-104 Appendix 8: The 100 Wealth Creators (alphabetical) . 105 The Wealth Creation Study Journey: Summary of 24 past studies . 106-113Abbreviations and Terms used in this reportAbbreviation / Term1995, 2015, 2020, etcAvgCAGRL to P / P to LINR bnPrice CAGRWCWealth CreatedDescriptionReference to years for India are financial year ending March, unless otherwise statedAverageCompound Annual Growth RateLoss to Profit / Profit to Loss. In such cases, calculation of PAT CAGR is not possibleIndian Rupees in billionIn the case of aggregates, Price CAGR refers to Market Cap CAGRWealth CreatedIncrease in Market Capitalization over the last 5 years, duly adjusted for corporateactions such as fresh equity issuance, mergers, demergers, share buybacks, etc.Note: Capitaline database has been used for this study. Source of all exhibits is MOFSL analysis, unless otherwise stated
25th Annual Wealth Creation Study, 2020Celebrating 25 years of Wealth Creation Studies!EVERY YEAR, for the past 25 years, we publish the Motilal Oswal Annual Wealth Creation Study.The studies have two main parts –1. Analysis of Wealth Created in the stock markets over the past 5 years, and2. Theme study.Over these 25 years, we have covered a wide range of themes – Good businesses which get better Competitive strengths of Wealth Creators How to value growth Characteristics of Multi-baggers Components of value Role of Interest rates Commodity cycles Consistent Wealth Creators Terms of Trade Great, Good, Gruesome, Winner Categories, Category Winners Blue Chip Investing Economic Moat 100x: The power of growth Mid-to-Mega: The power of leadership Focused Investing: The power of allocation CAP & GAP: The power of longevity Valuation Insights: What works, what doesn’t Management Integrity: Understanding sharp practicesTowards the end of the report, we present the essence and highlights of all previous 24 studies,including links to the full reports for your easy reference. These studies and the variousframeworks covered therein have led to Motilal Oswal’s investment philosophy, QGLP – Quality,Growth, Longevity, at reasonable Price (more on this in later pages).We start the report with the key findings of Wealth Creation data from 1995 to 2020. We have 4categories – Fastest, Biggest, Consistent and All-round Wealth Creators. The full lists are given inpages 18-27. We follow this with the current year’s special theme study titled “The QGLPChecklist: 25 questions, 25 frameworks” in pages 28-85. Finally, we cover the regular feature ofWealth Creation data from 2015 to 2020.We hope you find this edition as exciting as we feel bringing this to you.Happy reading and happy Wealth Creation!December 20201
25th Annual Wealth Creation Study, 2020Wealth Creation(1995-2020):Key findingsDecember 20202
25th Annual Wealth Creation Study, 202025 years of Wealth Creation: 1995 to 2020Objective, Concept & MethodologyObjectiveThe foundation of Wealth Creation is to buy businesses at a price substantially lower than their“intrinsic value” or “expected value”. The lower the market value compared to the intrinsic value,the higher is the margin of safety. Every year, as in the past 25 years, we endeavor to cull out thecharacteristics of businesses that create value for their shareholders.As Phil Fisher says, “It seems logical that even before thinking of buying any common stock, thefirst step is to see how money has been most successfully made in the past.” Our Wealth CreationStudies are attempts to study the past as a guide to the future, and gain insights into the variousdynamics of stock market investing.Concept & MethodologyWealth Creation is the process by which a company enhances the market value of the capitalentrusted to it by its shareholders. It is a basic measure of success for any commercial venture.For listed companies, we define Wealth Created as the difference in market capitalization, dulyadjusted for fresh equity issuances. (Note: For the 25-year study, we have considered Price CAGR,and not total return on account of major corporate events such as demergers. Also, due to datareliability, we have used PAT CAGR whereas EPS CAGR would have been ideal.)Every year, we study the Wealth Creators of previous 5 years. But to commemorate the 25thStudy, we have also looked at Wealth Creators over the 25 years, 1995 to 2020. For continuitysake, the 5-year Wealth Creation data (i.e. 2015-20) is presented page 86 onwards.For the 25-year study, our starting point is the top 500 companies in 1995 ranked by marketcapitalization. Our key criteria for calling a company a Wealth Creator is that it should haveoutperformed the benchmark index, in our case, BSE Sensex.Over 1995 to 2020, the Sensex rose from 3,200 levels in March 1995 to 29,500 by March 2020i.e. a CAGR of 9.2%. Interestingly, exactly 100 companies delivered returns higher than 9.2%. Wecall these 100 the Fastest Wealth Creators. We then sort these companies in descending orderof absolute Wealth Created to decide the Biggest Wealth Creators.The third category is what we have called the Consistent Wealth Creators. From 1995 to 2020,there are 23 three-year rolling periods i.e. 1995-98, 1996-99, 1997-2000, and so on up to 201720. To determine Consistent Wealth Creators, we rank the companies based on the highestnumber of rolling 3-year periods in which the companies outperform the corresponding Sensexperformance. Where the number is same, higher the Price CAGR, higher is the rank. Finally, wecombine the ranks of Fastest, Biggest and Consistent Wealth Creators to arrive at the Best Allround Wealth Creators.This is followed by some interesting data points garnered from 25 years of India’s corporatefinancial history.December 20203
25th Annual Wealth Creation Study, 2020Infosys is the Fastest Wealth Creator over the last 25 years Between 1995 and 2020, Infosys clocked a robust Price CAGR of 30% to emerge as the FastestWealth Creator. This was backed by 25-year PAT CAGR of 33%. The average market cap of the top 25 Fastest Wealth Creators was INR 4 billion in 1995, whichstood at over INR 750 billion in 2020. INR 1 million invested equally in these 25 stocks in 1995 would have grown to INR 162 millionin 2020, delivering 25-year CAGR of 23%.Top 25 Fastest Wealth Creators (1995 to CompanyInfosysPidilite IndsEicher MotorsShree CementBerger PaintsHoneywell AutoSun PharmaBajaj FinanceMotherson SumiBritannia IndsAsian PaintsBalkrishna IndsTitan CompanyKotak Mahindra BankLupinCoromandel IntlCRISIL3M IndiaAarti IndustriesDabur IndiaAmara Raja BatteriesHDFCHindustan ZincHero MotoCorpKansai NerolacTOTAL OF ABOVETOTAL OF 10025-year %7119%7123%18517%5325-yearPAT CAGR33%20%23%19%20%22%23%26%27%20%18%21%18%22%P to L19%18%22%18%19%20%22%19%22%16%22%17%NWC*(INR t Cap (INR 212,8242065693184208218,94510346,729887P/E 6%15%10%24%8%23%14%49%17%10%26%25%17%16%* NWC – Net Wealth CreatedReliance is the Biggest Wealth Creator over 25 years Between 1995 and 2020, Reliance Industries created wealth of INR 6.3 trillion to emerge theBiggest Wealth Creator. It is significantly ahead of the second ranked Hindustan Unilever(INR 4.9 trillion of Wealth Created). Infosys and Bajaj Finance have a creditable performance of being among the top 10, both interms of Fastest and Biggest Wealth Creators.December 20204
25th Annual Wealth Creation Study, 2020Top 25 Biggest Wealth Creators (1995 to CompanyReliance IndustriesHindustan UnileverInfosysHDFCKotak Mahindra BankITCAsian PaintsNestle IndiaBajaj FinanceLarsen & ToubroState Bank of IndiaSun PharmaTitan CompanyDabur IndiaPidilite IndsHindustan ZincBritannia IndsBPCLShree CementDr Reddy's LabsBerger PaintsSiemensEicher MotorsP&G HygieneTorrent PharmaTOTAL OF ABOVETOTAL OF 100NWC(INR 2143,11525-year25-year Market Cap (INR bn)Price CAGR PAT %37,77560217%17%46,729887P/E 13%10%19%21%24%16%20%13%42%12%21%16%16%* NWC – Net Wealth CreatedKotak Mahindra Bank is the most Consistent Wealth Creator over 25 years Kotak Mahindra Bank is the most Consistent Wealth Creator between 1995 and 2020. In the 23 three-year rolling periods between 1995 and 2020, Kotak Mahindra hasoutperformed the corresponding benchmark in 21 of those periods. It is closely followed by Berger Paints and HDFC with 20 periods of outperformance.(Where consistency is the same, higher the Price CAGR, higher the rank.) Six of the top 10 Consistent Wealth Creators are also among the top 10 Fastest WealthCreators – Berger Paints, Pidilite, Shree Cement, Honeywell Automation, Motherson Sumiand Sun Pharma.December 20205
25th Annual Wealth Creation Study, 2020Top 25 Consistent Wealth Creators (1995 to 2020)Consistency 25-year25-yearMarket Cap (INR bn)P/E (x)RoERank CompanyCount * Price CAGR PAT CAGR2020199520201995202019951 Kotak Mahindra Bank2121%22%2,4809291413%26%2 Berger Paints2024%20%4831751224%20%3 HDFC2019%22%2,82420131417%17%4 Pidilite Inds1925%20%6893602026%13%5 Shree Cement1925%19%634241912%24%6 Honeywell Auto1924%22%2291472423%19%7 Motherson Sumi1923%27%1931172610%21%8 Asian Paints1922%18%1,59911592727%26%9 Dabur India1920%19%7968524223%14%10 Sun Pharma1823%23%845321169%23%11 CRISIL1820%18%911271429%24%12 3M India1820%22%21326610618%8%13 Aarti Industries1820%18%1331251218%23%14 Chola Financial1814%13%544101412%10%15 Bajaj Finance1723%26%1,3332251416%19%16 Coromandel Intl1720%19%159115925%10%17 AstraZeneca Pharma1719%10%601831420%36%18 Eicher Motors1625%23%3571201018%42%19 Balkrishna Inds1622%21%1531191516%16%20 Titan Company1622%18%8296552423%18%21 Hero MotoCorp1619%22%3184112321%26%22 Kansai Nerolac1619%16%2082401814%25%23 Torrent Pharma1618%16%3345332321%21%24 Abbott India1618%13%3284551624%75%25 P&G Hygiene1617%15%3397785038%12%* Consistency count is the number of outperformances over the 23 three-year rolling periods between 1995 and 2020Where consistency is the same, higher the Price CAGR, higher the rankKotak Mahindra Bank is also the best All-round Wealth Creator December 2020Besides being the Most Consistent Wealth Creator, Kotak Mahindra Bank has also emergedthe best All-round Wealth Creator.The All-round Wealth Creators rank is arrived at by combining the ranks of Fastest, Biggestand Consistent Wealth Creators.Kotak Mahindra ranks 14th among the Fastest Wealth Creators, 5th among the Biggest and 1stamong the Consistent Wealth Creators. This gives it a combined rank of 20, which is the bestof the 100.It is closely followed by Pidilite Industries and Asian Paints with All-round Wealth Creatorsrank of 21 and 22, respectively.Here too, where the Total Rank is the same, higher the Price CAGR, higher the rank.6
25th Annual Wealth Creation Study, 2020Top 25 All-round Wealth Creators (1995 to CompanyKotak MahindraPidilite IndsAsian PaintsShree CementBerger PaintsSun PharmaHDFCBajaj FinanceDabur IndiaEicher MotorsHoneywell AutoTitan CompanyBritannia IndsMotherson SumiInfosys3M IndiaNestle IndiaReliance IndustriesHind. UnileverHero MotoCorpCoromandel IntlTorrent PharmaBalkrishna IndsAbbott IndiaP&G 03233211623192425Totalof 980811995-2020Price 0%18%16%16%19%20%18%22%18%17%1995-2020PAT 2%17%16%16%22%19%16%21%13%15%Consumer/Retail is the Biggest Wealth Creating sector over 25 years At INR 12 trillion, Consumer/Retail is the biggest Wealth Creating sector during 1995 to 2020. 63 of the 100 Wealth Creators are from consumer-facing businesses, accounting for 68% oftotal Wealth Created.Sector mix of Top 100 Wealth Creators (1995-2000)Sector/{No. of companies)Consumer & Retail (14)Oil & Gas (2)NBFC (8)Pharma & Healthcare (15)IT (3)Banks - Private Sector (1)Paints (3)Autos (14)Cap Goods, Engg, Constn (8)Banks - Public Sector (1)Consumer Durables (6)Building Materials (4)Metals - Non-Ferrous (1)Chemicals (4)Textiles (2)Others (14)TOTAL (100)December 2020Net Wealth CreatedINR %1,2923%43,115100%Mkt Cap (INR 318341,3493446,7298871995-2020 CAGRMkt 1021162322199536131330341423272512311811171226207
25th Annual Wealth Creation Study, 2020Top companies in 1995 which did not make it to the Wealth Creators list Almost 60 of the top 100 market cap companies in 1995 did not make it to the WealthCreators list, as their return CAGR was lower than that of the Sensex (9.2%). Below are the top 25 among them.Top 25 companies in 1995 whose 25-year return CAGR was lower than that of the Sensex (9.2%)Market CapRank in 1995-2020 CAGRCompany1995PricePATSAIL1-2%3%MTNL3-13%0%Tata Steel63%P to LHPCL86%9%Tata Motors101%P to LTata Comm110%P to LColgate-Palmolive138%11%Hindalco Inds.163%11%Grasim Inds177%12%Tata Chemicals183%6%Castrol India194%10%ACC206%10%BHEL214%P to LCompanyJCTCentury TextilesIndian HotelsMRPLAshok LeylandReliance InfraTata ConsumerAmbuja CementsStandard BatteryReliance CapitalGE ShippingTata PowerMarket CapRank in19952324262832333637383941421995-2020 CAGRPricePAT-16%P to L4%4%2%5%-3%0%7%7%-10%8%9%10%9%14%-13%-5%-12%P to L6%-2%-5%-5%Note: P to L stands for Profit to LossInteresting data points over 25 yearsMarket Cap & PAT Mix between companies in 1995 and new listings post 1995Around 50% of both current market cap and profits is by new listings post 1995. Clearly, the futureholds a lot of promise.December 2020INR billionMarket CapBase companiesNew companiesMixBase companiesNew %54%49%51%48%52%Profit After TaxBase companiesNew companiesMixBase companiesNew %55%47%53%53%47%8
25th Annual Wealth Creation Study, 202025 Most Profitable Companies (measured by Average RoE)21 of 25 most profitable companies are consumer-facing. In the long run, amidst massive change,consumer and consumer behavior are the most predictable elements.CompanyHindustan UnileverNestle IndiaColgate-PalmoliveCastrol IndiaHero MotoCorpP&G HygieneDabur IndiaVST IndustriesAsian Paints1995-2020Avg RoE68%62%61%56%41%36%32%32%30%CompanyInfosysAbbott IndiaBritannia IndsCRISILITCTitan CompanySun PharmaMotherson SumiTorrent Pharma1995-2020Avg RoE30%29%29%28%26%24%24%24%24%CompanyGlaxo PharmaFoseco IndiaBerger PaintsCoromandel IntlNavneet EducationMonsanto IndiaPidilite Inds1995-2020Avg RoE23%23%23%23%23%23%23%25 Companies with highest PAT CAGRTime is the friend of good companies and enemy of bad companies. In 25 years, successfulcompanies grow to unimaginable levels. For instance, Infosys’s 1995 PAT was INR 0.13 billion,which is now at INR 164 billion. This is a 33% CAGR or 1,256 times in 25 years.CompanyInfosysVedantaMotherson SumiBata IndiaBajaj FinanceMphasisSun PharmaEicher MotorsHero MotoCorpHDFCHoneywell AutoKotak Mahindra BankBharat Electronics1995-2020 nyJubilant LifeBalkrishna IndsHind. Oil ExplorationAmara Raja Batt.Mah. SeamlessBerger PaintsPidilite IndsBombay BurmahBritannia Inds.Hindustan ZincKalpataru PowerSupreme Petrochem1995-2020 0%9220%8920%8719%8319%8019%8025 Companies with biggest increase in PAT(INR bn)CompanyReliance IndustriesHDFCInfosysState Bank of IndiaITCLarsen & ToubroKotak MahindraVedantaHindustan UnileverHindustan ZincBajaj FinanceGrasim IndsSun PharmaDecember 20201995-2020Incr. in PAT4182131641561529385706766525139% ofFY20 .8%99.7%94.5%99.5%(INR bn)CompanyBPCLHindalco IndsHPCLHero MotoCorpBajaj HoldingsAsian PaintsLIC HousingAmbuja CementsDr Reddy's LabsNestle IndiaEicher MotorsBharat Electronics1995-2020Incr. in PAT393630302727242020191818% ofFY20 .9%99.4%99.2%9
25th Annual Wealth Creation Study, 202025 Companies with highest Sales CAGRWhat was true about change in PAT is equally true for change in Sales. Infosys tops the list againwith Sales CAGR of 34% i.e. 1,638 times in 25 years.CompanyInfosysMotherson SumiMphasisBajaj FinanceVedantaSun PharmaLupinDewan HousingHDFCMax FinancialAmara Raja Batt.Kalpataru PowerThomas Cook (I)1995-2020 ompanyZee EntertainmentReliance CapitalSundaram ClaytonReliance IndustriesBombay BurmahCRISILKotak Mahindra BankHindalco IndsCholaman.Inv.&FnRain IndustriesDr Reddy's LabsPiramal Enterprises1995-2020 13821%12921%12421%11220%9920%9720%9725 Companies with biggest increase in Sales(INR bn)CompanyReliance IndustriesBPCLHPCLTata MotorsLarsen & ToubroTata SteelHindalco IndsState Bank of IndiaM&MInfosysVedantaGrasim IndsHDFC1995-2020Incr. in 7842756694% ofFY20 99.9%99.8%97.3%99.7%(INR bn)CompanyMotherson SumiMRPLSAILITCAdani EnterprisesHindustan UnileverCPCLSun PharmaHero MotoCorpTata PowerAmbuja CementsAshok Leyland1995-2020Incr. in Sales635502491470428370349328288281267211% ofFY20 %96.5%98.6%93.9%CompanyMah. ScootersMRFHDFCTimken IndiaAsahi India GlassITCMah. Seamless1995-2020BV CAGR20%20%19%19%19%19%19%25 Fastest Book Value Growth CompaniesCompanyInfosysMotherson SumiSun PharmaEicher MotorsLarsen & ToubroLupinHero MotoCorpAmara Raja Batt.MphasisDecember 20201995-2020BV CAGR31%28%26%25%24%24%23%23%23%CompanyCiplaAdani EnterprisesRain IndustriesKotak MahindraBajaj FinanceSundaram ClaytonBalkrishna IndsShree CementHoneywell Auto1995-2020BV CAGR23%23%21%21%21%21%20%20%20%10
25th Annual Wealth Creation Study, 202025 Highest Cumulative PAT Companies (INR bn)1995-2020CompanySum of PATReliance Industries3,784State Bank of India1,727Infosys1,520ITC1,206HDFC1,204Hindustan Zinc882Tata Motors859Larsen & Toubro752BPCL6791995-2020CompanySum of PATHindustan Unilever611HPCL518SAIL487Sun Pharma469Kotak Mahindra460Hindalco Inds.456BHEL449M&M448Grasim Inds413CompanyVedantaTata SteelSterlite Inds.Hero MotoCorpBajaj HoldingsReliance InfraAmbuja Cements1995-2020Sum of PAT397395385354327222209CompanyTata MotorsAmbuja CementsSun PharmaACCCastrol IndiaBajaj HoldingsTata Comm1995-2020Sum of Divd8276686665646425 Highest Cumulative Dividend Companies (INR bn)1995-2020CompanySum of DivdITC708Infosys633Hindustan Zinc503Hindustan Unilever498Reliance Industries457HDFC312Vedanta271BPCL262State Bank of India2601995-2020CompanySum of DivdHero MotoCorp206Larsen & Toubro206HPCL179Tata Steel176SAIL124BHEL118M&M99Nestle India83Asian Paints8325 Biggest Capex Companies measured by increase in Gross Block (INR bn)1995-2020CompanyIncr. in GBReliance Industries7,385Tata Motors2,686Tata Steel1,934Vedanta1,398Hindalco Inds1,383Grasim Inds990SAIL984BPCL716M&M680CompanyState Bank of IndiaTata Power Co.HPCLTata Steel BSLLarsen & ToubroInfosysSun PharmaTata CommMotherson Sumi1995-2020Incr. in GB664660604564510389351346307CompanyReliance InfraHindustan ZincITCCESCMRPLAmbuja CementsApollo Tyres1995-2020Incr. in GB28828527226225425024025 Companies with Highest Increase in Debt (INR bn)1995-2020CompanyIncr. in DebtReliance Industries3,522Larsen & Toubro1,411Tata Motors1,236Tata Steel1,128Grasim Inds829M&M822Hindalco Inds680BPCL651Vedanta591December 20201995-2020CompanyIncr. in DebtTata Power475HPCL434Piramal Enterprises421SAIL419Ashok Leyland218Tata Steel BSL166Reliance Infra162MRPL159Aban Offshore1561995-2020CompanyIncr. in DebtMotherson Sumi131CESC127Adani Enterprises124Tata Comm122Sundaram Clayton120Chambal Fertilisers88Sun Pharma8311
25th Annual Wealth Creation Study, 20201995-2020 Rank AnalysisIn our 2015 Wealth Creation Study, we called large, mid and small cap stocks as Mega, Mid andMini, defined as under: Mega – Top 100 stocks by market cap rank for any given year Mid– Next 150 stocks by market cap rank Mini – All stocks below the top 250 ranks.Market cap ranks of companies change constantly. Over time, companies also cross over fromone category to another. For the period 1995-20, the market cap ranks crossover matrix standsas given below.1995-2020: Market cap rank crossovers: Number of companies and average returnsFROM (in 1995)MiniMidMega424%1021%13%Avg Return1618%12%207%Mini911Avg Return0%99-1%45-3%TO (in 2020)MegaAvg ReturnMid2232How to read the tableDecember 2020 FIRST COLUMN:— Over1995-20, 4 Minis moved to the Mega category, delivering 24% return CAGR— 16 Minis moved to Mid by 2020, (18% return CAGR).— 911 Mini companies stayed as Mini (0% return CAGR). SECOND COLUMN:— 10 Mids moved to Mega by 2020 (21% return CAGR)— 22 Mids stayed as Mid (12% return CAGR).— 99 Mids slipped to Mini (-1% return CAGR). THIRD COLUMN:— Of the 100 Mega companies in 1995, only 32 stayed as Mega in 2020 (13% return CAGR).— 20 slipped to Mid (7% return CAGR)— A high 45 slipped to Mini (-3% return CAGR). Note: During the 1995-2020 period, Sensex return was 9.2%.12
25th Annual Wealth Creation Study, 2020We present the major positive crossovers below.Mini to Mega (4 companies; 24% return CAGR)CompanyEicher MotorsBerger PaintsHoneywell AutoHavells IndiaAVERAGERankMar-20 Mar-955238847450954397010011995-2020 CAGRPricePAT25%23%24%20%24%22%23%28%24%Mkt Cap (INR bn)Mar-20 Mar-953571483122913000.2P/EMar-20 Mar-952010751247244112Mini to Mid (16 companies; 18% return CAGR)RankCompanyMar-20 Mar-95Vinati Organics2161065Motherson Sumi111432Balkrishna Inds136376Coromandel Intl128324CRISIL195452Aarti Industries148377Amara Raja Batt.211528Astrazeneca244437TTK Prestige228400Apollo Hospitals130681Mphasis153458Exide Inds167286Johnson Controls245735Schaeffler India165300Shriram 020 5%10%18%18%Mkt Cap (INR bn)Mar-20 122580.311611500.21251P/EMar-20 14699311862124Mkt Cap (INR bn)Mar-20 P/EMar-20 Mar-9517266020419211625143466106112355164728Mid to Mega (10 companies; 21% return CAGR)CompanyInfosysPidilite IndsShree CementSun PharmaBajaj FinanceLupin3M IndiaHero MotoCorpAbbott IndiaWhirlpool IndiaAVERAGEDecember 2020RankMar-20 3961071995-2020 CAGRPricePAT30%33%25%20%25%19%23%23%23%26%20%P to L20%22%19%22%18%13%12%14%21%13
25th Annual Wealth Creation Study, 2020Stock Markets over 25 years – Key indicatorsSector profitability low for the last 8 years Most businesses are cyclical in character. As is said, a rising tide lifts all boats. Most sectorsdo well when the economy is on the upswing. Thus, at the peak of the economic boom in2007, 29 of 37 sectors recorded RoE 13%. However, for the last 7 years, that number is downto between 7 and 11. Only 3 sectors – Consumer/Retail, IT and Paints – maintained RoE 13% for each of the last25 years.Sector profitability low for the last 8 yearsSectors with RoE 13%27 27 26 272020201910 10 11 107201713 11 113020181724 26 2620162020122007200320062002200492005820 22201117151420012000199919981997199611 102620102921 2319 1817 1529 2826 2619952022200926 272311200818 19201516 142013811 11Sectors with RoE 13%2014Sector Mix by RoECorporate Profit to GDP at all-time lowsWe seem to have hit the bottom in corporate profits. Corporate Profit to GDP has stagnated forthe last 5 years. This is similar to 1999 to 2003, after which corporate profits took off for the next5 years.Corporate Profit to GDP at all-time lows4.64.25.0 4.94.43.7 3.53.3December 2020Long-period 1020092008200720062005200420032002200120001.9 1.71.6 1.7199919982.2 2.11997199619952.5 2.63.12.82.320203.95.720195.22018Corp Profit to GDP (%)14
25th Annual Wealth Creation Study, 2020Sensex EPS is near flat FY14 through 0:9% CAGRSensexCAGR: 5%FY14-20:2% CAGRFY19FY08-14:8% CAGRSensex CAGR:6%FY15FY03-08:25% CAGRSensex CAGR:39%FY12FY98-03:–1% CAGRSensex CAGR:-5%FY95-98:17% CAGRSensex CAGR:6%Interest rates are softeningPermanent change in long-term interest rate band (from 12-14% to 6-8%) is leading to change inva
The foundation of Wealth Creation is to buy businesses at a price substantially lower than their intrinsic value or expected value. The lower the market value compared to the intrinsic value, the higher is the margin of safety. Every y

