Transcription
A T RAI N EE ’S GU ID ETO A Q U A L IT YI M P RO V E M EN T PR OJ EC TA TRAINEE’S GUIDETO A QUALITYIMPROVEMENT PROJECTQuality Improvement DirectorateMarch 2021www.rcseng.ac.uk/standardsandguidance
ContentsIntroduction 3Stages of a project 4 - 121.Identify2.Objective3.Baseline measurement4.Plan, do, study, act5.Sustainability6.ShareConclusion 13Appendix: Rules to identify special cause patternson a run chart 14 - 15References 16Bibliography 16The College would like to thank Daniel Watts, Devan Limbachia (Surgical trainees)and Namet Surana (GP trainee), for drafting and contributing to the guide.2
IntroductionEvery hospital environment and healthcare setting contains opportunities to improvepatient care. Existing and novel processes and ways of working require constantre-evaluation and adjustment to ensure areas of weakness are not overlooked; a structuredquality improvement (QI) project provides a framework to facilitate this. In a healthcaresetting, a QI project can be undertaken by any member of the hospital trust.As part of their training, junior doctors are often expected to instigate projects, beinguniquely placed to identify areas for improvement ‘on the ground’. Here we present asimple guide, based on our own experiences of organising a successful QI project fromconception to completion and detail our mistakes and lessons learned in the process.We hope this guide will serve as a valuable roadmap for anyone planning to embarkupon their own QI journey.3
Stages of a projectSometimes the terminology of QI projectscan be confusing, but the underlyingprinciples are quite simple and intuitive.We recommend a simple six-stageapproach to a QI project, in line with the‘model of improvement’ framework.1. IDENTIFYRoot cause analysisWhen improving standards followingan incident, root cause analysis can beused to identify the underlying causeto prevent recurrence.Three basic types of cause are normallyidentified. Physical causes – material itemsfailed in some way (for example, theonline handover list is not functioning,resulting in an inability to identifypatient caseload). Human causes – a person has madea mistake or not carried out a requiredtask. Human causes can often lead tophysical causes (for example, a taskhanded over to a wrong staff member). Organisational causes – a system,process, or policy that people useto make decisions or do their workis not present or does not workas intended (for example, lack ofstandardised uniforms).The first step of any QI project is to identifyan area that needs improvement. This oftenresults from: personal experience of patient care; a critical incident; an audit.Once identified, a couple of tools canthen be used to explore this further tounderstand the underlying issues: root cause analysis; driver diagram.better system performance (care)and better professional development(learning)’.5There are several basic tools that can beused to perform a root cause analysis.These include: five whys – by repeatedly asking whysomething has occurred you can get tothe root of the problem. drill down – split a probleminto sections to better understandeach area. cause and effect (fishbone)diagram – a chart that helpsidentify the many possible causesfor an effect or problem by sortingthem into categories.4
It is usually helpful to ask other membersof the team what they think causes theissue and how they think it might beimproved. Valuing and listening to otherteam members can help to generate ideasand can also help with embedding changeat the end of the project.Medication not givenWhy?Medication not prescribedWhy?Doctor unaware medication needed prescribingWhy?Task handed to incorrect staff memberWhy?Poor recognition of different staff membersWhy?Root cause!Now think of solutionsFigure 1: Example of a ‘five whys’ root cause analysisDriver diagramWhen trying to improve patient experience,a root cause analysis may not be thebest option. Instead, a driver diagram oralternative tool may be more useful.A driver diagram is a visual representationof all the factors that could influencea patient’s experience, which thenenables structured thinking as to howtheir experience could be improved.See example diagram opposite (Figure 2).5
AimPrimary DriversSecondary DriversCognition(e.g. dementia)LanguageBarrierPatientFactorsPoor HearingPoor EyesightLack ofInformationUniforms NotIdentifiableLack of UniformsStaff Resistanceto UniformsImprove theidentificationof HealthcareStaffFactorsInfection ControlCost of UniformsCommunicationChange IdeaMemoryAssessmentsImprove AccessTranslatorsEnsure HearingLoops AvailablePatient leafletsStandardiseUniformsDoctorsLanyardsStaff NameBadgesImproveAwarenessStaff TrainingLack of trainingWardFactorsHigh StaffTurnoverEnsure StaffContinuityPatientsFrequentlyMovedReduce PatientMovementLack of SignageWard PostersFigure 2: Driver diagram highlighting factors that influence the identification of healthcare staff6
Other tools that can be used to assess howa system works include: conventional process mapping; value stream mapping; spaghetti diagram.OUR PROJECTThe aim of our project was to improvethe recognition of healthcare staff onthe hospital ward. While on the ward wenoticed that both staff and patients werefrequently struggling to identify the job rolesof other staff members. This led to incorrecthandover and miscommunication amongstaff and, most importantly, to confusionamong patients.LESSON LEARNEDOur initial idea focused only on improvingthe recognition of doctors but followingdiscussions with both patients and staff,we expanded our project aim to include allclinical healthcare staff.TIPIt is important to keep it simple– small incremental changes will bemore attainable.2. OBJECTIVEHaving identified the underlying cause,try to define your project objective clearlyso everyone is aware of what you areaiming to achieve. Using the SMART(specific, measurable, achievable, realistic,timebound) criteria as a starting guideis a constructive way of establishing aproject aim. Once your project objective isestablished, try to build a multidisciplinaryteam around the project. Finding widersupport from those most affected by anypotential changes (stakeholders) will proveessential for any project. Including them inyour project team will make things easiergoing forward as it can help to build supportand allows others to contribute ideas thatyou may not have thought of by giving adifferent perspective. Doing this early oncan help to shape your project ideas andconfirm that improvement is needed.NB. Some trusts have additional formsof QI assistance. There may be anestablished QI champion, QI mentorsor a QI hub. Approach these resourcesearly for support and advice.OUR PROJECTDespite having the ward team onboard,we were met with resistance from seniormanagers who were based away fromthe ward. This occurred at a relativelylate stage of the project and we facilitatedresolution to this by meeting with thedirector of service improvement.LESSON LEARNEDWe should have tried to canvass the fullrange of opinions from all those affected,including all service users. Involving anexecutive or management sponsor mayhave facilitated an earlier resolution of theproblems that we faced.TIPStarting small will improve the chanceof success, as only a smaller group ofpeople will need to agree to any change.The project can be scaled up once themethodology has proved to be effective.3. BASELINEMEASUREMENTSuccessfully measuring any changewill be key in demonstrating its efficacy.It is therefore vital that measurementsare taken correctly to demonstrate yourproject’s success. Before implementingany changes, you will need a baselinemeasurement as a way of tracking yourprojects progress. Ideally, any baselineshould include at least 15 data points toallow you to analyse any changes overtime, which will be discussed in moredetail later.7
Donabedian was a physician who cameup with a framework for evaluating healthservices and quality of care. His modeldescribed three main types of measure,each one leading to improvements in thenext, with the model of improvement addingone more.StructuralMeasuresDescribes the structurewithin which healthcareis being deliverede.g. Staffing numbers,Theatre capacity,equipmentOutcomeMeasuresDescribes theeffects of healthcareon patient/populationoutcomes. Funding is oftenbased around them.e.g. A&E waiting times,re-admissions rateBalancingMeasuresDescribemetrics usedto ensure animprovement in onearea isn’t negativelyimpacting another areasProcess MeasuresDescribes thehealthcare being deliveredto patients.e.g. Education, diagnosis,treatmentFigure 3: Framework for evaluating health servicesOUR PROJECTWe created a questionnaire that measuredhow well staff and patients could identifystaff roles to gather a baseline before anychanges were implemented.TIPProjects linked to trust or nationalobjectives are more likely to obtainsenior buy-in and therefore havea greater chance of success.LESSON LEARNEDIf you are creating a questionnaire, thinkclosely about what will happen next. It isimportant to make sure that you are able toeasily measure any subsequent changesthat do occur. By planning from the starthow the changes will be measured andanalysed over time will make things muchsimpler at the end.8
4 . P L A N , D O , S T U D Y, A C TOnce you have identified the area requiring improvement, understood the cause of theissue, and measured the baseline, the next stage is to plan and implement the necessaryintervention(s). Rather than a single large intervention, implementing several small-scalechanges will increase a project’s chance of success. This should be done according to theplan, do, study, act (PDSA) cycle.ActPlanPDSA CycleStudyDoPlanPlan the next changeor intervention to beimplementedDoCarry out the test orchange and collect thedata required. This bebased on the measurableoutcomes agreed in theplanning stagesStudyAnalyse the collecteddata compare to predictionsand reflect on what hasbeen learnedActPlan the next change cycleor full implementationFigure 4: PDSA cycle once each change has been tested, measured and acted upon;the process is then repeated, creating a cyclePlanDuring the ‘plan’ stage, you should carefullyplan which changes you are going toimplement and study. The interventionshould be small enough that it takes placein a reasonable time scale. The changesshould be implemented initially as a local‘trial run’.OUR PROJECTWe had a few different ideas for improvingthe recognition of staff on the ward.We decided to start with patient leaflets.These would be the easiest to implementas there were already several leaflets thatcould be adapted.LESSON LEARNEDBefore trying to implement new changesit can be helpful to build upon and improveexisting designs and processes to gaintraction.TIPWrite down everything that is done andkeep a folder with all documentation.This is really useful when writing up yourproject at the end9
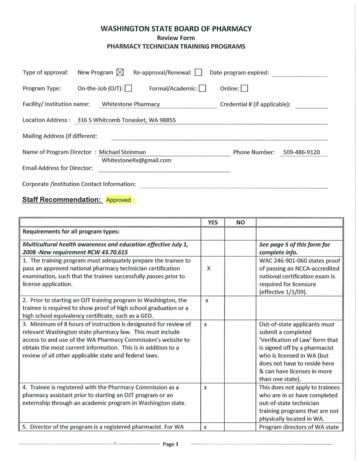
DoStudyThe ‘do’ stage is where you implementyour change(s). Any change(s) should betested on a small scale first. The cumulativeresult of multiple small-scale changes,each tested, learned from and fine-tuned,should result in a measurable and reliableimprovement. Collecting data accuratelyto show whether the changes being testedhave resulted in improvement will beessential in proving your idea’s success.To do this, small datasets should becollected regularly, 10 data points with10 samples for each has previouslybeen suggested.Once your data have been collected theywill need to be analysed. One effective andrelatively straightforward method to do thisis using ‘run charts’ (e.g. Figure 4). Thesecharts allow you to analyse the full impactof any change over a period of time.OUR PROJECTDuring our project, we tried to move on tosubsequent PDSA cycles before completingthe previous one. The urge to move onis understandable but may compoundproblems later.LESSON LEARNEDWe should have made sure we allocatedenough time to complete each PDSA cycleand collected more data.TIPStart with the easiest change to implementfirst, as this can be helpful in identifying anyteething problems.Foremost, you need to be sure that thechange you are observing is due to thechanges you have implemented. This willprevent you from reacting unnecessarilyto one-off changes. There are two basicreasons that changes occur, and it isimportant to differentiate between the two. Common cause variation – this isthe natural variation that occurswithin normal practice and cannot beaccounted for by any specific factor(for example, patient demographics). Special cause variation – this is theunnatural variation that is secondaryto a specific factor; this should be theintervention you are investigating(e.g. introducing patient leaflets).You can use run charts to differentiatebetween these factors when analysingyour results. In Figure 4, for example, thefluctuations largely represent changesresulting from common cause variation,whereas the overall positive trendrepresents changes resulting from specialcause variation (our interventions).10
100% of Patients806040% of patientsMedian200123456789101112WeeksFigure 5: Run chart showing the percentage of patients who reported that they were ableto recognise staff each week (note that the graph is for illustrative purposes only and doesnot contain real data)Please see Appendix A for an explanationof rules used to identify special causepatterns in data sets.Our projectDuring our study we did not fully appreciatethe importance of assessing for a long-termtrend. We therefore did not collect enoughdata points, and so could not demonstratewhether the changes we were seeing weredue to common cause or special causevariation.LESSON LEARNEDSmaller, more regular data samples aremore important than larger, infrequentsamples.TIPTry to ensure that enough baselinemeasurement are collected so the systemcan be confirmed to be in a steady statebefore any changes are implemented.Ensure that data areas collected at differenttimes on different days of the week toreduce the influence of confounding factors.ActTo complete the PDSA cycle, you mustdecide on the next step. This can take threedifferent approaches: Adopt – fully implement the changefrom this PDSA cycle. Adapt – amend the change fromthis PDSA. Begin the next cycle – start theplanning for the next PDSA cycle.OUR PROJECTWe adapted our patient leaflets and wardposters following feedback from patientsand staff after their introduction on theward.LESSON LEARNEDJust because your idea was not successfuldoes not mean that it cannot beimplemented with adaptations; however,you should make sure to reassess the newidea fully with a complete PDSA cycle.TIPTry to ensure that changes are simple andfocused or easy to follow.11
5 . S U S TA I N A B I L I T Y6. SHAREOne of the biggest challenges with anyQI project is sustaining any change thathas been achieved. Implemented changescan be forgotten as time goes on, so itmay be beneficial to run regular teachingsessions to refresh staff about the findingsof your project.Once you have completed your project,it is important to consider how you canshare your results. Consider local eventsin your hospital – grand rounds or QIproject symposiums can be found inmost trusts. These are good ways toupdate your colleagues. If your resultshave demonstrated a significant changeor improvement, it may have a widerrelevance and so it is worth consideringwriting up the project as an abstractpresentation or as a journal paper.This can be compounded as staff(particularly juniors) are constantlychanging jobs and moving hospitals.While this allows us a great opportunityto pick up new ideas, it also gives littletime to implement them. This is part of thereason why senior management should beinvolved early on during the project, as theymay be able to recruit others to continueyour work when you have moved on.Incorporating your changes intostandardised frameworks can helpensure your changes are sustained,these can include: proformas; check-lists; protocols; hospital policy; guidelines.OUR PROJECTOur project took much longer to implementthan originally anticipated. As a result, teammembers moved to new trusts before theproject was finished. This meant trying torecruit new members to join the project on,to ensure its continuity.OUR PROJECTAlthough our project was not an audit, wewere able to present our pilot project at alocal audit meeting. This helped us to gainmore attention from senior managementand allowed us to secure funding to roll outthe changes more widely.LESSON LEARNEDA project does not have to be fullycompleted to be presented. You even usepresentations to gain support and to gatherfurther opinions.TIPAiming to present at a specific meeting canhelp to provide a deadline to ensure thatyou work more efficiently.LESSON LEARNEDIncorporating your project within a QIdatabase can allow hospital managementto ensure that a project continues long afteryou have left.TIPMake sure that you inform new staffmembers of your project at changeovertimes (e.g. August). They will often havean induction that you can present at.12
ConclusionAlthough the process around QI project can be intimidating, it is a valuable tool for improvingpatient care and standards within any environment. With the recent significant change inclinical practice resulting from the COVID-19 pandemic, this has been made even moreapparent. This simple guide provides the foundations for starting any quality improvementproject and allows readers to learn from the mistakes based on our own experiences.13
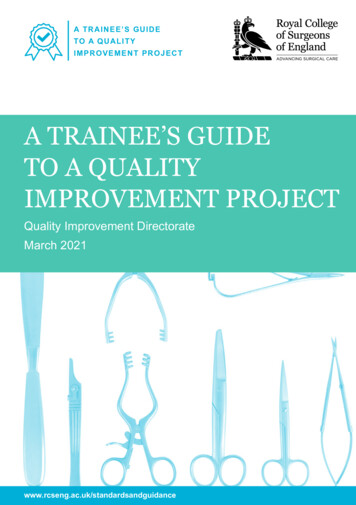
Appendix: Rules toidentify special causepatterns on a run chartBelow are some rules you can use to analyse charts objectively to look for specialcause variation.1 If 1 rule is met in your run chart, it shows there is non-random variationi.e. due to your intervention.Note that we have used a figurative data set to illustrate these rules. A run chart shouldinclude at least 15 points of data for the rules to be applied.2Rule 1: ShiftTypically, six or moreconsecutive pointsare needed to provea shift pattern.10080% of PatientsThis pattern observesa number of consecutivedata points, all eitherabove or below the median.Data points cannot includethose that fall on the median.6040% of patientsMedian200123456789101112131415WeeksRule 2: TrendTypically, six or moreconsecutive pointsare needed to provea trend pattern.10080% of PatientsThis pattern observes anumber of data points allincreasing or all decreasing.If the value of two or moreconsecutive data points isthe same, only the first datapoint is counted. Data pointscan include those that crossthe median.6040% of patientsMedian200123456789101112131415Weeks14
Rule 3: RunsThe number of runs can becalculated using the numberof crossings of the medianline plus one. An appropriatenumber of runs for a givendata set can be calculatedusing a statistical table.Statistically significantchange is signalled by toofew or too many runs.Data points cannotinclude those that fallon the median.10080% of PatientsThis pattern observestoo few or too many runs(one or more consecutivedata point(s) on one sideof the median).6040% of patientsMedian20012345679101112Run LimitExample: this data sethas 10 useful data points(data points from week 5and week 7 are not usefulas they fall on the median).Using the statistical table,we expect between threeand eight runs. Our dataset shows six runs andtherefore we do not havespecial cause variationaccording to this rule.3No. Data PointsLower LimitUpper Limit103811391231013410144111541212(Table summary from p.11)Rule 4: Astronomical point16517513186131961410080% of PatientsThis pattern observes adata point that is obviouslydifferent from the rest of thepoints – it is subjective(unlike the other rules).8Weeks6040% of patientsMedian200123456789101112131415Weeks15
References1.ACT Academy. Driver Diagrams. London: NHS Improvement; 2019.2.Provost LP, Murray SK. The Health Care Data Guide: Learning from data for improvement.San Francisco, CA: Jossey Bass; 2011.3.NHS Institute for Innovation and Improvement. A Guide to Creating and Interpreting Run andControl Charts Turning Data into Information for Improvement. London: NHS Institute; 2009.BibliographyACT Academy. Plan, Do, Study, Act (PDSA) Cycles and the Model for Improvement. London: NHSImprovement; 2018.ACT Academy. Developing Your Aims Statement. London: NHS Improvement; 2018.ACT Academy. A Model for Measuring Quality Care. London: NHS Improvement; 2017.ACT Academy. Managing Variation. London: NHS Improvement; 2003.ACT Academy. Driver Diagrams. London: NHS Improvement; 2019.Batalden PB, Davidoff F. What is ‘quality improvement’ and how can it transform healthcare?Qual Saf Health Care 2007; 16: 2–3.Etchells E, Woodcock T. Value of small sample sizes in rapid-cycle quality improvement projects 2:assessing fidelity of implementation for improvement interventions. BMJ Qual Saf 2018; 27: 61–65.Foster P. 5 root cause analysis tools for more effective problem-solving [blog post]. EASE, Inc. 30October 2018 r-more-effective-problem-solving(cited February 2021).Holmes D. Mid Staffordshire scandal highlights NHS cultural crisis. Lancet 2013; 381: 521–522.Keogh B. Review into the Quality of Care and Treatment Provided by 14 Hospital Trusts in England:Overview report. London: NHS England; 2013.Mid Staffordshire NHS Foundation Trust Public Inquiry. Report of the Mid StaffordshireNHS Foundation Trust Public Inquiry Executive Summary. Robert Francis QC, Chair. HC947.London: The Stationery Office; 2013.Mind Tools. Root cause analysis: tracing a problem to its origins. Emerald MC 80.htm (cited February 2021).16
The Royal College of Surgeons of EnglandThe RCS of England produces a wide range of standards and guidance to supportthe surgical profession within the areas of team working and leadership, legal andethical concerns, personal development and service improvement. To find out moreabout our work visit www.rcseng.ac.uk/standardsandguidance.The Royal College of Surgeons of England35-43 Lincoln’s Inn FieldsLondon WC2A 3PEThe Royal College of Surgeons of EnglandThe Royal College of Surgeons of England@RCSnewsThe Royal College of Surgeons of England Registered Charity number 212808www.rcseng.ac.uk/standardsandguidance
root cause analysis; driver diagram. better system performance (care) and better professional development (learning)’.5 Root cause analysis When improving standards following an incident, root cause analysis can be used to identify the underlying cause to prevent recurrence. Three basic