Transcription
texascivic health index
a bou t t h e pa rt n er sNat ional Conference on C i t izenshipAt the National Conference on Citizenship (NCoC), we believeeveryone has the power to make a difference in how theircommunity and country thrive.We are a dynamic, non-partisan nonprofit working at the forefrontof our nation’s civic life. We continuously explore what shapestoday’s citizenry, define the evolving role of the individual in ourdemocracy, and uncover ways to motivate greater participation.Through our events, research and reports, NCoC expands ournation’s contemporary understanding of what it means to be acitizen. We seek new ideas and approaches for creating greatercivic health and vitality throughout the United States.Above photo credit: Austin Convention & Visitors BureauRight and center cover photos credit: Daemmrich PhotographyThis report was produced in 2012 and released in 2013.Anne t t e S t r auss Ins t i t ut e for C i v ic L ifeCreated in 2000 to respond to growing political cynicism anddisaffection in the United States, the Institute is named for AnnetteGreenfield Strauss: former Dallas mayor, community leader,and philanthropist. Through nonpartisan research, education,and outreach, the Institute seeks to understand and overcomeobstacles to civic engagement.
ta bl e of con t en t sExecutive Summary. 4Key Findings and Implications. 4Introduction: All Eyes on Texas. 5What Is “Civic Health” and Why Does It Matter for Texas? . 5How to Read this Report . 8Political Participation. 9Civic Involvement and Social Connectedness.14If Everything is Bigger in Texas,Why is Our Civic Engagement So Low?.20What Can Help?.25What Individuals Can Do.28Questions for Further Research.29Conclusion.30A Final Word.31Technical Notes.31A Word About Recommendations .31Endnotes.32Civic Health Index and Partners.34The Annette Strauss Institute forCivic Life sincerely thanks the staffof our national partner, the NationalConference on Citizenship, for theirguidance and support, particularly theirDirector of Community Strategies, KristiTate. We also are indebted to TrevorDiehl for his research assistance, andto the many friends of the Institute whoprovided information and suggestionsfor this report.Authors:Annette Strauss Institute for Civic LifeRegina Lawrence, PhDDeborah Wise, MPAffEmily Einsohn, MPAff and MSWUse your smart phone todownload and learn aboutthe Texas Civic Health Report
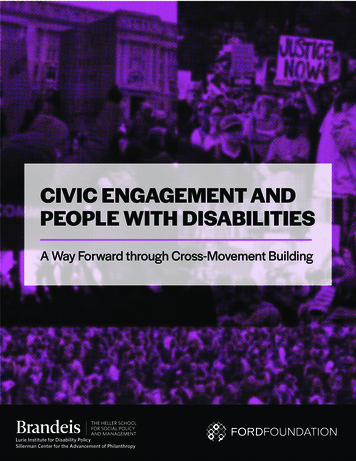
E x ec u t i v e S u m m a ryThe Texas Civic Health Index provides a comprehensive, first-time look at civic and politicalengagement in Texas. It presents information about who engages in their communities and inpolitics across Texas and how. Data reported here are obtained from U.S. Census Bureau CurrentPopulation Survey (CPS) Supplements on Voting, Volunteering and Civic Engagement.Key Findings ates of political participation in Texas are low compared with the rest of the nation.RSince 1972, Texas has consistently lagged well behind national voter turnout in bothmidterm and presidential elections. Texas also ranks among the lowest states in termsof the numbers of its citizens who contact public officials and talk with others aboutpolitics. Participation rates are correlated with income, education, age, race/ethnicity,and citizenship status. ates of civic involvement, such as donating, volunteering, and belonging to groups, areRalso relatively low in Texas, though not as low as rates of political participation. Income,education, age, race/ethnicity, and citizenship status all correlate with civic involvement.Gender matters as well, with women more likely to be civically involved than men. ocial connectedness, a crucial foundation for civic and political participation, showsSboth strengths and weaknesses. Texans help their neighbors by exchanging favors comparatively more than residents of most other states, and this neighborliness is greateramong those in lower socio-economic brackets. Yet Texans trust their neighbors lessthan residents of most other states do. igher levels of education are correlated with higher levels of almost every measure ofHpolitical participation and civic involvement analyzed in this report, signaling the importance of education to developing the resources for people to participate in civic life. ispanic Texans are significantly less likely to participate in almost every form of civicHengagement. The same is true of immigrants—highlighting the importance of efforts tomore fully involve these groups in the civic life of the state.Photo credit: Rice UniversityHigher levels of education arecorrelated with higher levelsof almost every measure ofpolitical participation andcivic involvement analyzed inthis report.Much of the information presented throughout this report leads to a troubling conclusion: Texasranks among the lowest in the nation on many measures of political and civic participation.Low levels of political and civic participation may stem from a variety of causes. Relatively noncompetitive elections; lack of information and education; inconvenience and disenfranchisement;and the challenge of incorporating a rapidly changing population all may be contributing to lackluster civic health in Texas.This report is a starting point. Building better civic health in Texas will require more informationand discussion than is provided here. Everyone who cares about the future of Texas can andshould debate the state’s challenges to civic engagement, how they can be solved, and who isresponsible for solving them. One place to start is by commenting on this report atwww.txcivichealth.org. What do you see here that surprises you? Alarms you? What problemsexist that are not adequately discussed here? What can be done to better engage Texans indemocracy today?4 t e x A s c i v i c h e a lt h i n d e x
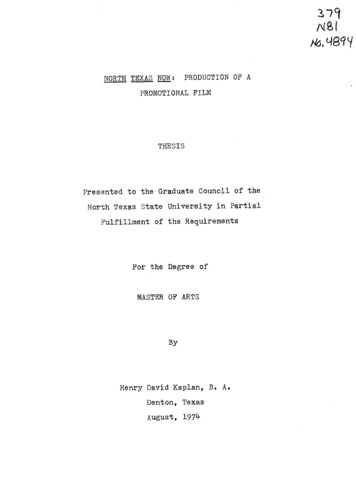
I n t roduc t ion : A l l E y e s on T e x a sNewcomers to Texas—and there are a lot of them these days—may findthemselves being greeted with a song: the University of Texas alma mater,“The Eyes of Texas Are Upon You.” According to legend, the song is meantto inspire UT students toward great accomplishments.These days, it might also be said that the eyes of the nation are upon Texas. Since the 2012 presidential election, the political future of Texas has been a subject of much speculation, given thestate’s potential to influence national politics.Texas is a unique state culturally, politically, and demographically. Among its many attributes, Texas has continued to grow and attract new residents even while most of the country has struggledwith an economic downturn.But while many of the state’s economic indicators are strong, levels of civic and political engagement in Texas are not what they could or should be. The state’s booming economy and populationgrowth are not matched with equally strong levels of citizen participation in politics and civic life.Indeed, Texas may be living with an undiagnosed crisis of civic health.Texas has continued to growand attract new residents,but levels of civic andpolitical engagement inTexas are not what theycould be.What Is “Civic Health” and Why Does It Matter for Texas?Texas’s dynamic growth is bringing challenges, from infrastructure and water to education andimmigration. Meeting these challenges will require the public’s involvement. Expert research andcommon sense both strongly suggest that a society lacking in citizen participation is more proneto inefficiency, corruption, and unresponsive government.1 Indeed, when close to 64% of eligiblecitizens choose to sit on the sidelines—as was the case in Texas during the 2010 midterm election—that inaction allows a minority of citizens to make decisions that affect the majority.This report examines three sets of activities that contribute to the civic health of the state: politicalparticipation, civic involvement, and social connectedness. When citizens participate in politics,they have an opportunity to influence governmental policies and decisions that will affect theirlives. By joining groups, attending community meetings, volunteering and donating, people havean opportunity to directly improve their communities. And research shows that individuals whomaintain strong relationships with their families, friends, and neighbors also participate more incivic life.2 When levels of political participation, civic involvement, and social connectedness arerelatively high, a state enjoys the benefits of civic health.Photo credit: Greater Houston Convention andVisitors BureauThe health metaphor is a useful way of thinking about civic engagement. When the human bodyclimbs a steep stairway or lifts a heavy load, several systems—heart, lungs, muscles—act inconjunction, and only a relatively healthy set of systems will be up to the task. Similarly, when asociety needs to tackle the steep climbs and heavy loads of democratic self-government, healthypolitical, civic, and social “systems” make that activity possible. Like human bodies, societies cansurvive with less than optimal health, but sooner or later, the costs of poor civic health will befelt—in decreased government accountability and increased citizen disaffection.5
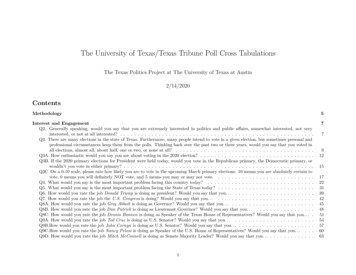
Texas In TransitionTexas is large and diverse. It is the second-largest state in the union, with a population of morethan 26 million.3 That makes Texas home to over 8% of the total U.S. population. Texas is geographically expansive as well, with a total land and water area as large as all of New England, NewYork, Pennsylvania, Ohio, and North Carolina combined.4Texas is also one of the most rapidly growing states in the country: Its population grew by 3.6%between 2010 and 2012 alone.5 Recent projections predict the population will increase to35.8 million people by the year 2040.6 The state capital, Austin, has topped Forbes’s list of thefastest-growing cities in the country for the past two years.7Texas’s booming population is partly due to high rates of immigration into the state.8 The state’sforeign-born population grew by over 90% between 1990 and 2000, and grew again by nearly45% between 2000 and 2011. In 2011, over 16% of the state’s total population was not born inthe U.S., and Texas was home to 10% of all foreign immigrants to the United States.9 The bulk ofTexas’s immigrants are Hispanic.Overall, Texas has been a “minority-majority” state since 2004, meaning that racial and ethnicminority populations, both native- and foreign-born, now collectively outnumber non-HispanicWhites. According to 2010 Census data, just 45.3% of residents identified themselves as White/Non-Hispanic, 37.6% identified as Hispanic (of any race), 11.5% identified as African Americansand 3.8% identified as Asian Americans. More than 9 million Texas residents identify as Hispanic;of those, over 31% are foreign born. Texas is home to nearly one out of every five Hispanics livingin the U.S.10Texas’s population is also relatively young, with 27.3% of residents aged 18 or under, comparedwith 24% for the nation overall. This fact is related to the state’s ethnic composition: The medianage among Texas Hispanics is 26.Texas Racial & Ethnic Composition27.3%of Texas residents are aged18 and younger comparedwith 24% for the nationoverall.11%Black6%Other238%Hispanicor Latino45%White/Non-HispanicSource: Office of the State Demographer, Texas: Overview of Demographic Characteristics and Trends, April /OSD/2012/2012 04 05 State Agency Coordinating Committee.pdf6 t e x A s c i v i c h e a lt h i n d e x
Texas White (non-Hispanic) and Hispanic Populations by Age, 2010250000200000150000100000500000Under1 Year10 Years20 Years30 Years40 YearsHispanic50 Years60 Years70 Years80 Years90 Years100 to104 yearsWhite (Non-Hispanic)Source: US. Census Bureau 2010Political Ideology in Texas, 20129%7%2%8%40%18%Extremely Liberal (2%)Somewhat Liberal (7%)Moderate, Leaning Liberal (9%)Moderate (40%)Moderate, Leaning Conservative (16%)Somewhat conservative (18%)Extremely Conservative (8%)With the nation’s secondlargest economy, Texas’s 2011real GDP growth (3.3%) wasmore than double nationalgrowth (1.5%).16%Source: Texas Politics, Texas Political Culture,http://www.laits.utexas.edu/txp media/html/poll/features/201210 partyid/slide1.htmlWith the nation’s second-largest economy, Texas’s 2011 real GDP growth (3.3%) was more thandouble national growth (1.5%).11 Texas has a business-friendly tax climate12 that has enticed avariety of industries to the state. It also has enjoyed relatively low unemployment rates, with 6.4%unemployment as of October 201213 —which makes Texas 16th in the nation—though levels ofunemployment vary significantly across different areas of the state. The state’s median incomeis estimated to be 50,920 per household, somewhat lower than the U.S. average of 52,762.14At the same time, nearly one in five Texans live below the poverty line.15 Poverty is more prevalentamong racial and ethnic minorities in Texas: 25.5% of Texas’s total population living in povertyself-identify as Hispanic and 23.6% as African American, while non-Hispanic Whites make up8.7% of the total.16 According to the Pew Research Hispanic Center, the poverty rate among TexasHispanics ages 17 and younger is 35%. Relatedly, one in five adult Texans lacks a high schooldiploma.17Texas faces both challenges and opportunities when it comes to civic health. Rapid growth andmultiplying diversity are paving the way for major changes in the Lone Star State. How activelywill Texas citizens participate in determining the state’s future, and how many of them will join in?This report offers a civic health “check-up” for the state of Texas. The findings call for more urgent attention to civic health—to better understand it through further research, and to enhance itthrough individual action and, where appropriate, systemic change.7
How To Read this ReportThe Current Population Survey (CPS)18 poses a large number of questions to respondents in approximately 60,000 households nationwide. From that wealth of data, this report focuses on 1)overall rates of political, civic, and social activities and attitudes that are most conducive to civichealth; 2) trend lines and national comparisons that put this snapshot of Texas into context,and 3) factors that are clearly correlated with political participation, civic involvement, andsocial connectedness, such as income, education, age, race/ethnicity, citizenship status, andgeography.The survey findings reported here, unless otherwise noted, are obtained from the 2011 CPS. Other sources of data that round out the picture of civic health in Texas are credited in the endnotes.The numbers reported here should be considered thoughtfully. Small numeric differences acrossgroups of citizens may not be meaningful either substantively or statistically. For example, onsome indicators of civic health such as voting, there are very small differences between men andwomen that may not be meaningful. And while it can be useful to compare rates of participationin Texas to other states, raw rankings may not be terribly meaningful if the variance across statesis not great. Therefore, we include enough information for the reader to think critically about staterankings.Also, the terminology employed to describe various demographic groups must be consideredcarefully. For example, Texas has a large immigrant population, many but not all of whom identifyas Latino or Hispanic. The term “immigrant” in this report refers to all persons not born in theUnited States regardless of their racial or ethnic identity.GlossaryTexas has a large immigrantpopulation, many but not allof whom identify as Latino orHispanic.Civic health indicators: The civic health of a nation, state, or community can be measured by howmuch and in what ways citizens participate and interact with one another. The three indicators ofcivic health relied on in this report are:Political participation: Self-reported rates of voter registration, voter turnout, contactingpublic officials, and discussing politics.Civic involvement: Activities outside the sphere of government and politics, including donatingto charities, volunteering, and belonging to community organizations.Social connectedness: Frequently interacting with and trusting one’s neighbors and family.Race/ethnicity: This report refers to Texans as they describe themselves in CPS surveys—including White, African American, Asian American, and Latino or Hispanic. Although “Latino” and“Hispanic” are sometimes used interchangeably in the CPS, for the sake of clarity this reportprimarily uses the term “Hispanic.”Immigration: The term “immigrant” refers to anyone not born in the United States (in contrastto “native-born” persons). The Texas population includes a large and increasing number ofimmigrants from many countries. Though the bulk of those immigrants are from Spanish-speakingcountries and may self-identify as Hispanic or Latino, the term “immigrant” is used in this reportto refer to all immigrants, regardless of country of origin.Citizenship status: This report refers to “native-born” U.S. residents versus those who are“naturalized” and thus legally eligible to vote, and “non-citizens” who have not become naturalized.8 t e x A s c i v i c h e a lt h i n d e x
P ol i t ic a l Pa rt ic i pat ionA strong connection with the populace is central to keeping governmentaccountable. We can’t have a truly democratic government without theeager participation of the people. - Governor Rick Perry, February 26, 2013Robust political participation is one fundamental element of civic health. When citizens do notvote regularly, officials may not be held accountable. And if citizens do not convey their concernsto their representatives, those officials cannot fully represent their constituents.Self-reported rates of voter registration, voter turnout, contacting public officials, and discussingpolitics all indicate that levels of political participation in Texas are anemic compared to manyother states—and compared to more ideal levels of participation.Though this is not true of all civic health indicators, political participation is much more likelyamong residents with higher incomes and higher education, and who are older than 30. Race/ethnicity and citizenship status are also correlated with political participation. As political scientists have long noted, racial minorities often have limited access to the resources that facilitateparticipation in politics.19Voter RegistrationRates of voter registration—the necessary prior step to voting—are somewhat lower in Texas thanin the United States overall. In 2010, 61.6% of voting-eligible Texans reported being registered tovote,20 compared with 65.1% of voting-eligible Americans overall, making Texas 42nd in the nation. In 2008, 67.3% of voting eligible Texans reported being registered to vote.Key demographic factors are correlated with being registered, including income and education.Almost three-fourths (71.8%) of Texans with annual family incomes over 75,000 reported beingregistered, compared with only 54.1% of people with family incomes of less than 35,000. Similarly, 74.2% of people with college degrees reported being registered versus 47.9% of those withless than a high school diploma.2161.6%of voting-eligible Texansreported being registeredto vote.Age is also strongly correlated with being registered to vote. Only 43.1% of Texans between theages of 18 and 29 were registered in 2010, compared with 67.4% of those 30 and older.No stark differences exist in the proportion of women and men registered to vote. As a matter offact, women appear to hold a slight edge, with 63.4% of Texas women versus 59.7% of men reporting they were registered to vote in 2010.9
Age and Political Participation in Texas70%67.460%50%Voting rates in Texas havelagged behind the nationalaverage in every presidentialand midterm election yearsince egistration 2010Voter Turnout 2010Contact or Visit a PublicOfficial (2009-2011)18-29 years oldDiscuss Politics(Frequently)6.6Express Opinions onInternet (Frequently)30 years oldRace and ethnicity22 do play a role in political participation in Texas (as they do throughout thecountry). In 2010, 66.9% of Texas’s White/non-Hispanic citizens were registered to vote, compared with 62.2% of African American citizens, 53.3% of Hispanic citizens, and 45.8% of AsianAmericans. In other words, a significant registration drop-off is evident between Whites and otherracial and ethnic groups.Citizenship status obviously determines one’s eligibility to register to vote, since only native-bornor naturalized citizens are legally eligible. But a gap is evident between the native-born and naturalized: 62.6% of native-born citizens in Texas reported being registered to vote—very close tothe state average—whereas only 51.4% of naturalized citizens reported being registered in 2010.2010 voter turnout1ME59.4%Finally, geography appears to play a role. Voter registration in rural areas of Texas, where 65.5%of people report being registered, is somewhat higher than the state average. It is lower in urbanareas, where 58.6% report being registered.Voter TurnoutVoter turnout is low—alarmingly low—among Texans. Though 61.6% of Texans reported beingregistered to vote in 2010, only 36.4% reported voting.23During that midterm election year, Texas was last among the 50 states and Washington D.C. inself-reported rates of voting.24 A recent report based on alternative measures of voter turnout indicates that Texas ranked 48th in the nation in voter turnout for the 2012 presidential election.25NATIONAL45.5%51TX36.4%10 t e x A s c i v i c h e a lt h i n d e xLow voter participation was not unique to 2010. Texas’s voter turnout in 2006, another midtermelection year, was 38.4%, compared with a national voter turnout of 47.8%, which ranked the stateat 49th. In fact, the trend lines show that voting rates in Texas have lagged behind the national average in every presidential and midterm election year since 1972. In 2008, a presidential electionyear with comparatively high levels of turnout nationwide, 56.1% of eligible Texans voted, compared with 63.6% for the U.S. overall. Even in presidential elections that featured an opportunityto vote for fellow Texan George W. Bush, the state’s turnout was lower than the national averageby over 5 percentage points in 2000 and by almost 7 percentage points in 2004.
Voter Turnout 00045.346.1Midterm Turnout 0Income and education are correlated with voting in Texas, as in much of the country. Of those withannual family incomes of greater than 75,000, 46.3% reported voting in 2010, compared with26.7% of those in households earning less than 35,000. Similarly, 52.4% of college graduatesreported voting—well above the state average—compared with 22.8% of those with less than ahigh school diploma. Age is also strongly correlated with voting in Texas. Only 16.1% of those aged18 – 29 reported voting in 2010, versus 42.7% of those 30 and older.Education Levels and Political Participation in 2.820%10.11.8Registration 2010Less than HS Diploma22.019.810%0%Only 16.1% of those aged18–29 reported voting in 2010,versus 42.7% of those 30 andolder.74.270%50%16.1%Voter Turnout 20105.34.8Contact or Visit a PublicOfficial (2009-2011)HS Grad, No College12.78.57.9**Discuss Politics(Frequently)Some College, No DegreeExpress Opinions onInternet (Frequently)College Graduate**No data available11
A significant voting gap is evident between Whites and other Texans, particularly Hispanics: 43.8%of White Texans reported voting in 2010, compared with 38.7% of African Americans and only23.1% of Hispanics.26 A gap between native-born and naturalized citizens is also clear, with 37.1%of native citizens voting in 2010 versus 28.3% of naturalized citizens.Geography does not play as strong a role in voting as it does in registration, but a small differenceis evident between those living in rural areas of the state, who vote at somewhat higher rates(40.2%) than the state average, and urban residents, who vote at somewhat lower rates (34.5%).Community Type and Political Participation in Texas70%60%62.165.558.650%40.240%8.9%Texans say they havecontacted or visited a publicofficial, making Texas 49th inthe nation for this measure ofpolitical participation.34.5 36.030%27.323.620%10%0%7.924.910.1 8.77.07.3**Registration 2010Voter Turnout 2010UrbanContact or Visit a PublicOfficial (2009-2011)SuburbanDiscuss Politics(Frequently)Express Opinions onInternet (Frequently)Rural**No data availableContacting Public OfficialsFew Texans—8.9%—say they have contacted or visited a public official, making Texas 49th in thenation for this measure of political participation. By comparison, the national average in 2011was 12.3%, with Vermont ranking first, at 22.8%.Such low rates of this form of political participation can make it difficult to measure meaningful differences among various demographic groups.27 Even so, the influence of income seemsclear: 15.5% of Texans with family incomes over 75,000 have contacted an official, comparedwith 4.0% of those with family incomes under 35,000. Education again looms large as a factor:19.8% of those with college degrees report having contacted an official—over twice the stateaverage—versus 1.8% of those with only a high school education. Age matters as well: 10.3% ofthose 30 and older have contacted an official, versus only 3.6% of those aged 18–29. In terms ofrace and ethnicity, 13.7% of White/non-Hispanic Texans say they have contacted an official versus5.2% of African American and 3.8% of Hispanic Texans.Discussing Politics and Expressing Opinions OnlineBeyond voting for and talking to officials, political discussion with other citizens is an importantdimension of participation. If people do not talk with one another about political issues, they missthe opportunity to learn others’ views and sharpen their own. In fact, political discussion withinfamilies is an important way that the habits of citizenship are formed. Adolescents who talk frequently about political affairs and current events with their parents score higher on measures ofpolitical knowledge, and when they enter young adulthood, tend to vote, volunteer, and engagein civic activities more frequently than do youth who seldom discuss politics with their parents.28About one-fourth (26.0%) of Texans say they disc
4 texAs civic he Alth index executive summary The Texas Civic Health Index provides a comprehensive, first-time look at civic and political engagement in Texas. It presents information about who engages in their communities and in