Transcription
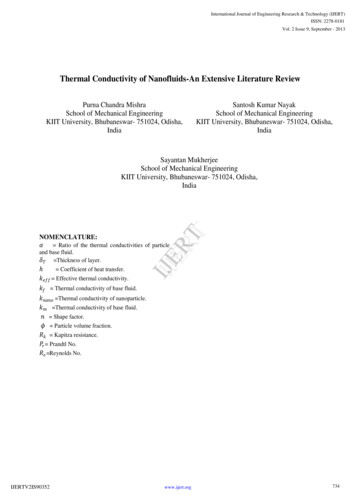
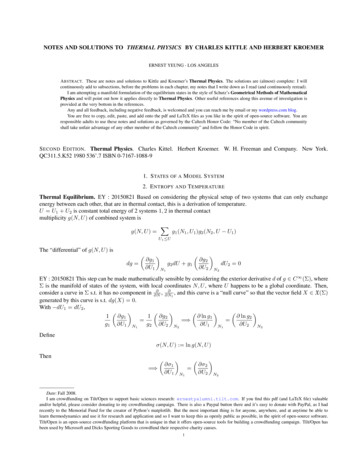
Automatic Generation of 3D Thermal Maps ofBuilding InteriorsOmar Oreifej, PhDJason CramerAvideh Zakhor, PhDABSTRACTMost existing approaches to characterizing thermal properties of buildings and heat emissions from their elements rely on manual inspectionand as such are slow, and labor intensive. This is often a daunting task, which requires several days of on-site inspection. In this paper, we proposea fully automatic approach to construct a 3D thermal point cloud of the building interior reflecting the geometry including walls, floors, andceilings, as well as structures such as furniture, lights, windows, and plug loads. Our approach is based on a wearable ambulatory backpackcomprising multiple sensors such as Light Detection And Ranging (LiDAR) scanners, and Infrared and optical cameras. As the operatorwearing the backpack walks through the building, the LiDAR scans are collected and processed in order to compute the 3D geometry of thebuilding. Furthermore, the Infrared cameras are calibrated intrinsically and extrinsically such that the captured images are registered to thecaptured geometry. Thus, the temperature data in the Infrared images is associated with the geometry resulting in a “thermal 3D point cloud”.The same process can be repeated using optical imagery resulting in a “visible 3D point cloud”. By visualizing the two point clouds simultaneouslyin interactive rendering tools, we can virtually walk through the thermal and optical 3D point clouds, toggle between them, identify and annotate,“hot” regions, objects, plug loads, thermal and moisture leaks, and document their location with fine spatial granularity in the 3D point clouds.INTRODUCTIONRetro-commissioning is the process of identifying low cost or no cost measures to reduce energy consumption inbuildings [1]. It often involves three stages of building inspection, namely, basic evaluation, diagnostic measurement, andadvanced analysis. At each stage, an expert walks through the building and inspects all the areas in order to identify energyleaks and underperforming devices. This includes manually searching for and analyzing all plug loads, lights, and windows.This process requires days of survey, analysis, manual measurements, and benchmark comparisons.LightsLightsTVTVLightsCoffeeMaker(a) 3D Thermal point cloud(b) Interior - ThermalLightsCoffeeMaker(c) Interior - OpticalFigure 1 a) An exterior view for a 3D thermal point cloud. Note how the ceiling lights appear hotter than other regions. (b)Thermal interior views of the model. (c) Optical interior views of the model.The authors are from the Department of Electrical Engineering and Computer Science, University of California, Berkeley, CA. Omar Oreifej isa postdoctoral fellow, Jason Cramer is an undergraduate student, and Avideh Zakhor is a professor.
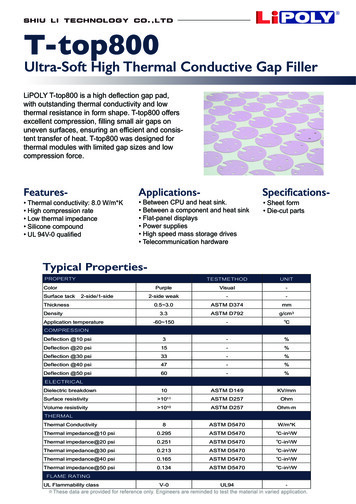
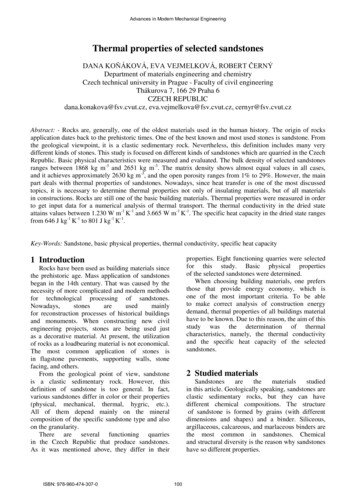
In this paper, we exploit the advances in sensing technology, information theory, and computational algorithms inorder to generate a 3D thermal point cloud of building interior which can potentially be used for building retrocommissioning. An example thermal 3D model generated using our system is shown in Figure 1. The 3D point cloudcontains millions of points, which reflect the geometry of the building in fine detail. The color of each point in the 3Dthermal point cloud is mapped to its temperature, thus providing holistic thermal cues with fine spatial granularity.Moreover, our system captures both color and thermal images and aligns them spatially and temporally, as can be observedin Figure 2.In order to create such models automatically, we use a novel system based on state-of-art sensing technology. Figure3(a) shows the CAD diagram of our system, which we refer to as energy-pack or “e-pack”. As seen in Figure 3(b), in orderto create a thermal point cloud of a building, the e-pack operator wears the backpack and walks through the building at anormal speed e.g. between 0.5 to 1 meter per second. Once the data is collected, it is processed offline and entirelyautomatically in order to generate the 3D path the operator traversed [9,10,11,12,18], the optical 3D point cloud, thethermal/IR point cloud co-registered with the optical point cloud, as well as 3D models with surface reconstruction of wallsand floors nsorLaptopFigure 2: Two examples showing Color-IR pairs ofimages captured by the proposed system. Note the hot(red) objects such as the screens in (a) and the TV in (b).C(a)(b)Figure 3: a) The CAD diagram of the ambulatory e-pack system; (b) ahuman operator carrying the e-pack.As seen in Figure 3(a), there are five 2D laser range scanners, two optical cameras, two infrared cameras, and anorientation sensor. The laser scanners are 40Hz 2D laser scanners with a 30-meter range and a 270 degrees field of view.These scanners are mounted orthogonally to one another. The two optical cameras are equipped with fisheye lenses,resulting in a 180 degrees field of view. The two infrared cameras have 45 degrees field of view and 240 x 320 resolution.The orientation sensor (OS) provides orientation parameters at a rate of 180Hz.Existing systems typically generate 3D models of building exteriors via aerial or ground imagery [2,3,4]. For instanceBing Maps from Microsoft and Google Earth both use aerial imagery to generate 3D models of building exteriors [5,6].Other approaches can model room interiors using a RGBD camera such as Micorosft Kinect [7,17]. However, the limitedfield of view and short range of the RGBD camera does not allow rapid capture of the full detail of a complex 3Denvironment and as such is only applicable to small areas such as a room, rather than an entire multi-story building.Another existing approach to acquiring 3D building models is to mount sensors such as range finders on a cart and push itinside a building. Though such modeling systems can recover the 3D geometry of building interiors, they cannot operate on
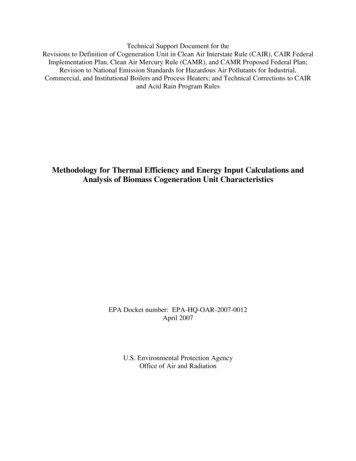
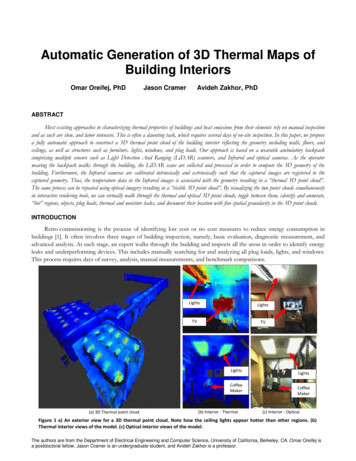
uneven surfaces, and staircases. More importantly, all existing methods texture their models with optical rather than infraredimagery which is crucial for energy analysis.The resulting models from our system can be visualized in interactive rendering tools such as Autodesk Recap [8] tovisualize the building geometry textured by both color and infrared simultaneously. Specifically, we can virtually walkthrough the thermal and optical 3D point clouds, toggle between them, identify and annotate, “hot” regions, objects, plugloads, and thermal and moisture leaks, and document their location with fine spatial granularity in the 3D point clouds forfuture reference. Second, we can extract additional information from the point clouds such as the location and type oflights, the kinds of plug loads and their associated power consumption, and the location and size of windows. The rest ofthe paper is organized as follows: Section two describes the calibration process of the sensors mounted on the e-packsystem. Section three describes the algorithm we used to process the LiDAR data in order to generate the 3D geometry ofthe environment. Section four describes the approach we used to colorize the collected models with thermal and opticaldata. In Section five, we present example thermal models which we collected. Section six discusses tools to visualize,annotate, and measure objects of interest in the model for the purpose of retro-commissioning. Section seven concludes thepaper. Upon acceptance of this paper, we will show a live demo of the e-pack at the conference venue.CAMERA CALIBRATION(a)(b)(c)Figure 4: Our heat calibration board: (a): The front side of the board; (b) The back side of the board. Note how theheater is connected through the orange heating stripes; (c) An infrared image of the board showing acheckerboard calibration pattern.Our e-pack system collects optical, thermal, and geometry data while the operator is walking through the building. Inorder to create a textured 3D model of the building, these three modalities have to be accurately registered, such that amapping is created between the laser points, the pixels of the optical images, and the pixels of the thermal images. Thisrequires recovering the position and orientation of the cameras with respect to the laser scanner, i.e. extrinsic calibration[13,14], as well as recovering the parameters of the camera projection model i.e. intrinsic calibration [13,14]. In this sectionwe discuss the approach we followed for calibration.-Intrinsic Calibration:For intrinsic calibration of the color camera, we used a standard checkerboard approach [13,14], which has beenwidely used in the literature in order to recover the parameters, including the focal length, principal point, and five lensdistortion parameters. However, the standard checkerboard approach is rendered inadequate when calibrating infraredcameras. This is because the checkerboard used in calibration cannot be visible in thermal imagery as its temperature isequal or close to the room's temperature. In order to address this issue, we designed and fabricated a rigid heatcheckerboard for accurate calibration as shown in Figure 4. Our heat checkerboard consists of a metal board with squaresof cloth attached on it which are not in contact with the board. An electric heater is connected to the back of the board viaconducting plates. Once the heater is started, the heat is evenly distributed across the board, and the temperature is raisedup to 45𝑜 . Since the cloth squares are insulated from the board, they do not conduct the heat through, but rather block theradiative heat component from reaching to the infrared camera sensor, thus resulting in thermal images which revealcheckerboard patterns. Figure 4(c) shows an example thermal image of the heat checkerboard. Using this approach, wecaptured 39 images of these patterns at different angles and distances, and used them to calibrate the infrared cameras and
recover their intrinsic parameters using the Caltech calibration toolbox [29]. The final re-projection error for the infraredcamera is 0.5 pixel. Note that this process recovers the intrinsic parameters of the infrared camera lens, and it should not beconfused with thermal camera calibration.-Extrinsic Calibration:The relative position and orientation of all of the mounted sensors, including the LiDAR, optical, and the infraredcameras are specified in the mechanical design CAD drawings at the time the e-pack was being designed. Even though suchmeasurements can be utilized in recovering e-pack pose, generating 3D point clouds and colorizing them, it is necessary toextrinsically calibrate the sensors in order to achieve highly accurate 3D models capturing “reality”. In the rest of thissection we review calibration methods we developed for our sensors.1- Infrared to optical calibration: In order to find the relative translation and rotation between these two sensors, we usethe heat calibration board discussed earlier. The two cameras have overlapping field of views, therefore, we can use PnPalgorithm [22] for calibration. In particular, we assume the board is the reference frame at Z 0 plane, with the top leftcorner being the origin, and we measure the 3D positions of the set of corners on the heat board. Secondly, we captureseveral corresponding pairs of optical-IR images with the heat board visible in both cameras. These pictures are taken atdifferent angles and positions in order to cover all possible views. Consequently, we use a corner detection algorithm [29] todefine the 2D coordinates of the board corners in each image. Therefore, for each image, we obtain a set of corresponding2D and 3D points, on which we run PnP algorithm to recover the relative position and orientation of the camera withrespect to the board. Once the relative rotation and translation between the images and the board are recovered, the relativetranslation and rotation between the optical and IR camera can then be computed for each pair of images. Consequently,we compute a final solution for the relative transformation which is optimal across all the pairs of images by minimizing thetotal error across the pairs in a least-square fashion. This transformation allows us to map points from the infrared imagesto the optical images, and vice versa. We have empirically found the average symmetric transfer error for our system to be1.30 pixels for the infrared, and 4.46 pixels for the optical camera. This error is measured over 31 pairs of images, with 20points in each image.2- Optical to Laser Calibration: The optical camera and the laser sensors have overlapping fields of view and can becalibrated by capturing pairs of laser scans and optical images viewing a calibration board which is detectable in bothmodalities. In particular, we adopt the approach in [23], and collect 30 pairs of overlapping scans and images and identifythe 3D position of the points in each pair. Consequently, the relative position and orientation between the laser frame andcamera frame can be found by minimizing the distance between these points, as described in [23]. After computing the finaltransformation, we can transfer points from the laser scans to the optical images, and vice versa. We have empirically foundthe average error over the 30 pairs of images and scans to be 12.46 mm.CREATING THE BUILDING GEOMETRYIn order to create a 3D model representing the geometry of the building, the collected laser scans have to be aligned.This problem is equivalent to the problem of accurately localizing the e-pack. This is particularly challenging in our scenariobecause of the lack of GPS inside buildings. Additionally, since our e-pack system is strapped to a human, and since humangait consists of six degrees of freedom, we need to recover all six degrees, namely x,y,z, yaw, pitch and roll. This is incontrast with systems on wheels which are designed to operate on planar surfaces with three degrees of freedom namely,x,y, and yaw. In order to handle these challenges, we have developed a variety of Simultaneous Localization and Mapping(SLAM)-based approaches as described in [9,10,11,12,18] to localize the e-pack by recovering its six degrees of freedom,while simultaneously building a map of the 3D geometry of the environment.
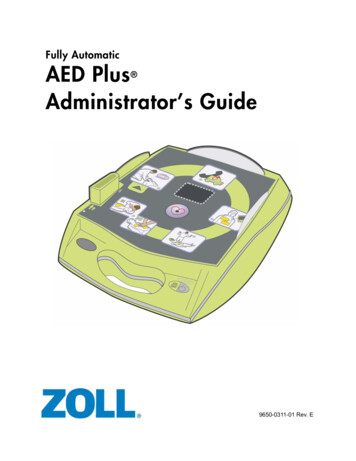
COLORIZING THE 3D BUILDING MODEL WITH OPTICAL AND THERMAL DATAOnce the extrinsic and intrinsic camera parameters are recovered, a point from our 3D model representedas 𝑿 [𝑋, 𝑌, 𝑍]𝑇 can be projected on an image using a perspective camera projection model [30]𝒙 K(R𝐗 𝐭),(1)where R 𝑆𝑂(3) is the camera rotation matrix, 𝐭 ℝ3 is the camera position, K is a 3x3 matrix containing the intrinsiccalibration parameters, and 𝒙 [x, y, s]T is the corresponding homogenous image coordinates. The final image pixelcorresponding to the 3D point 𝑿 is located at coordinates[x/s, y/s]. Note that Equation (2) defines a direct associationbetween the 3D points captured by the e-pack laser scanner, and the pixels of the images captured by the cameras. Whenselecting the color of a 3D point, the captured images are first sorted according to the difference between the time at whichthe image is taken, and the time at which the 3D point was scanned. Therefore, the images are prioritized such that theimage with a smaller time difference is considered first. If the 3D point does not project to a pixel within the limits of theimage, the next image in the priority queue is considered.Since the e-pack is equipped with both color and thermal imagery, we can generate two types of 3D point clouds:optical and thermal. The former uses visible light optical camera, and the latter uses the infrared camera. The thermalimages are mapped to a JET color map, with blue representing the coldest temperature, and red representing the hottest. Incontrast to the optical cameras, the infrared cameras pose significant challenges to this colorization process due to their lowresolution and small field of view. In particular, the resolution of our infrared cameras is only 240x320 with 45𝑜 FOV.Therefore, the resulting thermal models are noisy. In order to improve the quality of the models, we employ twotechniques:1- Space quantization: Due to the low quality of the infrared images, the sensitivity to the errors in calibration is high.For example, neighboring 3D points in the model may falsely project on different objects in the images resulting incolor discrepancy. In order to improve the robustness of the colorization, the 3D space is quantized spatially into afine grid of voxels, with voxel size 25x25𝑥25 mm. We first project all the 3D points within a voxel to the imagesin order to obtain their corresponding thermal color, and then compute the average color for that voxel. Toimplement the space quantization efficiently, we use an Octree structure (OT) [15].2- Image buffering: In order to introduce further smoothness in the model, we enforce the constraint that once animage is selected for colorizing a 3D point, the neighboring 3D points should attempt to obtain their color fromthe same image, unless they no longer project within the borders of the image [28].Using the above approach, we obtain 3D optical and thermal point clouds fully automatically using our e-pack.EXAMPLE THERMAL MODELSWe used the proposed e-pack to construct models for several buildings. Figures 5 and 6 show screenshots captured from amodel of a laboratory area, and a corridor area respectively. In both figures, the left side shows the 3D optical point cloud,and the right side shows the 3D thermal point cloud. Additionally, the top (bottom) images show exterior (interior) views.Note the way hot objects in the model such as windows, lights, and machines are mapped to higher values of the JET colormap i.e. red, while the remaining area is mapped to lower values i.e. blue. Therefore, it is easy to identify such objects usingour model. The acquisition time for this model is about 5 minutes and the automated processing on a typical desktop isabout one hour.VIRTUAL WALKTHROUGH, ASSET TAGGING AND ANNOTATIONSOur proposed e-pack system can potentially be useful in retro-commissioning as demonstrated by the following two
applications we developed.(b) External View – Thermal Model(a) External View – Optical ModelLightLightWindowWindowScreensScreens(c) Interior View – Optical Model(d) Interior View – Thermal ModelFigure 5: The 3D model of a lab area in a building. Top: An exterior view in optical (a) and IR (b). Bottom: An interior view in optical (c)and IR (d). Note how the lights, computer screens, and windows are hot (red) in the IR model.Light(a) External View – Optical Model(b) External View – Thermal ModelLightLight(c) Interior View – Optical Model(d) Interior View – Thermal ModelFigure 6: The 3D model of a corridor in a building. Top: a top view of the model in optical (a) and IR (b). A view from the interior of themodel in optical (c) and IR (d). Note how the lights appear hot in the IR model.
-Walkthroughsand TogglingUsing 3D rendering tools such as Autodesk Recap [8] we can visualize the point clouds and virtually walk throughthe entire building. This can potentially replace the need to physically visit the building multiple times, as in the traditionalretro-commissioning process. Both the thermal and the visible point clouds can be visualized simultaneously as layers. Sincethe two point clouds are calibrated and aligned with respect to each other, the user can toggle between them while virtuallyflying through the building. This allows the user to identify thermal leaks, insulation flaws, moisture issue, decide whether aplug load is on or off, and compare room temperatures.-ObjectAnnotationFor the purpose of retro-commissioning, the user is often interested in documenting the locations and properties ofcertain objects. To this end, we developed an interactive application shown in Figure 7. The floor plan in green has beenobtained via the surface reconstruction algorithm in [7]. The red dot indicates a point in the floor plan clicked by the userand the white triangle connected to the red point indicates the orientation the user is viewing. The resulting optical pictureand the two infrared pictures at that location are shown on the left. One of the infrared pictures corresponds to the rightlooking camera, and the other one to the upward looking one. As the user clicks on the right or left arrow on the keyboard,the red pint in the floor plan moves and the optical and infrared pictures are updated. Thus, as the user virtually walksthrough the floor plan, s/he can navigate the interior of the captured building both optically and thermally. In addition, theuser can click on certain objects to annotate them. In doing so, our application extracts the 3D location of the annotatedobjects and saves them for future reference. Examples of useful objects to annotate for emergency response applicationswould be staircases and emergency exits. For facilities management, this can be used to tag assets. For retro-commissioningapplications, this can be used to tag lights, windows, plug loads or any other objects that are of interest in the energydomain. Finally, since we have reconstructed complete metric 3D models, in essence each pixel in the optical or thermalimage has an associated depth value. As such, it is possible for the user to click on two points and measure the 3D metricdistance between them. Moreover, the user can electronically document the location and type of lights, the kinds of plugloads, and the location and size of windows.CONCLUSIONWe presented a novel system based on state-of-the-art technology to construct 3D point clouds of building interiorsand colorize them with both optical and thermal imagery. The system consists of a backpack comprising multiple sensors,which collect data automatically while an operator is walking through the building. The collected optical and thermal dataare spatially and temporally aligned; therefore, they are particularly useful for retro-commissioning and energy simulationpurposes. Through our system, the user can virtually fly through the model and identify hot spots, thermal leaks, plug loads,windows, and annotate them in fine spatial granularity for future reference.ACKNOWLEDGMENTSThis research is supported in part by the Advanced Research Projects Activity-Energy (ARPA-E). The views andconclusions contained herein are those of the authors and should not be interpreted as necessarily representing the officialpolicies or endorsements, either expressed or implied, of ARPA-E.REFERENCES1.2.Mills, E. Building Commissioning: A Golden Opportunity for Reducing Energy Costs and Greenhouse Gas Emissions.Report prepared for California Energy Commission Public Interest Energy Research (PIER), 2009.C. Frueh, S. Jain, and A. Zakhor, "Data Processing Algorithms for Generating Textured 3D Building Facade Meshes FromLaser Scans and Camera Images", in International Journal of Computer Vision, vol. 61 (2), 2005.
22.23.24.25.26.27.28.29.30.C. Frueh, R. Sammon, and A. Zakhor, "Automated Texture Mapping of 3D City Models With Oblique Aerial Imagery", 2ndInternational Symposium on 3D Data Processing, Visualization, and Transmission (3DPVT), 2004.D. Anguelov, C. Dragomir Dulong, D. Filip, C. Frueh, S. Lafon, R. Lyon, A. Ogale, L. Vincent, J. Weaver, “Google streetview: Capturing the world at street level”, Computer, June 2010, pp. 32 – 38.Google Maps. https://maps.google.com/Microsoft Bing Maps. http://www.bing.com/maps/H. Koppula, A. Anand, T. Joachims, and A. Saxena. Semantic Labeling of 3D Point Clouds for Indoor Scenes. NIPS, 2011.Autodesk Recap: https://www.Autodesk.comT. Liu, M. Carlberg, G. Chen, Jacky Chen, J. Kua, A. Zakhor, "Indoor Localization and Visualization Using a HumanOperated Backpack System." 2010 International Conference on Indoor Positioning and Indoor Navigation, 2010.J. Kua, N. Corso, A. Zakhor, "Automatic Loop Closure Detection Using Multiple Cameras for 3D Indoor Localization."IS&T/SPIE Electronic Imaging 2012, Burlingame, California, January 22-26, 2012.G. Chen, J. Kua, S. Shum, N. Naikal, M. Carlberg, and A. Zakhor. "Indoor Localization Algorithms for a Human-OperatedBackpack System." 3D Data Processing, Visualization, and Transmission 2010, Paris, France, May 2010.N. Naikal, J. Kua, G. Chen, and A. Zakhor. "Image Augmented Laser Scan Matching for Indoor Dead Reckoning."IEEE/RSJ International Conference on Intelligent RObots and Systems (IROS), St. Louis, MO, October 2009.Z. Zhang. "Flexible camera calibration by viewing a plane from unknown orientations." Computer Vision, 1999.P. Sturm & S. Maybank. On plane-based camera calibration: A general algorithm, singularities, applications. CVPR1999.D. Meagher, "High-speed image generation of complex solid objects using octree encoding". USPO. Retrieved in 2012.See, R., Haves, P., Sreekanthan, P., Basarkar, M., O’Donnell, J. and Settlemyre, K. Development of a Comprehensive UserInterface for the EnergyPlus Whole Building Energy Simulation Program. Proc. Building Simulation ’11, 2011.Fallon, M.; Johannsson, H.; Brookshire, J.; Teller, S.; Leonard, J. Sensor Fusion for Flexible Human-Portable Building-ScaleMapping. In Proceedings of the IEEE/RSJ International Conference on Intelligent Robots and Systems, 2012.N. Corso and A. Zakhor, "Indoor Localization Algorithms for an Ambulatory Human Operated 3D Mobile MappingSystem," Remote Sensing 2013, vol. 5, no. 12, pp. 6611-6646, Oct. 2013.Phillips, J.; Liu, R.; Tomasi, C. Outlier Robust ICP for Minimizing Fractional RMSD. In Proceedings of the 3-D DigitalImaging and Modeling, Montreal, QC, Canada, 21–23 August 2007.E. Turner and A. Zakhor, "Floor Plan Generation and Room Labeling of Indoor Environments from Laser Range Data,"GRAPP 2014, Lisbon, Portugal, January 2014.R. Zhang and A. Zakhor, "Automatic Identification of Window Regions on Indoor Point Clouds Using Lasers andCameras," IEEE Winter Conference on Applications of Computer Vision, Steamboat Springs CO, March, 2014.Hesch, Joel A and Roumeliotis, Stergios I, "A direct least-squares (DLS) method for PnP," (ICCV), 2011.Yunsu Bok and Yekeun Jeong and Dong-Geol Choi and In So Kweon, "Capturing village-level heritages with a hand-heldcamera-laser fusion sensor," IJCV 2011.S. Lagüela, J. Arnesto, P. Arias, and A. Zakhor, "Automatic Procedure for the Registration of thermographic Images withPoint Clouds," International Society for Photogrammetry and Remote Sensing (ISPRS), Australia, 2012.V. Sanchez and A. Zakhor, "Planar 3D Modeling of Building Interiors from Point Cloud Data". ICP 2012.E. Turner and A. Zakhor, "Watertight Planar Surface Meshing of Indoor Point-Clouds with Voxel Carving," 3DV 2013.E. Turner and A. Zakhor, "Watertight As-Built Architectural Floor Plans Generated from Laser Range Data," 3DIMPVT 12.P. Cheng, M. Anderson, S. He, and A. Zakhor, "Texture Mapping 3D Planar Models of Indoor Environments with NoisyCamera Poses," SPIE Electronic Imaging Conference 9020, Computational Imaging XII, 2014.Caltech Calibration toolbox. http://www.vision.caltech.edu/bouguetj/calib doc/.R. Hartley and A. Zisserman. Multiple view geometry in computer vision. Cambridge university press, 2003.
order to generate a 3D thermal point cloud of building interior which can potentially be used for building retro-commissioning. An example thermal 3D model generated using our system is shown in Figure 1. The 3D point cloud contains millions of points, which reflect the geometry of the building in fine detail.