Transcription
Published by THE COUNSELORS OF REAL ESTATE Investor Primer:U.S. Data Center MarketBy Chris R. Miers, CRE, and Michael McGowanVolume 42, Number 9August 14, 2018Photo: sdecoret/Shutterstock.comInstitutional investors are increasingly consideringinvesting in a dynamic new property sector – datacenters. Whether viewed as a subset of their industrialor office property allocations, or as new specialtyproperty type, data centers investments can offeran attractive way to participate in the rapid growthof technology.ABOUT THE AUTHORSChris R. Miers, CRE, FRICS,is a Principal at Bard Consulting.Bard Consulting provides strategicreal estate solutions to institutionalinvestors both domestically andinternationally. Chris has a Bachelorof Science from Babson College anda Juris Doctor from Golden Gate University.This article starts with an overview of the market fordata center space in the major metropolitan areas of theUnited States and Canada. We next examine supplyand demand trends for data center space, and theindustries and users that are driving demand. Capitalmarket conditions are then discussed, and we concludewith our thoughts on functional obsolescence and otherrisks posed by investing in this asset type.Michael McGowan has 30 yearsof experience in both public andprivate real estate investing. Hisbackground is in both researchand public real estate and includesa six-year tenure as the portfoliomanager for a global REIT fund.In 2013, Mr. McGowan won the Lipper Award forBest Performing International Real Estate Fund. Hehas a degree in economics from the University ofCalifornia – Berkeley.TERMINOLOGY AND TYPES OF DATACENTERSData center facilities can vary greatly in their physicalattributes, functionality, and economics. Most types ofdata centers can be leased on either a single-tenant basisor to multiple tenants, if the building has been designedto accommodate more than one user. Complicatedinfrastructure requirements (notably power generationand distribution, cooling and fire suppression, andenhanced security) make the construction of multitenant data centers, or the adaptation of existingcre.org/reibuildings into multi-tenant facilities, a very difficult andcostly undertaking.Entire data centers are often leased or owned by large“enterprise” users that need a secure facility entirely fortheir own use. There are a wide-array of companies thatlease such facilities, including internet-based providersof technology, social media or gaming, healthcare service1Volume 24, Number 9
Investor Primer: U.S. Data Center Marketproviders, life insurance and other financial servicecompanies, government or educational institutions,as well as telecommunications and other informationtechnology firms. A typical enterprise-level data centermight have 5 MW of power.It is not uncommon for the improvements paid forby the tenant to cost the same or more than the basebuilding, depending on the size and scope of the datacenter. For example, a private real estate investmentmanager detailed to the authors a series of transactionsin which a major cloud-based data center tenant spentapproximately 30 million to build out its data centerimprovements in each of six data centers that themanager had purchased. These improvements costapproximately 187 per square foot, as compared tothe 154 per square foot that was paid for the basebuildings.Properties that provide data center services to multipleusers include “colocation facilities”, which can leasespace as small as the individual cabinet or rack withina data center room. Some facilities offer wholesalecolocation, which CBRE Research defines as offeringdemised suites that each have greater than 250 kW ofIT power. Other data centers provide retail colocation,in which space within a data center is shared by smallerusers (often divided into cages and cabinets, or dividedracks). Retail colocation centers can also provide the useof other IT hardware or software and services, on a feeor contractual basis.Most leases contain provisions that, upon leasetermination or bankruptcy, these costly improvementseither revert to the ownership of the landlord, or mustbe removed at the tenant’s cost. Tenants are oftenprotected by long lease terms and/or guaranteed renewaloptions, which may contain only minimal annual leaseescalations.Four common types of data centers are describedbelow: (i) base building, (ii) powered base building, (iii)turnkey, and (iv) internet gateway.Powered Base BuildingBase BuildingA hybrid type of data center lease is for a “poweredbase building”, which is a base building for which thelandlord has installed the necessary primary powerupgrades as part of its investment. Such a facilityis usually described by its power capacity in termsof kilowatts (kW) or megawatts (MW). Typicaldata centers range from roughly 2 MW to 15 MW.However, some new “hyperscale” facilities built for userslike Google, Amazon, Facebook, or Microsoft can offerover 100 MW of power. Note that most data centersare not particularly large in terms of square footage.Based upon our examination of the property holdingsof several large data center REITs, they often rangefrom only 50,000 to 100,000 square feet. Real EstateInvestments Trusts (REITs) that invest in data centersare described in more detail later in this piece.A “base building” data center is essentially an improvedindustrial or office building which is leased to a datacenter operator that incorporates its own specializedimprovements. The base building needs to have certainphysical attributes that are not common to all officeor industrial buildings, such as above-standard loadbearing floors, greater ceiling heights, proximity toample electrical power supplies, and connectivity tofiber, cable and other telecommunication networks.Rental terms for a base building data center are usuallyat the lower-end of the data center spectrum, as thetenant directly bears the largest portion of costs.In the case of a base building data center lease, thetenant is responsible for upgrading the facility withextensive capital improvements, which generally willinclude additional power generation facilities, backupgenerators and batteries, extensive and sophisticatedcooling, ventilation, and fire suppression systems,telecommunication switching gear, extensive arrays ofracks and servers, and enhanced security features.cre.org/reiTurnkeyA “turnkey” data center is a property for which thelandlord has borne the cost of most or all the manyimprovements outlined above. The rental rate paid bythe tenant is much higher in this case, as the landlordhas borne the costs and risks associated with the2Volume 42, Number 9
Investor Primer: U.S. Data Center Marketinfrastructure upgrades. There is a very wide range ofcosts, as no data centers are exactly alike. For example,while the construction cost of powered base buildingsmay range from 200 to 450 per square foot, turnkeydata centers are reported to cost from 800 to 1,200per square foot, or more, to build. Turnkey datacenters could pose a higher level of risk to institutionalinvestors than powered base buildings, as the specializedimprovements have a higher risk of functionalobsolescence.point, approximately 70% of global internet trafficwas thought to pass through MAE-East. Over time,many additional exchanges were added in marketsthroughout the country. While the four NAPS are stillvery important, they are now part of a wider number ofInternet exchanges points, or IXPs, that allow networksto connect directly. Proximity to IXPs remain animportant draw to data center users.As the data center industry has grown and matured,locational decision-making factors have expanded,including:Internet Gateways“Internet gateway” data centers differ greatly from thetypical data centers. Also known as “carrier hotels”,these properties are single buildings that are served bymultiple fiber providers. Space within internet gatewaydata centers is often leased to retail colocation providers. Availability and pricing of reliable electrical power. Proximity to multiple providers of fiber optic services(measured by “latency” – the time delay intransmission). Extensive fiber lines from multipleproviders provides redundancy, low latency, andbetter pricing. Proximity to large customers, such as technology,financial services, media and entertainment, andhealthcare companies, as well as government andeducational users. Proximity to human population clusters. With therise of consumer internet use, reducing the latencyof streaming services means being closer to humanpopulation clusters is also an important factor.LOCATION FACTORSSince their introduction in the 1990s, data centershave most frequently been located close to existingfiber, cable, or other telecommunication lines that theirtenants or owners needed to access. Today, most of theinternet’s traffic flows through fiber optic lines due totheir ability to offer the greatest speeds and bandwidth.Historically, many of the predecessor cable lines werelocated within railway easements in the United States,while undersea cable had entry nodes in a handfulof coastal cities. The confluence of transcontinentaland regional fiber lines and cable entry points to largecenters of technology and business resulted in areassuch as Northern Virginia, New York/New Jersey, andNorthern California being chosen as the sites for muchof the data center industry’s early growth.EXISTING INVENTORYEstimates of the size of the data center market varygreatly. Some reports indicate that there are over 3million data centers in the United States – but figureson this scale include the server rooms that havetraditionally been operated by internal IT teams withinoffice space leased or owned by a given company. Ourreport focuses on purpose-built data center buildingsthat are owned or operated by professional data centeroperators.Another important factor in the early growth of datacenter hubs was the formation of Network AccessPoints (NAPs) in the 1990s. Internet service providersconnected with each other through the NAPs to forma public network exchange. The first four NAPswere located in (i) Northern Virginia (called MAEEast), (ii) Northern New Jersey, (iii) Chicago, Illinois,and (iv) San Jose, California (MAE-West). At onecre.org/reiUnlike traditional real estate sectors, whichusually measure the existing inventory of buildingsin terms of either physical size or leasable area,the discussion of data centers focuses more commonly3Volume 42, Number 9
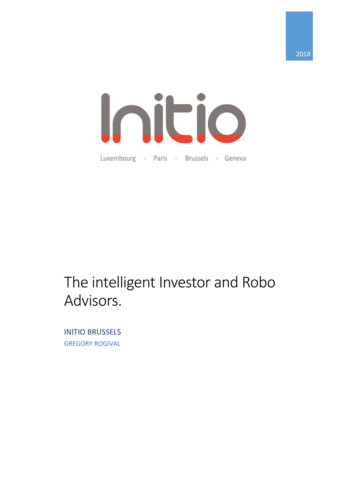
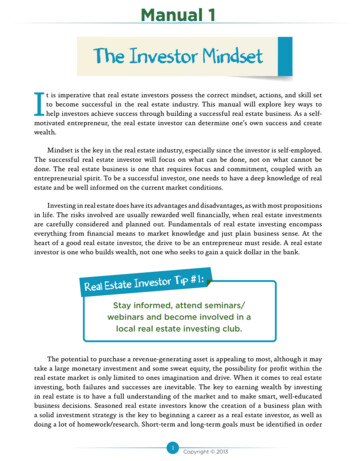
Investor Primer: U.S. Data Center Marketon electrical power supply available. This is measuredin megawatts (MW), or, for smaller buildings andindividual suites or leases, kilowatts (kW).NORTH AMERICAN DATA CENTER MARKETSOF PARTICULAR NOTE1. Northern Virginia is perhaps the leading locationfor data centers. It is by far the largest market, asmeasured by installed IT power, at853 MW as of mid-year 2017 (see Exhibit A).The market gained early prominence due tothe US Government’s use of fiber optic networksas early as the 1960s, as well as the need forgovernment-related entities or contractors to storetheir data securely. As the location of the mostimportant NAP (discussed above), NorthernVirginia became home to many of the early telecomand internet service providers, including AOL,UUNet, and MCI.The existing inventory of the most important datacenter markets in the United States and Canadais shown in Exhibit A. These markets, combined,represent existing inventory of powered data centerspace of 4.6 gigawatts, which is equal to 4,624 MW.This data comprises most of the total data centermarket in major metropolitan areas of the United Statesand Canada; it does not capture many of the largedatacenters built by firms like Apple and Google inrural locations. Exhibit A also provides information onmetropolitan vacancy rates and recent levels of demand(net absorption), which is discussed below.Exhibit A: Trends in North American Data Center Markets As of Mid-Year 2017Inventory(MW) (1)Vacancy(MW) (1)Vacancy Rate2016 NetAbsorption(MW) (1)1H17 NetAbsorption(MW) (1)Atlanta2073315.9%78Austin and San Antonio951010.3%1121Metropolitan AreaBoston1601610.0%23Chicago (2)502306.0%5624Colorado1282821.9%23Dallas/Ft. Worth4585612.2%3627Houston1201814.9%51Los 5635.7%719New Jersey327309.2%52New York City1641911.6%51Northern California424235.4%593Northern Virginia8539110.7%11341Pacific .3%14144,62460613.1%396218TorontoTotalNotes:(1) Investory, vacancy, and net absorption figures are quotes in megawatts (MW).(2) Chicago inventory is as of year-end 2016.Sources: JLL Research and Bard Consulting, LLCcre.org/rei4Volume 42, Number 9
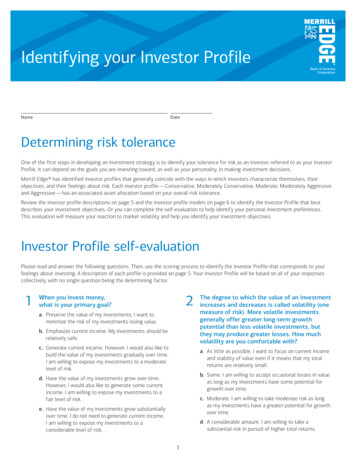
Investor Primer: U.S. Data Center MarketSeveral locations in Northern Virginia have beenbroadly supportive of working with the industryto provide the power needed for large scale datacenter construction; notably cities within LoudonCounty and Prince George County, as well as thecity of Manassas. This supportive environment,however, leads Northern Virginia to have thehighest absolute level of total new supply underwayor planned, as discussed further below.are paid to the landlord) and average power costs(which are paid to the local utility company).We present this information to give the reader anidea of the relative costs of running a data center invarious metropolitan areas. Northern Virginia ranksvery favorably on both metrics.2. Chicago is North America’s second largest datacenter market, with over 500 MW of existinginventory. It is a favored network hub locationdue to (i) its early status as the site of the ChicagoNAP, (ii) its central location in the US, (iii) theproximity it has too many large corporate users,(iii) the availability of ample land in its far-reachingsuburbs, and (iv) attractively-priced power.Another factor that boosts Northern Virginia’sattractiveness to data center users is that it offersattractive economics versus other coastal datacenter markets. Exhibit B provides a study bymetropolitan area of average rental rates (whichExhibit B: Data Center Operating Cost Measures As of Mid-Year 2017Rental Rate under 250 kW (1)Rental Rate over 250 kW (2)Average Power Rate (3)AtlantaMetropolitan Area 225 - 325/kW 130 - 155/kW E4.8c / kWhAustin & San Antonio 220 - 290/kW 110 - 130/kW E7.4c / kWhBoston 275 - 775/kW 115- 200/kW E16.0c / kWhChicago 230 - 325/kW 135- 145/kW E6.0c / kWhColorado 180 - 250/kW 135- 160/kW7.1c / kWhDallas/Ft. Worth 225 - 300/kW 115- 130/kW E4.5c / kWhHouston 220 - 290/kW 95- 120/kW E6.5c / kWhLos Angeles 250 - 300/kW 90- 130/kW E14.5c / kWhMontréal 250 - 460/kW 140- 220/kW E4.0c / kWhNevada 250 - 350/kW E 135- 180/kW E9.2c / kWh 250 - 300/kW 125- 250/kW E8.5c / kWhNew York City 300 - 700/kW E 250- 500/kW E14.4c / kWhNorthern California 150 - 200/kW E 125- 150/kW E13.4c / kWhNorthern Virginia 140 - 160/kW E 100- 130/kW E5.2c / kWhPacific Northwest 135 - 150/kW E 115- 145/kW E4.3c / kWhPhoenix 260 - 350/kW 120- 160/kW E6.4c / kWhToronto 200 - 700/kW 150- 190/kW E11.2c / kWhNew JerseyNotes:(1) Rental rate ranges for smaller power requirements are presented on an “all-in” basis, except those denoted “ E”, which are“plus electricity”.(2) Rental rate ranges for larger power requirements are presented on an “plus electricity” basis, unless noted otherwise.(3) Power rates are presented in cents per kilowatt hour (cents/kWh).Sources: JLL Research and Bard Consulting, LLCcre.org/rei5Volume 42, Number 9
Investor Primer: U.S. Data Center Market3. Dallas/Ft. Worth ranks as the third-largest NorthAmerican data center market, with 458 MW.Although not home to one of the four originalNAPs, the northeast Dallas suburb of Richardsonhas a long history of technology, as it is theheadquarters of Texas Instruments. The availabilityof land, low cost power, and a central location areimportant drivers of demand.One interesting trend that most sources informationabout the data center market fail to quantify is thegrowth in rural, or remote, data centers. Rural datacenters are attractive to these large users because oflow costs – and they are made even lower after theuser receives tax incentives from the state and localgovernments as an inducement to build the datacenters and bring some jobs to the local community.Power costs are also usually attractive in the locationschosen, and land can be acquired for a fraction of thecost of more traditional office or industrial buildinglocations. Some of the better-known examples in theUnited States are huge data centers that were built forconsumer electronics or social media giants:4. Northern California is home to one of the world’slargest clusters of high technology companies,so it is not a surprise that it features among thelargest data center markets, with 424 MW. Hometo MAE-West, one of the original NAPS, in SanJose, the market must overcome hurdles such asexpensive rents, high power costs, and older spaceinventory, and a lack of readily available land. Butmany of the tech giants located nearby are willingto pay the price for access to a nearby data center.5. The Pacific Northwest market includes Seattle,Portland and also rural locations such as Quincy,a small town dominated by large data centers.Together, these areas have an existing inventory of350 MW. Urban data centers in Seattle have longbeen attractive to local tech firms like Microsoftand Amazon, but the availability of cheaper powerand lower construction costs have boosted largescale data center developments in rural areas as well.6. New Jersey is the sixth-largest data center marketin North American, with 327 MW. User demandin the market has historically been driven by thelarge New York-based banks and financial servicesfirms – especially those that sought disasterrecovery and back-up facilities within reach of theiremployees but far enough away to provide a degreeof separation. Most of the inventory is situatedin former industrial buildings in the northernNew Jersey cities close to Manhattan, althoughPennsauken (home to one of the four originalNAPs), is actually a suburb of Philadelphia.cre.org/rei6 Apple purchased 183 acres in Maiden, NorthCarolina, where it has constructed a 505,000 squarefoot data center and has plans to start a matchingfacility; costs at full build of the campus may reach 1 billion. Facebook is starting a fourth data centerin Altoona, Iowa; this will bring the size ofa campus it is constructing to 2.5 millionsquare feet. Both Apple and Facebook have large datacenters in Prineville, Oregon (population 3,500).Facebook has completed two data centers inPrineville and is starting a third; it has reportedlyspent over 800 million on construction of thesefacilities since 2010. In August 2017, Apple announced it may spendas much as 1.4 billion to build a new data centercampus in Waukee, Iowa. State and local authoritieshave approved 208 million in tax breaks in anattempt to lure Apple. Wind-generated power alsohelps keep costs low, and Iowa is viewed as havingrelatively few natural disasters that could interferewith data center operations. Apple joins Facebookand Microsoft in choosing to locate hyperscale datacenters in the greater Des Moines area.Volume 42, Number 9
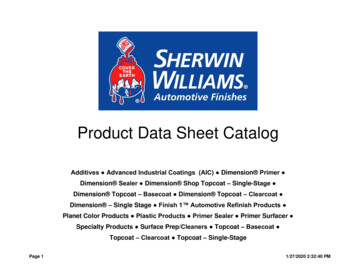
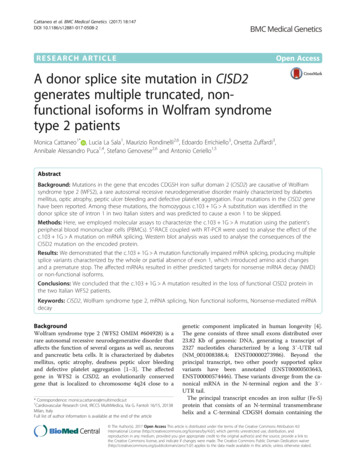
Investor Primer: U.S. Data Center MarketDATA CENTER DEMAND TRENDSBig Data from New TechnologiesGlobal Data Center TrafficRelatively new technologies that are not yet widelyadapted are expected to generate vast amounts of dataon a daily basis. These technologies include selfdriving vehicles, the internet-of-things (IoT), and otherso-called “smart” devices, machines, and buildings.While not all of this daily data needs to be stored, it isexpected to generate much of the growth in data centertraffic in coming years.The increasing adoption of cloud-based services acrossmany segments of business and personal life has fueleda boom in demand for the services provided by datacenters. Most of the information or data passingthrough the internet originates or terminates at a datacenter – and is termed “traffic”. A widely cited whitepaper published in late 2016, the Cisco Global CloudIndex Forecast and Methodology 2015-2020, projectsthat global data center-IP (internet) traffic will growfrom 4.7 zettabytes per year in 2015 to 15.3 zettabytesin 2020 – a 27% compounded annual growth rate.For perspective, some high-end desktop computersoffer one terabyte hard drives; a zettabyte equals onebillion terabytes!Industries Driving Data Center SpaceJLL has analyzed demand patterns based on actual netabsorption of data center space. During the first sixmonths of 2017, cloud-based users accounted for thelargest share of leasing activity in 12 of the 17 mostimportant data center markets in North America. Inaddition to cloud users, other industries that accountedfor high proportion of demand included technologyfirms, entertainment and media companies, financialservices, healthcare, and telecom.Cisco’s study also projects that more and more datawill transition to the cloud. In fact, it expects thatglobal cloud traffic will represent 92% of all data centerworkloads by 2020, as shown in Exhibit C.Installed Workloads in MillionsExhibit C: Projected Data Center Workload Growth by 20208%10%12%15%92%19%88%25%75%81%90%85%Source: Cisco Global Count Index, 2015-2020cre.org/rei7Volume 42, Number 9
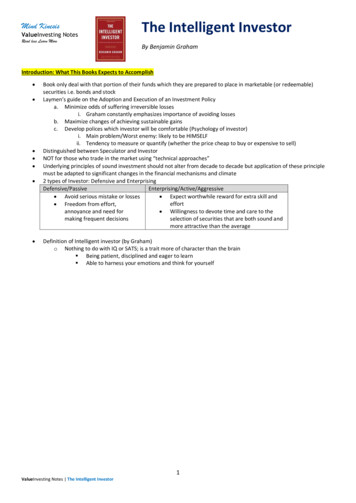
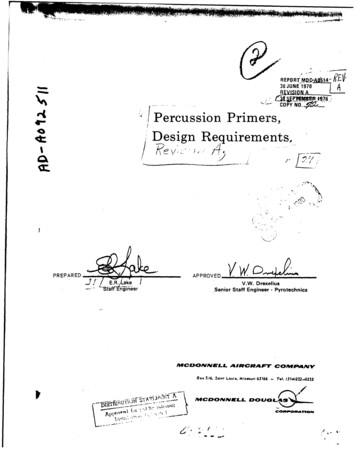
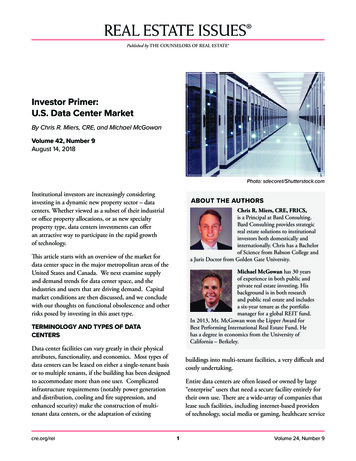
Investor Primer: U.S. Data Center MarketDuring 2016, large users such as Amazon Web Services(AWS), Google, Microsoft Azure, and Oracle tookmassive amounts of space in markets across the country.Many of these facilities are what is termed “hyperscaledata centers”, which are large, scalable data centersthat offer cloud services to other businesses – that is,they offer “public cloud” hosting. Cisco identifies24 hyperscale cloud operators, including companieslike Apple, Amazon, Facebook, Microsoft, Google,Yahoo, eBay, Alibaba, Salesforce, and ADP. Thisgroup operated 259 hyperscale data centers at year-end2015, which represented 21% of installed data centersworldwide. Cisco predicts that hyperscale data centerswill continue to see rapid growth and will control86% of public cloud workloads by 2020. See Exhibit Dfor Cisco’s hyperscale projections.DATA CENTER DEMANDDemand for data centers has fueled high levels of netabsorption. During 2016, a total of 396 MW of datacenter space was absorbed, in one of the most activeleasing years on record. This is relatively high rate ofnet absorption, relative to the current inventory ofabout 4,624 MW. See Exhibit A, above, for details onnet absorption by major metropolitan area.Trends driving the signing of new leases (orconstruction of new user facilities) include the ongoingbusiness consolidation of the data center users (bothtenants and owners) and the consolidation of individualusers looking to move from smaller to larger datacenters. Additionally, many corporate or “enterprise”users have been moving their data center operations– relocating from self-owned data centers intoprofessionally-managed colocation facilities or thirdparty cloud data centers.The high level of tenant activity seen in 2016continued during the first six months of 2017, withanother 218 MW of space absorbed. JLL expects thatstrong demand will continue, but that it may soften fora period as these large spaces requirements are absorbedand utilized.Exhibit D: Projected Growth of Hyperscale Data CentersSource: Ciscocre.org/rei8Volume 42, Number 9
Investor Primer: U.S. Data Center MarketNEW CONSTRUCTION UNDERWAYOR PLANNEDanother 172 MW is planned. Northern Virginia isthe largest data center market in North America andis an important base for hyperscale cloud providerssuch as AWS and Microsoft. Nonetheless, this level offuture supply could pose some risks to the market, asit represents a potential increase of 42% in the existinginventory of 853 MW.Robust levels of new data center construction areunderway across North America, in response tovery healthy levels of demand during 2016 andexpectations for continued robust growth. As of June30, 2017, there was 535 MW of data center currentlyunder construction within the 17 North Americandata center markets tracked by JLL, as shown inExhibit E. Another 1,123 MW of data centers wasplanned in these markets. In total, 1.658 gigawatts ofpotential new supply were either under construction orplanned, representing 36% of the existing inventory.On a relative basis (comparing the total of newconstruction underway and planned construction toexisting inventory) very high levels of new supply arealso seen in Houston, Austin, San Antonio, Phoenixand Nevada. Other areas with high levels of newsupply, but on a larger existing base, are Dallas/Ft.Worth and New Jersey.The largest level of potential new supply is in NorthernVirginia, where 190 MW of space is underway, andExhibit E: New Construction in North American Data Centers Markets As of Mid-Year 2017Metropolitan Area(1)ExistingInventory (MW)(2)Under Construction(MW)Planned Construction(MW)(3)Total Supply(MW)Total Supply as% of 8113%Houston1202788066%Austin & San 051%Northern Virginia85319017236242%New Jersey327311611936%Dallas/Ft. Worth458487612427%New York 120%Northern California42430467618%Pacific Northwest3503545716%Los 4,6245351,1231,65836%Total of MarketsNotes:(1) Metropolitan areas are ranked by Total Supply as Percent of Inventory.(2) Inventory, vacancy, and net absorption figures are quoted in megawatts (MW).(3) Planned construction is often a volatile data set because of its speculative nature.Sources: JLL Research and Bard Consulting, LLCcre.org/rei9Volume 42, Number 9
Investor Primer: U.S. Data Center Marketmerger with what was another large data centerREIT, DuPont Fabros Technology, Inc. Prior tothe merger, DuPont Fabros owned only 12 datacenters, but they are large scale facilities, with atotal of 305 MW, and a concentration of facilitiesin Northern Virginia. Post-merger, Digital nowowns 88% of its 157 global data centers. Digitalhas 13 active development projects underway,including projects in Northern Virginia, Dallas/Ft. Worth, Miami, Northern California, andseveral international locations, in addition to fivedevelopment projects it gained from the merger.Metropolitan areas in California, the Pacific Northwest,and Boston, on the other hand, are expected to seerelatively low levels of total new supply. This is notwholly unexpected, given traditional difficulties inbuilding office or industrial space in these areas.However, it is surprising to see Atlanta includedin this group.CAPITAL MARKETSIn recent years, two forces have dominated thetransaction market for data centers: (i) the growth ofdata center real estate investment trust (REITs), and(ii) corporate merger and acquisition activity. Theseforces are intertwined, as many of the mergers have alsoinvolved REITs. Switch, Inc. (NYSE: SWCH, 9.1 billion marketcapitalization). Switch is the most recent exampleof a data center developer deciding to go publicand utilizing a REIT structure. Switch was foundedin 2000, but completed its initial public offering(IPO) in October 2017. Switch and its founder,Rob Roy, hold more than 350 patents relating todata center design and construction, and claim tohave the world’s most advanced data centers, whichthey call “Tier 5”. Switch started with its CoreCampus in Las Vegas, which comprises two millionsquare feet and offers 315 MW of power. Its Renoarea Citadel Campus is planned to encompass eightdata center buildings totaling 7.3 million SF andoffering 650 MW in total. This campus is expectedto be the largest data center, globally, uponcompletion of build-out, and offers connections tothe more-expensive Northern California market.Switch is planning similar large facilities in Georgiaand Michigan. CyrusOne, Inc. (NYSE: CONE, 5.6 billionmarket capitalization). CyrusOne operates 35 datacenters globally, with the majority of its revenuesderived from data centers in Dallas/Ft. Worth,Houston, Northern Virginia, Cincinnati, andPhoenix. It also has 88 MW of new developmentsunderway in Northern Virginia, San Antonio,Chicago, and Phoenix. It recently closed on twolarge land purchases for future developments: 48acres in Quincy, Washington and 66 acres in theDallas/Ft. Worth metropolitan area.Overview of Data Center REITsIn recent years, mergers and acquisitions have helpedfuel the rapid growth of global data center operators.Many of the largest operate as REITs, including thefollowing companies: Equinix (NYSE: EQIX, 36.1 billion marketcapitalization) is the world’s largest provider ofdata center space and services. It only owned31% of its 179 data centers, as of March 31,2017, – the rest being retail data centers itoperates as a tenant, under colocation orinterconnection business models. In fact,Equinix is one of the largest tenants of DigitalRealty Trust (which is described below). Digital Realty Trust (NYSE: DLR, 25.0 billionmarket capitalization) owned 145 properties(mostly data centers) totaling23.4 million square feet, as of June 30, 2017.Digital became a public REIT in November2004 and has grown rapidly through acquisitionof individual data centers, the construction ofspeculative and build-to-suit data centers, andby buying other data center operators. Digitalhistorically had a focus on wholesale data centeroperations, but in recent years it boosted itscolocation facilities, notably through the additionof Telx’s properties. Digital recently completed acre.org/rei10Volume 42, Number 9
Investor Primer: U.S. Data Center Market CoreSite Realty (NYSE: COR, 3.8 billion marketcapitalization) was initially formed in 2001 asCRG West, a portfolio formed by Carlyle Group.It became a public company in 2010, and CarlyleGroup remai
Aug 14, 2018 · U.S. Data Center Market. By Chris R. Miers, CRE, and Michael McGowan. Volume 42, Number 9. August 14, 2018. Photo: sdecoret/Shutterstock.com. Chris R. Miers, CRE, FRICS, is a Principal at Bard Consulting. Bard Consulting provides strategic real estate solutions to institutional investors bo