Transcription
CIMA OfficialLearning SystemRelevant forComputer-Based AssessmentsC3 – Fundamentalsof BusinessMathematicsCIMA Certificate inBusiness AccountingGraham Eaton
CIMA Publishing is an imprint of ElsevierLinacre House, Jordan Hill, Oxford OX2 8DP, UK30 Corporate Drive, Suite 400, Burlington, MA 01803, USAFirst edition 2008Copyright 2009 Elsevier Ltd. All rights reservedNo part of this publication may be reproduced, stored in a retrieval systemor transmitted in any form or by any means electronic, mechanical, photocopying,recording or otherwise without the prior written permission of the publisherPermissions may be sought directly from Elsevier’s Science & Technology RightsDepartment in Oxford, UK: phone ( 44) (0) 1865 843830; fax ( 44) (0) 1865 853333;e-mail: permissions@elsevier.com. Alternatively you can visit the Science and Technology Bookswebsite at www.elsevierdirect.com/rights for further informationNoticeNo responsibility is assumed by the publisher for any injury and/or damage to personsor property as a matter of products liability, negligence or otherwise, or from any useor operation of any methods, products, instructions or ideas contained in the material herein.British Library Cataloguing in Publication DataA catalogue record for this book is available from the British LibraryLibrary of Congress Cataloguing in Publication DataA catalogue record for this book is available from the Library of Congress978-1-85617-783-2For information on all CIMA publications visitour website at www.elsevierdirect.comTypeset by Macmillan Publishing Solutions(www.macmillansolutions.com)Printed and bound in Italy09 10 1111 10 9 8 7 6 5 4 3 2 1
ContentsThe CIMA Learning systemHow to use your CIMA Learning SystemStudy techniqueComputer-Based AssessmentsFundamentals of Business Mathematics and Computer-Based AssessmentsLearning outcomes and indicative syllabus contentMathematical Tables1Basic 1.131.141.151.161.17Learning OutcomesIntroductionMathematical operations and bracketsDifferent types of numbersRounding1.4.1 Rounding to the nearest whole number1.4.2 Significant figures1.4.3 Decimal places1.4.4 Rounding up or rounding downPowers and roots1.5.1 DefinitionsMathematical operations in Excel1.6.1 Rounding numbers in ExcelVariables and functionsFormulaeExponential numbersSolving equations1.10.1 Linear equations with only one variable1.10.2 Quadratic equations with only one variable1.10.3 Simultaneous linear equationsManipulating inequalitiesPercentages and ratiosAccuracy and approximationErrors from roundingUsing Excel to produce graphs of Linear and Quadratic Equations1.15.1 Producing a single linear equation in Excel1.15.2 Drawing multiple equations on a single graph1.15.3 Single quadratic equation1.15.4 Two quadratic equations on one graphUsing Excel to produce the graph of a hyperbolaSummaryRevision QuestionsSolutions to Revision 31414151618192021212122232425262733
ivFUNDAMENTALS OF BUSINESS MATHEMATICS C3CONTENTS2Obtaining DataLearning Outcomes2.1 Introduction2.1.1 The difference between information and data2.2 Primary data: sampling2.3 Probability sampling methods2.3.1 Simple random sampling2.3.2 Stratified random sampling2.4 Other sampling methods2.5 Multistage sampling2.6 Secondary data: sources2.7 Questionnaires2.8 Contact with respondents2.9 Importing data to Excel2.9.1 Importing data from Word2.9.2 Using the Excel Text to Columns feature2.10 SummaryRevision QuestionsSolutions to Revision Questions3Presentation of 4Learning OutcomesIntroductionLinear graphsSolving simultaneous linear equations using graphsQuadratic graphsTallying frequency distributionsDiscrete and continuous variablesCumulative frequency distributionHistograms and ogivesPie chartsBar charts3.10.1 Creating Bar charts using ExcelTabulationPareto analysis – The 80-20 ruleUsing spreadsheets to produce histograms, ogives and pie charts3.13.1 Creating a histogram in Excel3.13.2 Creating an ogive in Excel3.13.3 Creating a Pie chart in ExcelSummaryReadingsRevision QuestionsSolutions to Revision 5656570717275767885879095969898101102103105109117
52153153155157161162165169179CONTENTS4FUNDAMENTALS OF BUSINESS MATHEMATICSDescriptive .134.144.154.16Learning OutcomesIntroductionThe arithmetic meanThe medianThe modeA comparison of the three averagesMeasures of spreadThe rangeThe interquartile range; the quartile deviationDecilesThe mean absolute deviationThe standard deviationThe coefficient of variationA comparison of the measures of spreadDescriptive statistics using ExcelA practical example of descriptive statistical analysis using Excel4.15.1 The questionnaire4.15.2 Data capture4.15.3 Preliminary analysis4.15.4 Descriptive statistics4.15.5 Worked Example ConclusionsSummaryReadingsRevision QuestionsSolutions to Revision Questions5 Index 5.145.15Learning OutcomesIntroductionDefinitionsInterpretation of index numbersChoice of base yearChange of base yearCombining series of index numbersChain-base index numbersComposite index numbersRelative price indicesAggregative price indicesChoice of base weighting or current weightingQuantity indicesThe construction of the UK retail price indexUsing the RPISummaryReadingsRevision QuestionsSolutions to Revision 0202202206207209217
viFUNDAMENTALS OF BUSINESS MATHEMATICS C3CONTENTS6Financial 6.136.146.156.16Learning OutcomesIntroductionSimple interestCompound interestEquivalent rates of interestDepreciationMore complex investmentsGeometric progressionsPresent valuesNet present values – practical examplesProblems using NPV in practiceAnnuitiesPV of a perpetuityLoans and mortgagesInternal rate of returnFinancial functions in Excel6.15.1 The investment reportsSummaryReadingsRevision QuestionsSolutions to Revision Questions7Correlation and .13Learning OutcomesIntroductionCorrelationPearson’s correlation coefficientInterpreting correlation coefficientsRank correlation: Spearman’s coefficientWhich correlation coefficient to useRegressionThe least-squares criterionInterpreting a and bForecastingWhich variable to denote by yJudging the validity of forecastsSummaryRevision QuestionsSolutions to Revision Questions8Time Series8.18.2Learning OutcomesIntroductionComponents and models of time 83286287289290292293301307309309309
FUNDAMENTALS OF BUSINESS MATHEMATICSForecasting linear trendsForecasting seasonal componentsProducing the final forecastSeasonal adjustmentMoving average trendsOther types of dataJudging the validity of forecastsComputations involving the additive modelSummaryReadingsRevision QuestionsSolutions to Revision 109.119.129.139.149.15Learning OutcomesIntroductionDefinitions of probabilityAddition rules of probabilityThe probability of oppositesThe multiplication rules of probabilityMore conditional probabilitiesDiscrete probability distributions; expectationsExpectation and decision-makingLimitations of this approachCharacteristics of the normal distributionUse of the tables of normal distributionFurther normal distribution examplesVenn diagrams9.13.1 Using Venn diagrams to assist with probabilityUncertainty and riskSummaryRevision QuestionsSolutions to Revision Questions10Spreadsheet Skills using Excel10.110.210.310.4Learning OutcomesIntroductionSpreadsheet terminology10.2.1 Workbooks and Worksheets10.2.2 CellsA note on macros and application developmentGetting started with Excel10.4.1 Workbooks of files10.4.2 Worksheets10.4.3 Scroll 8.68.78.88.98.108.11vii
CONTENTSviiiFUNDAMENTALS OF BUSINESS MATHEMATICS 1510.1610.4.4 Status bar10.4.5 ToolbarsGood spreadsheet designGetting started10.6.1 Problems with this spreadsheet10.6.2 Positive aspects of this spreadsheetOwnership and version10.7.1 Problems with this spreadsheet10.7.2 Positive aspects of this spreadsheetFormatting10.8.1 Problems with this spreadsheet10.8.2 Positive aspects of this spreadsheetDocumentationMinimising absolute values10.10.1 Problems with this spreadsheetControl checks for auditingChartsTips for larger plansTemplates10.14.1 Data input formsThe use of spreadsheets by management accountantsSummaryPreparing for the AssessmentRevision techniqueFormat of the assessmentRevision QuestionsSolutions to Revision 3404405406406407408409410411413414417453Mock Assessment 1481Mock Assessment 2505Index535
The CIMALearning SystemHow to use your CIMA Learning SystemThis Fundamentals of Business Mathematics Learning System has been devised as a resourcefor students attempting to pass their CIMA computer-based assessments, and provides: a detailed explanation of all syllabus areas;extensive ‘practical’ materials;generous question practice, together with full solutions;a computer-based assessments preparation section, complete with computer-based assessments standard questions and solutions.This Learning System has been designed with the needs of home-study and distancelearning candidates in mind. Such students require very full coverage of the syllabus topics,and also the facility to undertake extensive question practice. However, the LearningSystem is also ideal for fully taught courses.This main body of the text is divided into a number of chapters, each of which is organised on the following pattern: Detailed learning outcomes expected after your studies of the chapter are complete. Youshould assimilate these before beginning detailed work on the chapter, so that you canappreciate where your studies are leading.Step-by-step topic coverage. This is the heart of each chapter, containing detailed explanatory text supported where appropriate by worked examples and exercises. You shouldwork carefully through this section, ensuring that you understand the material beingexplained and can tackle the examples and exercises successfully. Remember that inmany cases knowledge is cumulative: if you fail to digest earlier material thoroughly, youmay struggle to understand later chapters.Activities. Some chapters are illustrated by more practical elements, such as commentsand questions designed to stimulate discussion.Question practice. The test of how well you have learned the material is your ability totackle exam-standard questions. Make a serious attempt at producing your own answers,but at this stage do not be too concerned about attempting the questions in computerbased assessments conditions. In particular, it is more important to absorb the materialthoroughly by completing a full solution than to observe the time limits that wouldapply in the actual computer-based assessments.ix
THE CIMA LEARNING SYSTEMxFUNDAMENTALS OF BUSINESS MATHEMATICS C3 Solutions. Avoid the temptation merely to ‘audit’ the solutions provided. It is an illusionto think that this provides the same benefits as you would gain from a serious attemptof your own. However, if you are struggling to get started on a question you should readthe introductory guidance provided at the beginning of the solution, where provided,and then make your own attempt before referring back to the full solution.Having worked through the chapters you are ready to begin your final preparations for thecomputer-based assessments. The final section of the CIMA Learning System provides youwith the guidance you need. It includes the following features: A brief guide to revision technique.A note on the format of the computer-based assessments. You should know whatto expect when you tackle the real computer-based assessments, and in particular thenumber of questions to attempt.Guidance on how to tackle the computer-based assessments itself.A table mapping revision questions to the syllabus learning outcomes allowing you toquickly identify questions by subject area.Revision questions. These are of computer-based assessments standard and should be tackled in computer-based assessments conditions, especially as regards the time allocation.Solutions to the revision questions.Two mock computer-based assessments. You should plan to attempt these just before thedate of the real computer-based assessments. By this stage your revision should be complete and you should be able to attempt the mock computer-based assessments within thetime constraints of the real computer-based assessments.If you work conscientiously through the CIMA Learning System according to the guidelines above you will be giving yourself an excellent chance of success in your computerbased assessments. Good luck with your studies!Guide to the Icons used within this TextKey term or definitionExam tip or topic likely to appear in the computer-based assessmentsExerciseQuestionSolutionComment or NoteDiscussion pointsEquations to learn
FUNDAMENTALS OF BUSINESS MATHEMATICSxiPassing exams is partly a matter of intellectual ability, but however accomplished you arein that respect you can improve your chances significantly by the use of appropriate studyand revision techniques. In this section we briefly outline some tips for effective study during the earlier stages of your approach to the computer-based assessments. Later in the textwe mention some techniques that you will find useful at the revision stage.THE CIMA LEARNING SYSTEMStudy techniquePlanningTo begin with, formal planning is essential to get the best return from the time you spendstudying. Estimate how much time in total you are going to need for each paper you arestudying for the Certificate in Business Accounting. Remember that you need to allowtime for revision as well as for initial study of the material. The amount of notional studytime for any paper is the minimum estimated time that students will need to achieve thespecified learning outcomes set out below. This time includes all appropriate learningactivities, for example, face-to-face tuition, private study, directed home study, learning inthe workplace, revision time, etc. You may find it helpful to read Better Exam Results: aGuide for Business and Accounting Students by S. A. Malone, Elsevier, ISBN: 075066357X.This book will provide you with proven study techniques. Chapter by chapter it covers thebuilding blocks of successful learning and examination techniques.The notional study time for the Certificate in Business Accounting paperFundamentals of Business Mathematics is 130 hours. Note that the standard amountof notional learning hours attributed to one full-time academic year of approximately 30weeks is 1,200 hours.By way of example, the notional study time might be made up as follows:HoursFace-to-face study: up toPersonal study: up to‘Other’ study – e.g. learning in the workplace, revision, etc.: up to406525130Note that all study and learning-time recommendations should be used only as a guidelineand are intended as minimum amounts. The amount of time recommended for face-to-facetuition, personal study and/or additional learning will vary according to the type of courseundertaken, prior learning of the student, and the pace at which different students learn.Now split your total time requirement over the weeks between now and the exam. Thiswill give you an idea of how much time you need to devote to study each week. Rememberto allow for holidays or other periods during which you will not be able to study (e.g.because of seasonal workloads).With your study material before you, decide which chapters you are going to study ineach week, and which weeks you will devote to revision and final question practice.Prepare a written schedule summarising the above – and stick to it!The amount of space allocated to a topic in the Learning System is not a very goodguide as to how long it will take you. For example, the material relating to Section A ‘BasicMathematics’ and Section C ‘Summarising and Analysing Data’ both account or 15% of
THE CIMA LEARNING SYSTEMxiiFUNDAMENTALS OF BUSINESS MATHEMATICS C3the syllabus, but the latter has more pages because there are more illustrations, which takeup more space. The syllabus weighting is the better guide as to how long you should spendon a syllabus topic. It is essential to know your syllabus. As your course progresses you willbecome more familiar with how long it takes to cover topics in sufficient depth. Your timetable may need to be adapted to allocate enough time for the whole syllabus.Tips for effective studying1. Aim to find a quiet and undisturbed location for your study, and plan as far as possibleto use the same period of time each day. Getting into a routine helps to avoid wasting time. Make sure that you have all the materials you need before you begin so as tominimise interruptions.2. Store all your materials in one place, so that you do not waste time searching for itemsaround your accommodation. If you have to pack everything away after each studyperiod, keep them in a box, or even a suitcase, which will not be disturbed until thenext time.3. Limit distractions. To make the most effective use of your study periods you shouldbe able to apply total concentration, so turn off all entertainment equipment, set yourphones to message mode, and put up your ‘do not disturb’ sign.4. Your timetable will tell you which topic to study. However, before diving in and becoming engrossed in the finer points, make sure you have an overall picture of all the areasthat need to be covered by the end of that session. After an hour, allow yourself a shortbreak and move away from your Learning System. With experience, you will learn toassess the pace you need to work at.5. Work carefully through a chapter, making notes as you go. When you have covered asuitable amount of material, vary the pattern by attempting a practice question. Whenyou have finished your attempt, make notes of any mistakes you made, or any areasthat you failed to cover or covered only skimpily.6. Make notes as you study, and discover the techniques that work best for you. Yournotes may be in the form of lists, bullet points, diagrams, summaries, ‘mind maps’, orthe written word, but remember that you will need to refer back to them at a later date,so they must be intelligible. If you are on a taught course, make sure you highlight anyissues you would like to follow up with your lecturer.7. Organise your notes. Make sure that all your notes, calculations etc can be effectivelyfiled and easily retrieved later.Computer-Based AssessmentsCIMA uses computer-based assessments (CBAs) for all subjects for the Certificate inBusiness Accounting. The website saysObjective questions are used. The most common type is ‘multiple choice’, where you have to choose the correct answer from a list of possible answers, but there are a variety of other objective question types that canbe used within the system. These include true/false questions, matching pairs of text and graphic, sequencingand ranking, labelling diagrams and single and multiple numeric entry.Candidates answer the questions by either pointing and clicking the mouse, moving objects around thescreen, typing numbers, or a combination of these responses. Try the online demo at http://www.cimaglobal.com to see how the technology works.
FUNDAMENTALS OF BUSINESS MATHEMATICSIn every chapter of this Learning System we have introduced these types of questionsbut obviously we have to label answers A, B, C etc. rather than using click boxes. Forconvenience, we have retained quite a lot of questions where an initial scenario leads toa number of sub-questions. There will be questions of this type in the CBA but they willrarely have more than three sub-questions. In all such cases the answer to one part doesnot hinge upon a prior answer.Fundamentals of Business Mathematics andComputer-Based AssessmentsThe computer-based assessments for Fundamentals Business Mathematics is a 2-hourcomputer-based assessments comprising 45 compulsory questions, with one or more parts.Single part questions are generally worth 1–2 marks each, but two and three part questionsmay be worth 4 or 6 marks. There will be no choice and all questions should be attemptedif time permits. CIMA are continuously developing the question styles within the CBAsystem and you are advised to try the on-line website demo at www.cimaglobal.com, toboth gain familiarity with assessment software and examine the latest style of questionsbeing used.Fundamentals of Business MathematicsSyllabus outlineThe Syllabus comprises:Topic and study weightingABCDEFGBasic MathematicsProbabilitySummarising and Analysing DataInter-relationships between variablesForecastingFinancial ng AimsThis syllabus aims to test the candidate’s ability to: demonstrate the use of basic mathematics, including formulae and ratios;identify reasonableness in the calculation of answers;demonstrate the use of probability where risk and uncertainty exist;apply techniques for summarising and analysing data;calculate correlation coefficients for bivariate data and apply the technique of simpleregression analysis;THE CIMA LEARNING SYSTEMThe CBA system can ensure that a wide range of the syllabus is assessed, as a pre-determined numberof questions from each syllabus area (dependent upon the syllabus weighting for that particular area) areselected in each assessment.xiii
THE CIMA LEARNING SYSTEMxivFUNDAMENTALS OF BUSINESS MATHEMATICS C3 demonstrate techniques used for forecasting;apply financial mathematical techniques;apply spreadsheets to facilitate the presentation of data, analysis of univariate and bivariate data and use of formulae.Assessment strategyThere will be a computer-based assessments of 2 hours duration, comprising 45 compulsory questions, each with one or more parts.A variety of objective test question styles and types will be used within the assessment.Learning outcomes and indicative syllabuscontentABasic Mathematics – 15%Learning OutcomesOn completion of their studies students should be able to:(i) demonstrate the order of operations in formulae, including brackets, powers androots;(ii) calculate percentages and proportions;(iii) calculate answers to appropriate number of decimal places or significant figures;(iv) solve simple equations, including two variable simultaneous equations and quadraticequations;(v) prepare graphs of linear and quadratic equations.Indicative syllabus content Use of formulae, including negative powers as in the formula for the learning curve.Percentages and ratios.Rounding of numbers.Basic algebraic techniques and solution of equations, including simultaneous equationsand quadratic equations.Manipulation of inequalities.BProbability – 15%Learning outcomesOn completion of their studies students should be able to:(i)(ii)(iii)(iv)(v)calculate a simple probability;demonstrate the addition and multiplication rules of probability;calculate a simple conditional probability;calculate an expected value;demonstrate the use of expected value tables in decision making;
FUNDAMENTALS OF BUSINESS MATHEMATICSIndicative syllabus contentThe relationship between probability, proportion and percent.Addition and multiplication rules in probability theory.Venn diagrams.Expected values and expected value tables.Risk and uncertainty. CSummarising and Analysing Data – 15%Learning OutcomesOn completion of their studies students should be able n the difference between data and information;identify the characteristics of good information;tabulate data and prepare histograms;calculate for both ungrouped and grouped data: arithmetic mean, median, mode,range, variance, standard deviation and coefficient of variation;explain the concept of a frequency distribution;prepare graphs/diagrams of normal distribution, explain its properties and use tablesof normal distribution;apply the Pareto distribution and the ‘80:20 rule’;explain how and why indices are used;calculate indices using either base or current weights;apply indices to deflate a series.Indicative syllabus content Data and information.Tabulation of data.Graphs and diagrams: scatter diagrams, histograms, bar charts and ogives.Summary measures of central tendency and dispersion for both grouped and ungroupeddata.Frequency distributions.Normal distribution, the Pareto distribution and ‘80:20 rule’.Index numbers.DInter-relationships between Variables – 15%Learning outcomesOn completion of their studies students should be able to:(i) prepare a scatter diagram;(ii) calculate the correlation coefficient and the coefficient of determination between twovariables;THE CIMA LEARNING SYSTEM(vi) explain the limitations of expected values;(vii) explain the concepts of risk and uncertainty.xv
THE CIMA LEARNING SYSTEMxviFUNDAMENTALS OF BUSINESS MATHEMATICS C3(iii) calculate the regression equation between two variables;(iv) apply the regression equation to predict the dependent variable, given a value of theindependent variable.Indicative syllabus content Scatter diagrams and the correlation coefficientSimple linear regressionEForecasting – 15%Learning outcomesOn completion of their studies students should be able to:(i)(ii)(iii)(iv)(v)prepare a time series graph;identify trends and patterns using an appropriate moving average;identify the components of a time series model;prepare a trend equation using either graphical means or regression analysis;calculate seasonal factors for both additive and multiplicative models and explainwhen each is appropriate;(vi) calculate predicted values, given a time series model;(vii) identify the limitations of forecasting models.Indicative syllabus content Time series analysis – graphical analysis.Trends in time series – graphs, moving averages and linear regression.Seasonal variations using both additive and multiplicative models.Forecasting and its limitations.FFinancial Mathematics – 15%Learning OutcomesOn completion of their studies students should be able to:(i)(ii)(iii)(iv)calculate future values of an investment using both simple and compound interest;calculate an annual percentage rate of interest given a monthly or quarterly rate;calculate the present value of a future cash sum using formula and CIMA Tables;calculate the present value of an annuity and a perpetuity using formula and CIMATables;(v) calculate loan/mortgage repayments and the value of the loan/mortgage outstanding;(vi) calculate the future value of regular savings and/or the regular investment neededto generate a required future sum using the formula for the sum of a geometricprogression;(vii) calculate the net present value (NPV) and internal rate of return (IRR) of a projectand explain whether and why it should be accepted.
FUNDAMENTALS OF BUSINESS MATHEMATICS Simple and compound interest.Annuities and perpetuities.Loans and mortgages.Sinking funds and savings funds.Discounting to find NPV and IRR and interpretation of NPV and IRR.GSpreadsheets – 10%Learning OutcomesOn completion of their studies students should be able to: explain the features and functions of spreadsheet software;explain the use and limitations of spreadsheet software in business;apply spreadsheet software to the normal work of a Chartered Management Accountant.Indicative syllabus content Features and functions of commonly used spreadsheet software: workbook, worksheet,rows, columns, cells, data, text, formulae, formatting, printing, graphics and macros.Note: Knowledge of Microsoft Excel type spreadsheet vocabulary/formulae syntax isrequired. Formulae tested will be that which is constructed by users rather than preprogrammed formulae.Advantages and disadvantages of spreadsheet software, when compared to manual analysis and other types of software application packages.Use of spreadsheet software in the day-to-day work of the Chartered ManagementAccountant: budgeting, forecasting, reporting performance, variance analysis, what-ifanalysis and discounted cashflow calculations.THE CIMA LEARNING SYSTEMIndicative syllabus contentxvii
This page intentionally left blank
Mathematical TablesLINEAR REGRESSION AND CORRELATIONThe linear regression equation of y on x is given by:Y a bXorY Y b( X X )whereb Covariance(XY ) nΣ XY (Σ X )(ΣY ) Variance(X )nΣ X 2 (Σ X )2anda Y bXor solve Y na b X XY a X b X 2Coefficient of Correlationr Covariance( XY )n XY ( X )( Y ) Var(OX ) Var(Y )(n X 2 ( X )2 )(n Y 2 ( Y )2 )R (rank) 1 6 d 2n(n 2 1)FINANCIAL MATHEMATICSCompound Interest (Values and Sums)Future Value of S, of a sum X, invested for n periods, compounded at r% interestS X [1 r ]nAnnuityPresent value of an annuity of 1 per annum receivable or payable for n years, commencing in one year, discounted at r% per annum.PV 1 1 1 r [1 r ]n xix
MATHEMATICAL TABLESxxFUNDAMENTALS OF BUSINESS MATHEMATICS C3PerpetuityPresent value of 1 per annum, payable or receivable in perpetuity, commencing in oneyear, discounted at r% per annum.1PV rNote that logarithm tables are also available when you sit your assessment.
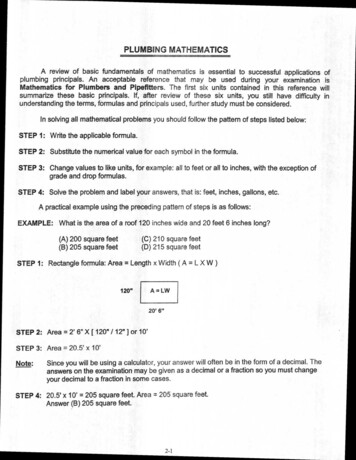
FUNDAMENTALS OF BUSINESS MATHEMATICSZ MATHEMATICAL TABLES0xxi
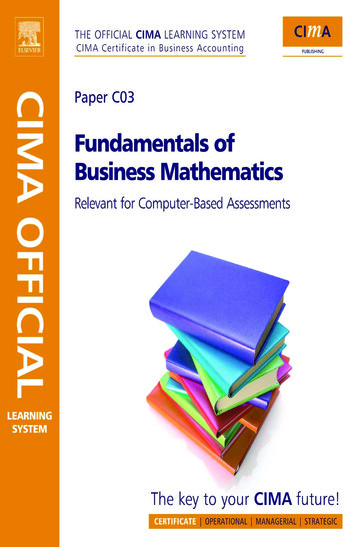
xxiiMATHEMATICAL TABLESFUNDAMENTALS OF BUSINESS MATHEMATICS C3
FUNDAMENTALS OF BUSINESS MATHEMATICSxxiiiMATHEMATICAL TABLES
This page intentionally left blank
1Basic Mathematics
This page i
Fundamentals of Business Mathematics and Computer-Based Assessments xiii Learning outcomes and indicative syllabus content xiv Mathematical Tables xix 1 Basic Mathematics 1 Learning Outcomes 3 1.1 ntroduction I 3 1.2 Mathematical opera