Transcription
SENIOR SECONDARY INTERVENTION PROGRAMME 2013GRADE 12ECONOMICSLEARNER NOTESThe SSIP is supported by
TABLE OF CONTENTSLEARNER NOTESSESSION1TOPICTopic 1. Circular flowTopic 2. The multiplier2Topic 1. Business cycle composition and reasonsTopic 2. Government policy and forcasting for businesscycles23 - 36Topic 1. Necessity of public sector and problems of publicsector provisionsTopic 2. Fiscal policy, laffer curve and public sector failure37 - 524Topic 1. Perfect market cost and revenue curvesTopic 2. Profit maximising in a perfect market53 – 664Self Study:Topic 1. Imperfect market - monopolyTopic 2. Imperfect market – oligopoly67 – 785Topic 1. Market failureTopic 2. Cost benefit analysis79 – 936Topic 1. Economic growth and developmentTopic 2. North-south divide94 – 1086Self Study:Topic 1. South Africa‘s industrial development policiesTopic 2. Free trade and protectionismTopic 3. Import substitution and export promotion109 - 1277Topic 1. Balance of paymentsTopic 2. Foreign exchange market128 – 1457Self Study:Topic 1. Economic IndicatorsTopic 2. Social Indicators146 – 1653PAGE3 – 22Page 2 of 165
GAUTENG DEPARTMENT OF EDUCATIONECONOMICSSENIOR SECONDARY INTERVENTION PROGRAMMEGRADE 12SESSION 1(LEARNER NOTES)TOPIC 1: CIRCULAR FLOWLearner Note: Make sure you know the circular flow model and how to use it to work out thevalue of the output produced by the economy at factor cost. Also remember that whenLeakages Injections, the economy will be in equilibrium. You will now learn how changes inthe injections cause a change in the equilibrium level of output.SECTION A: TYPICAL EXAM QUESTIONSQUESTION 1:12 minutes(Taken from DoE Nov 2009)1.1 Study the table below on the calculation of GDP and answer the questions that follow.CALCULATION OF GDP ACCORDING TO THEINCOME METHOD(2007 figures)R bn.Compensation of employees Net operating surplus Consumption of fixed capital .Gross value added @ ATaxes on production .Subsidies on production Gross value added @ basic prices .C on products . Subsidies on products Gross domestic product @ market prices Primary income from rest of world .Primary income to rest of world .GNI @ market prices 8436442551 742356B23161 996461081 934[Source: SARB Quarterly Bulletin, September 2008]1.1.1 Differentiate between GDP and GNP.(Define both GDP and GNP)(4)1.1.2 Which alternative term is used for GDP in the national accounts?(Alternative name)(2)1.1.3 Provide labels for A and C.(4)1.1.4 Calculate the gross value added at basic prices (letter B).(4)1.1.5 Which component contributed most to the Gross Domestic Product?(Use data in table)(3)1.1.6 Give a reason why the GNP figures in South Africa are generally lowerthan the GDP figures.(3)[20]Page 3 of 165
GAUTENG DEPARTMENT OF EDUCATIONECONOMICSQUESTION 2:SENIOR SECONDARY INTERVENTION PROGRAMMEGRADE 12SESSION 120 minutes(LEARNER NOTES)(Taken from DoE Nov 2008)An open economy circular flow model illustrates the economic interaction between thefour participants.Describe this interaction in detail with the aid of a diagram, which includes injections andwithdrawals.[35](This question is only part of an essay question that counts 50)QUESTION 3:13 minutes(Taken from DoE Nov 2010)3.1 Explain leakages and injections.(Remember always to give an example)[8)]3.2 List THREE methods by which the gross domestic product can be calculated.(3 x 2) (6)3.3 Discuss the role of households (consumers) in the economic circular flowmodel.(4 x 2) (8)[22]QUESTION 4:6 minutes(Taken from DoE Nov 2010)4.1 Study the table below and answer the questions that follow.4.1.1Explain the item subsidies on products.(3)4.1.2Explain the item consumption of fixed capital.(3)4.1.3 Calculate the compensation of employees as a percentage of GDP at marketprices. Show ALL calculations.(4)[10]Page 4 of 165
GAUTENG DEPARTMENT OF EDUCATIONECONOMICSGRADE 12SENIOR SECONDARY INTERVENTION PROGRAMMESESSION 1(LEARNER NOTES)TOPIC 2: THE MULTIPLIERQUESTION 1:12 minutes(Taken from DoE Exemplar 2008)1.1 Study the graph below that depicts a simplified two-sector economy (where E C I)and answer the questions that follow.1.1.1 Name the TWO sectors involved in deriving the macro-economic multiplier.(Name means to give only the terms and not discuss them.)(4)1.1.2 What is represented by the line E Y?(4)1.1.3 Use the formula, k ΔY/ΔJ, to calculate the multiplier (k) for the above scenario.(Remember that ΔY the change in Income, and that ΔJ the change inInjections.)(4)1.1.4 Calculate the multiplier, using the formula, k 1/(1 – MPC), when the marginalpropensity to consume (MPC) 0.8. Show calculations.1.1.5 Explain the relationship between the MPC and the multiplier.(Relationship is how they affect one another.)(6)(2)[20]Page 5 of 165
GAUTENG DEPARTMENT OF EDUCATIONECONOMICSQUESTION 2:GRADE 1210 minutesSENIOR SECONDARY INTERVENTION PROGRAMMESESSION 1(LEARNER NOTES)(Taken from DoE Feb/March 2009)2.1 Copy the graph below. Indicate the new consumption curve, new equilibrium formedafter investment increased by R20 million, and describe the multiplier effect of theincrease of investment of R20 million on the economy.[16](Remember to copy the graph as is, because you will be indicating the change on thegraph. Calculate the multiplier first. Show your new formula with an increase ofR20 million.)Page 6 of 165
GAUTENG DEPARTMENT OF EDUCATIONECONOMICSQUESTION 3:3.1GRADE 12SENIOR SECONDARY INTERVENTION PROGRAMMESESSION 112 minutes(LEARNER NOTES)(Taken from DoE Feb/March 2010)Study the graph of the multiplier in a two-sector model where the consumption functionis given by C c c(Y) on the following page, and answer the questions that follow.3.1.1 Define the term multiplier.(Define means writing out the whole definition.)(3)3.1.2 With reference to the graph, name the TWO sectors involved in deriving themacro-economic multiplier.(Please look at graph to identify the two sectors; don’t name any other.)(4)3.1.3 Indicate what is represented by the dotted line.(2)3.1.4 What is the value of autonomous consumption for the original consumptionfunction?(It is only 2 marks; therefore, you don’t have to show any calculations.)(2)3.1.5 Suppose the marginal propensity to save (MPS) 0,4. Use the multiplier formulato calculate the eventual change in aggregate income, if there was an injection ofR10 billion into the economy. Show ALL the calculations. (HINT: Determine thesize of the multiplier first.)(6)3.1.6 Describe the relationship between the MPC and the multiplier.(3)[20]Page 7 of 165
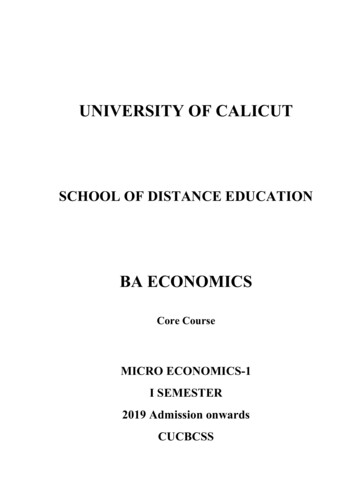
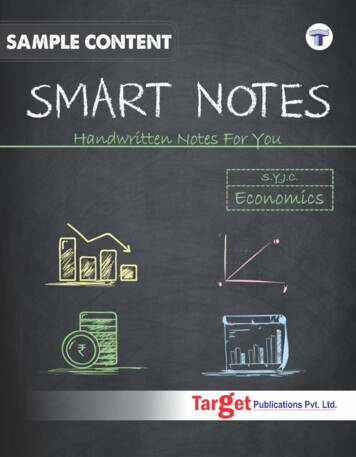
GAUTENG DEPARTMENT OF EDUCATIONECONOMICSGRADE 12SENIOR SECONDARY INTERVENTION PROGRAMMESESSION 1(LEARNER NOTES)SECTION B: ADDITIONAL CONTENT NOTES: TOPIC 1: CIRCULAR FLOWTHE OPEN ECONOMY CIRCULAR FLOW MODEL Open economy: A country that trades with other countries.Closed economy: If a country doesn‘t trade with other countries.The first thing you should understand is the 3 flows. These flows are influenced by four participants:o Household, consumero Private sector, businesseso Public sector, governmento Foreign sectorThe fifth participant can be the financial sector. Source: Oxford p3Page 8 of 165
GAUTENG DEPARTMENT OF EDUCATIONECONOMICS GRADE 12SENIOR SECONDARY INTERVENTION PROGRAMMESESSION 1(LEARNER NOTES)Looking at the circular flow model, we see the following:o Flows: Real flow (goods and services, factors of production)Money flow (remuneration, expenditure)o Markets: Product marketFactor marketFinancial marketThe participants:o Households: primary participants and consumers of goods and services they sell their factors of production (labour) in the factor market tobusinesses in return they receive remuneration with their remuneration they buy goods and services on the goods marketo Businesses: they manufacture goods and services they buy the factors of production from the householdso Government: provide public goods and services, e.g. safety, education, etc. receive revenue from taxo Foreign sector: trade between the foreign sector, households and businesses takesplace in the foreign market in the form of imports and exports.o Financial sector: consists of banks, insurance companies, pension funds and the JSE the money which households and businesses provide are known assavings spending on capital equipment by firms is called investmentsModel equations:GDP C I G (X – Z)o C Consumer expenditureo I Investmentso G Government expenditureo X Exportso Z(M) ImportsTotal expenditure:E C I G X – Z – Te SuTe expenditure on taxesSu SubsidiesTotal income (paid to factors of production)Y w R i Πw wagesR Renti interestΠ ProfitPage 9 of 165
GAUTENG DEPARTMENT OF EDUCATIONECONOMICS GRADE 12SENIOR SECONDARY INTERVENTION PROGRAMMESESSION 1(LEARNER NOTES)Leakages and injectionso Leakages (L) Money leaving the economy Types: Savings (S) Taxes (T) (direct and indirect) Imports (Z/M) L S T Zo Injections (J) Money going into the economy Types: Investments (I) Government expenditure (G) Exports (X) J I G XThe economy is in equilibrium when J L.MARKETSA. Product and factor markets Product markets (output market):o Capital marketo Durable, semi-durable and non-durable goodso Services Factor markets:o Human capital (labour)o Physical capitalo Land (natural resources)o EntrepreneursB. Money and financial capital markets Money market:o This is a market for short-term savings and loans.o Kinds of securities that change hands in this market: Banker‘s acceptances Short-term company debentures Treasury bills Reserve bank debentures Short-term government bondso The SARB is a key institution in the money market.Capital market:o Long-term deposits and borrowings (e.g. mortgage bonds)o The JSE is a key institution in the capital market.C. Foreign exchange market Receipts for exports and payments for imports.Exchange rate is determined by demand and supply.Page 10 of 165
GAUTENG DEPARTMENT OF EDUCATIONECONOMICSGRADE 12SENIOR SECONDARY INTERVENTION PROGRAMMESESSION 1(LEARNER NOTES)STOCKS AND FLOWSA. Flows These are movements of economic variables such as production, income, spending,etc. Economist measure flows over a period of time.B. Stocks A stock tells us about the fixed amount of an economic variable at a particular point intime. E.g. the number of people employed at a given time.NATIONAL ACCOUNT AGGREGATES GDP: The total market value of all final goods and services produced within theboundaries of a country in a particular period (usually one year).In Grade 11, you learnt about the three methods of calculating GDP:o Expenditure method – GDP(E) or GDEo Income method – GDP(I) or GDIo Production method – GDP(P) or GDPThese measures of economic activity are useful not only as an indicator of economicactivity within a country, but also:o to determine the standard of living in a countryo to compare prosperity levels between countrieso to measure economic growth from one year to the nextThe national accounts are published by the SARB in the SARB QB(http://www.reservebank.co.za). It is also available from Stats SA(http://www.statssa.gov.za).The circular flow model is often referred to as the circular flow of income andexpenditure, but it starts with production.Wants productionWe can bring the circular flow to life by translating the illustrated flows into realamounts – the amounts that we find in our national accounts.Production method:o Production takes place in the primary, secondary and tertiary sectors.o However, we cannot merely add up all the market values of all outputs of allparticipants, because such a calculation would amount to double counting.o By subtracting intermediate goods form final goods we find the value that wasadded by each sector.Value added in R billion1. Primary sector2. Secondary sector3. Tertiary sector4. Gross value added at basic prices4.1 Plus taxes on products4.2 Less subsidies on products5. Gross domestic product at market prices(GDP)20051293169081 353174-41 523Source: SARB QB (June 2006) S-113 & 112Page 11 of 165
GAUTENG DEPARTMENT OF EDUCATIONECONOMICS GRADE 12SENIOR SECONDARY INTERVENTION PROGRAMMESESSION 1(LEARNER NOTES)Income method:o GDI adds together the income earned by the owners of the factors ofproduction.Income in R billion20051. Compensation of employees6802. Net operating surplus4543. Consumption of fixed capital1904. Gross value added at factor cost1 3245. Other taxes on production346. Less other subsidies on production-57. Gross value added at basic prices1 3538. Taxes on products1749. Less subsidies on products-410. Gross domestic product at market prices 1 523(or GDI)Source: SARB QB (June 2006) S-112 Compensation of employees (1) consists mainly of gross salaries andwages.Net operating surplus (2) includes mainly the total value of goods andservices that are produced, less cost. Cost has 3 elements: cost of intermediate goods and services cost of remuneration of employees cost of the consumption of fixed capitalThe net operating surpluses show profits and surpluses before taxation.Expenditure method:o GDP(E) measures total expenditure of final goods and services produced withinthe borders of a country.Expenditure on: (in R billions)20051. Final consumption expenditure by households (C)9682. Final consumption expenditure by government (G)3073. Gross capital formation (I)2784. Residual item-85. Gross domestic expenditure1 5456. Exports of goods and services (X)4137. Less imports of goods and services (Z)4358. Expenditure on GDP at market prices1 523Source: SARB QB (June 2006) S-112o GDP(E) C I G (X – Z)Page 12 of 165
GAUTENG DEPARTMENT OF EDUCATIONECONOMICSGRADE 12SENIOR SECONDARY INTERVENTION PROGRAMMESESSION 1(LEARNER NOTES)Real GDP VS Nominal GDPIn order to compare the GDP of one year with that of another, the nominal(current) GDP mustbe changed to a real (constant) GDP. The influence of price changes on total figures must betaken into account when comparing the GDP of one year with that of another.Real GDP Nominal GDP x 100/deflatorThe deflator is usually inflation.ExampleNominal GDP (R mil)Real GDP (R mil) Implicit GDP deflator1985R123 126R123 1261001986R142 135R123 595115Working: 142 135/123 126 x 100 115 (deflator)142 135 x 100/115 123 595 (real GDP)TOPIC 2: THE MULTIPLIERTHE MULTIPLIER The multiplier is based on the principle that spending by one person becomes theincome of another person, which then becomes that person‘s spending, which turnsinto the income of yet another person (re-spending effect).Example:The Government decides to increase its spending by building new roads. This createsjobs and raises the level of employment. These newly employed people then use theirincome to purchase consumer goods. This stimulates the demand for goods andservices and results in an increase in production, which will in turn increase the level ofemployment even further. This raises income and stimulates greater consumerdemand and so on and so on.This implies that a multiplier process occurs in the economy when injections into thecircular flow of spending, production and income take place.The multiplier refers to the ratio used to work out the difference between the initialinvestment and the eventual change in income. The size of the multiplier differsaccording to the extra income produced or created in each round of spending, but thisdepends on the marginal propensity to consume (mpc), that is, how many of everyrand income earners are willing to spend.Example:If we say that for every R1 increase in income we spend 60c.The mpc 0, 6 (60/100). Of every 100c we spend 60c, therefore, it is also correct tosay of every 100c we saved 40c or 0, 4 (40/100). This 0, 4 is thus the marginalpropensity to save (mps).Page 13 of 165
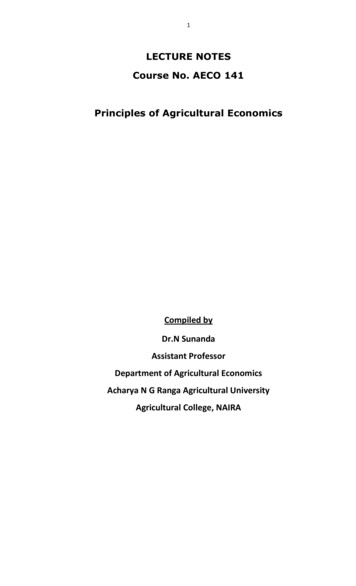
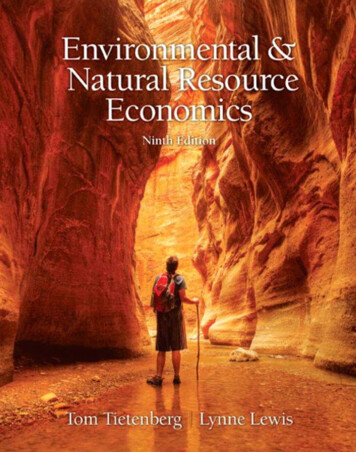
GAUTENG DEPARTMENT OF EDUCATIONECONOMICSSENIOR SECONDARY INTERVENTION PROGRAMMEGRADE 12SESSION 1(LEARNER NOTES)Source: “Economics for all” p19 Economy will be in equilibrium when:o L Jo S T Z I G XDisequilibria when:o Leakages Injectionso Leakages InjectionsProcess of restoring equilibrium causes changes to national income (Y):o National income will rise whenI G X S T ZY C I G (X – Z)the amount of injections in excess of leakages ad additional demando National income will decrease whenI G X S T ZY C I G (X – Z) the amount of leakages in excess of injections, subtract from theexisting demandIn a two sector economy (households and businesses):o Y C Io Y E equilibrium, therefore, you should be able to show I S.o We illustrate this by using the Keynesian 45 diagram.Page 14 of 165
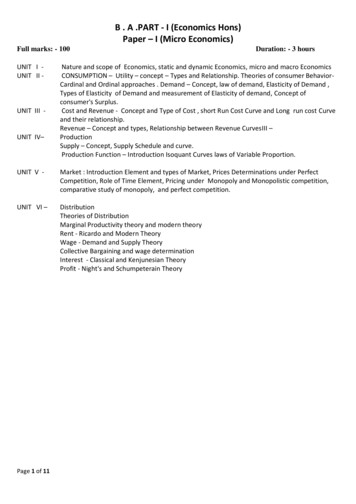
GAUTENG DEPARTMENT OF EDUCATIONECONOMICSGRADE 12SENIOR SECONDARY INTERVENTION PROGRAMMESESSION 1(LEARNER NOTES)Keynesian 45 diagram for a closed economy without government.Source: Oxford p19 Multiplier formula: k change in income Y 1change in consumption C 1-MPCk 1(1-MPC) MPC (marginal propensity to consume): The extent to which additional disposableincome is spent rather than saved over a given period of time.E.g. if R80 in every R100 was spent the MPC would be 0, 8 and the MPS (marginalpropensity to save) 0, 2. MPC MPS 1 k 1MPS 3 sector economy:k 1MPS MRT (MRT marginal rate of taxation) 4 sector economy:k 1MPS MRT MPM (MPM marginal propensity toimport)Page 15 of 165
GAUTENG DEPARTMENT OF EDUCATIONECONOMICSGRADE 12SENIOR SECONDARY INTERVENTION PROGRAMMESESSION 1(LEARNER NOTES)SECTION C: HOMEWORKTOPIC 1: CIRCULAR FLOWQUESTION 1Look at the following diagram and answer the questions that follow:1.11.21.31.41.5What is the amount for the letter A in the diagram?Identify any ONE leakage in the diagram?List any ONE major real flow element in the economy.Why does an increase in exports eventually lead to an increase inconsumption by households?Give an equation for GDP.(2)(2)(2)(4)(5)[15]Page 16 of 165
GAUTENG DEPARTMENT OF EDUCATIONECONOMICSGRADE 12SENIOR SECONDARY INTERVENTION PROGRAMMESESSION 1(LEARNER NOTES)QUESTION 22.1The table on the following page provides hypothetical national income figures for acountry, in R million. Use these figures to calculate the level of aggregate incomeIn the country.(6)ExportsGovernment spendingNet foreign factor income earned in the countryConsumption spending by householdsImportsSavingsInterests on public debtPrivate sector investment in equipment and construction (gross)Corporate profitsPersonal taxes2.223147103431841733792883Look at the following table and answer the questions that follow.Nominal GDP (R mil)DeflatorReal GDP (R mil)199025 50010025 500199127 800105?199230 00011226 7852.2.12.2.22.2.32.3.4Which year is the base year?Differentiate between Nominal and Real GDP.What was the average inflation rate for 1992?Calculate Real GDP for 1991.(2)(4)(2)(4)[18]TOPIC 2: THE MULTIPLIERQUESTION 1:1.11.224 minutesImagine you are given the following information for a closed economy withoutgovernment.C 20 0.5YI 101.1.1 What is the equilibrium level of income?1.1.2 What is the value of the multiplier?(3)(6)1.1.3 Explain the multiplier process that results from an increase ininvestment from 10 to 30.(8)Draw a 45 diagram to illustrate the two expenditure functions and therespective equilibrium levels of income.(6)Page 17 of 165
GAUTENG DEPARTMENT OF EDUCATIONECONOMICS1.3SESSION 1(LEARNER NOTES)Calculate the multiplier in each case:1.3.11.3.21.3.31.3.41.4GRADE 12SENIOR SECONDARY INTERVENTION PROGRAMMEMPC 0,9MPS 0,1MPS 0,25MPC 0,5(3)(3)(3)(3)If the national income increases by R100m and the multiplier is 4, what isthe change in investment?(4)[39]SECTION D: SOLUTIONS AND HINTS TO SECTION ATOPIC 1: CIRCULAR FLOWQUESTION 1:12 minutes(Taken from DoE Nov 2009)1.1.1 GDP is total value of final goods and services producedwithin the boundaries/borders of a country for a specified period.GNP is total value of final goods and services produced by the(4)1.1.2 Gross Value Added (2)1.1.3 A factor cost C taxes (4)1.1.4 R1 742 bn. R35 bn. – R6 bn. R1 771 bn. ORR1 771 bn. / 1 771 (4)1.1.5 Compensation of employees (3)1.1.6 Foreigners contribute more to our economy than we do to theireconomy, therefore a greater amount is subtracted from the GDP and less isadded. (Accept any other relevant explanation)QUESTION 2:20 minutes(3)[20](Taken from DoE Nov 2008)CONCEPTThe circular flow model of the economy is a simplification showing how the economyworks and the relationship between income, production and spending in the economyas a whole. The circular flow model of an open economy shows the workings of aneconomy that is open to foreign trade. It is different to a closed economy because itincludes the foreign sector. (Max. 3)(Accept any other appropriate explanation of the concept.)Page 18 of 165
GAUTENG DEPARTMENT OF EDUCATIONECONOMICSSENIOR SECONDARY INTERVENTION PROGRAMMEGRADE 12SESSION 1(LEARNER NOTES)BODY(Accept any other well-labelled diagram (max 8))There is a flow of money and goods and services between the household sector andbusiness sector Households earn income in the form of wages by selling their factors ofproduction to business. Business use factors of production to produce goods andservices on which the household sector spends Thus the business will receiveincome. There is a flow of money and goods and services between the household sector andState. Household sector provides the state with labour and receive income. The state provides the household with public goods and services e.g. parks,hospitals for which they pay taxes. This is income for the state. There is a flow of money and goods and services between the business sector andState. The business sector provides the state with goods and services for which the statepays. The state provides the business sector with public goods and services for whichthey pay taxes. There is a flow of goods (imports) to the business from the foreign sector which thebusiness pays for . This will be regarded as expenditure for the business There is alsoa flow of goods from the business to the foreign sector. This will be income for thebusiness. Page 19 of 165
GAUTENG DEPARTMENT OF EDUCATIONECONOMICSGRADE 12SENIOR SECONDARY INTERVENTION PROGRAMMESESSION 1(LEARNER NOTES)The financial sector consists of banks, insurance companies and pension funds. They act as a link between households and firms who have surplus money and others inthe economy who require funds. The money which households and firms provide to thefinancial sector is known as savings. The spending on capital equipment by firms isregarded as investment. (Max. 24)[35]QUESTION 3:13 minutes(Taken from DoE Nov 2010)3.1Leakages are any flow that does not give rise to a further round of income alsoknown as withdrawals because it represents a withdrawal of money from theeconomy. (e.g.) of leakages are taxes (T) expenditure on imports (Z/M) andsavings (S) (Max 4)Injections represent the introduction of additional money into the economy (e.g.) of injections are government spending (G) income earned fromexports (X) investment spending (I) (Max 4) (8)3.2Production method / Value Added Method Income method Expenditure method 3.3(3 x 2) (6)Owns four factors of production and presents on input market Receives income (rent, interest, wages and profit) in return Primary sector of consumption of goods and services Pays taxes to the government e.g. income tax Enjoy collective goods and services delivered by the state Spending on goods and services (domestic and foreign) Saving as source of investment Primary participant in the economy (Accept any other relevant fact.)QUESTION 4:6 minutes(Any 4 x 2) (8)[22](Taken from DoE Nov 2010)4.1.1 A subsidy (grant) on a product is paid on the outputs to reduce the price to makeit more affordable E.g. R1 for each loaf of bread (3)4.1.2 Consumption of Fixed Capital is the diminishing value of an asset over a period oftime, also called depreciation E.g. depreciation in the value of equipment,machinery, and vehicles (3)4.1.3 1 086 907 X 1002 423 323 1 44,85 % / 44,9% / 45 % (4)[10]Page 20 of 165
GAUTENG DEPARTMENT OF EDUCATIONECONOMICSGRADE 12SENIOR SECONDARY INTERVENTION PROGRAMMESESSION 1(LEARNER NOTES)TOPIC 2: THE MULTIPLIERQUESTION 11.1.1 Households/Consumers Business sector/Firms/Producers (2 x 2) (4)1.1.2 It shows all the possible levels of expenditure and output at which the economy is in equilibrium 1.1.3 k 2010 2 (2 x 2) (4)(4)1.1.4 k 1 (1 – 0.8) 10.2 5 1.1.5 The bigger the mpc, the bigger the multiplier (and vice versa) (6)(2)[20] QUESTION 22.1Page 21 of 165
GAUTENG DEPARTMENT OF EDUCATIONECONOMICSSENIOR SECONDARY INTERVENTION PROGRAMMEGRADE 12SESSION 1(LEARNER NOTES)In the diagram above, a change in investment of R20 million, with an mpc of (0,5) willresult in equilibrium moving from E to E (R20 million – R60 million). The multiplier is,1therefore 2 , therefore the change in income with an injection of R20 million, will be(2 x R20 million R40 million) (Max. 4 marks)The multiplier describes the situation where a change in spending causes adisproportionate change in the level of aggregate income M (change in Y) change in J. The multiplier effect starts off with unused resources in the economy (e.g.) increase in investment, like construction of roads leads to more jobs The newworkers would then have income to purchase consumer goods which in turn stimulatesthe demand for goods and services and this results in increased levels of productionwhich further increases the level of employment This raises income and stimulatesgreater consumer demand The size of the eventual change in the income will dependon mpc (marginal propensity to consume) (Max. 6 marks)[16]QUESTION 33.1.1 The multiplier shows how an increase in spending (injection) produces a morethan proportional increase in national income (3)3.1.2 Household Business (4)3.1.1 Indicates all points where income expenditure / 45º line / Keynesianequilibrium (2)3.1.4 20 bn. (2)1 1 2.5 mps 0.42.5 x 10 bn. 25 bn. 3.1.5 M (6)3.1.6 The larger the MPC the bigger the multiplier and vice versa (3)[20]The SSIP is supported byPage 22 of 165
GAUTENG DEPARTMENT OF EDUCATIONECONOMICSGRADE 12SENIOR SECONDARY INTERVENTION PROGRAMMESESSION 2(LEARNER NOTES)TOPIC 1: BUSINESS CYCLE COMPOSITION AND REASONSLearner Note: The business cycle shows what happens to the value of the domestic output(GDP) of the economy over time. The time series shows the values of a variable over time.SECTION A: TYPICAL EXAM QUESTIONS: TOPIC 1: BUSINESS CYCLE COMPOSITIONAND REASONSQUESTION 1:9 minutes(Taken from DoE Nov 2008)1.1 Study the diagram below and answer the questions that follow.1.1.1 Define a business cycle.1.1.2 Identify the labels for the following periods in the business cycle asindicated in the above diagram:(a)Upswing or expansion(b)Length or duration of a cycle1.1.3 At which point/phase in the above diagram will unemployment be at itshighest?1.1.4 Name ONE exogenous factor that gives rise to business cycles.QUESTION 2:10 minutes(3)(2 x 3) (6)(2)(3)[14](Taken from DoE Feb-March 2010)2.1 Differentiate between exogenous and endogenous reasons for business cycles.(8 x 2) [16]QUESTION 3:5 minutes(Taken from DoE Nov 2010)3.1 Discuss the Monetarist approach as a cause of business cycles.QUESTION 4:18 minutes[8](Taken from Feb-March 2009)4.1 Write an essay briefly analysing the composition and features of business cycles.(Remember this question is part of an essay question)[30]Page 23 of 165
GAUTENG DEPARTMENT OF EDUCATIONECONOMICSSENIOR SECONDARY INTERVENTION PROGRAMMEGRADE 12SESSION 2(LEARNER NOTES)TOPIC 2: GOVERNMENT POLICY AND FORCASTING FOR BUSINESS CYCLESLearner Note: Remember that in periods of expansion, income, output and employment allincrease; government does not welcome this. Therefore, they use two policies to influencethe business cycle. Together with that, Government and economic agents also want to knowwhat is going to happen in the economy.QUESTION 1:4 minutes(Taken from DoE Nov 2008)1.1.1 Explain how Government can stimulate economic activity in an effort to smoothout cycles.1.1.2 Name the method of predicting future business cycles based on the patterns ofprevious ones.QUESTION 2:4 minutes(3)(3)[6](Taken from DoE Nov 2010)2.1 List the THREE economic indicators used in forecasting of business cycles.(3 x 2) [6]QUESTION 3:3.16 minutes(Taken from DoE Feb-March 2009)Explain how authorities use certain policies to smooth out business cycles.(This is part of an essay question that usually counts 50 marks)QUESTION 4:30 minutes[10](Taken from DoE Nov 2009)4.1 Explain, with the aid of an appropriately labeled diagram, how the various businesscycle indicators can be used in forecasting.[50](Remember that only the second part of the question is based on this session)SECTION B: ADDITIONAL CONTENT NOTESTOPIC 1: BUSINESS CYCLE COMPOSITION AND REASONSIntroduction Fluctuations in the level of economic activity are part of our daily lives and influence allof us in some way or another.When the economic activity increases, households have more money to spend.When the economic activity decreases, people struggle to get jobs.Page 24 of 165
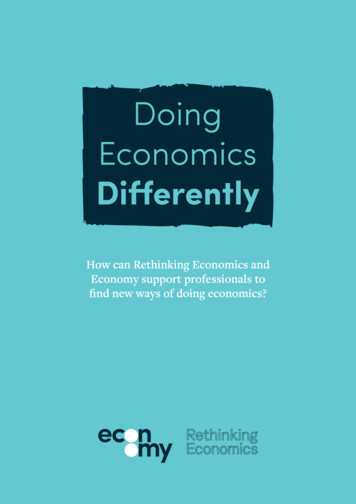
GAUTENG DEPARTMENT OF EDUCATIONECONOMICSGRADE 12SENIOR SECONDARY INTERVENTION PROGRAMMESESSION 2(LEARNER NOTES)COMPOSITION AND FEATURES OF BUSINESS CYCLES Business cycles: Are successive periods of increasing or decreasing economicactivity. They are also known as economic fluctuations, and they relate to changes inbusiness conditions.Source: “Enjoy economics” p24 The key variable in business cycles is real GDP.No two cycles are exact
ECONOMICS GRADE 12 SESSION 1 (LEARNER NOTES) Page 5 of 165 TOPIC 2: THE MULTIPLIER QUESTION 1: 12 minutes (Taken from DoE Exemplar 2008) 1.1 Study the graph belo