Transcription
MACROECONOMICS188019001920194019601980Matthias DoepkeUniversity of ChicagoAndreas LehnertBoard of Governors of theFederal Reserve SystemAndrew W. SellgrenGeorge Mason University2000
This book was typeset in Palatino and Computer Modern using LATEX.Draft of 1 September 1999.Chapters 5, 8, 9, and 11 Copyright c 1999, by Matthias Doepke.Chapters 10, 12, 13, 14, 17, 18, and 19 Copyright c 1999, by Andreas Lehnert.Chapters 1, 2, 3, 4, 6, and 15 Copyright c 1999, by Andrew W. Sellgren.All rights reserved. No part of this work may be reproduced in any form by any electronicor mechanical means (including, but not limited to, photocopying, recording, or information storage and retrieval) without permission in writing from the copyright owner.The authors permit faculty, students, and staff of the University of Chicago to copy anddistribute any part of this work for use in classes taught at the University of Chicago.
PrefaceWe have designed this book to be a supplement to Robert J. Barro’s Macroeconomics, whichis the textbook that is used in introductory macroeconomics courses at the University ofChicago. In teaching these courses, we have found that Barro’s treatment of the subjectdoes not make use of the mathematical skills of our students. In particular, Barro reliesalmost exclusively on economic intuition and graphs to elucidate his subject. Since ourstudents are familiar with calculus, we are able to work out formal models. This almostalways allows greater concreteness and concision.We have attempted to align our chapters with those in Barro’s textbook. Sometimes ourchapters present mathematical versions of the models that Barro introduces in his corresponding chapters (as in Chapters 2 and 19). Other times, our chapters contain materialthat extends his work (as in Chapters 5 and 17). Throughout, we have tried to add value tothe treatment in Barro’s book and to minimize redundancy. For example, we have nothingto add to Barro’s Chapters 7, 16, and 20, so we have not covered those chapters. Threechapters deviate from this plan. Chapter 1 develops the mathematics of interest rates andgrowth rates; Barro does not cover these topics, but they are behind the scenes in his Chapter 1 and throughout his book. Chapter 10, which covers unemployment, is completelyunrelated to Barro’s Chapter 10. It is intended as a companion to the book Job Creation andDestruction by Davis, Haltiwanger, and Schuh. Chapter 18 covers the relationship betweenthe government budget constraint and inflation along the lines of the “Unpleasant Monetarist Arithmetic” of Sargent and Wallace. Although Barro has a sidebar on this topic inhis Chapter 14, we feel that it is important enough to merit a chapter of its own. We choseChapter 18 since it is a natural point between fiscal policy (Chapters 12, 13, and 14) andmonetary policy (Chapter 19). Barro’s Chapter 18 is a review of the empirical evidence onthe effect of monetary shocks on the real economy, and is well worth covering.There are exercises after each chapter, and we have provided complete solutions at theend of this book. We believe that exercises are essential for students to learn this material.They give students a sense of what they ought to know, since these exercises have beendrawn from several years of exams. Also, we often use exercises to introduce extensionsto the material in the text. We have attempted to estimate the difficulty of these exercises,labeling them as “Easy,” “Moderate”, or “Hard”. An exercise with a “Hard” rating mayrequire a lot of algebra, or it may use unfamiliar concepts. Most other questions are rated
Prefaceivas “Moderate”, unless they have one-line solutions, in which case we usually rated themas “Easy”.We teach this material in two ten-week courses. In the first course we cover Chapters 1, 2,3, 6, 4, 5, 7, 8, 9, and 11, in that order. This allows us to keep together all the material onmonetary economics (Chapters 4, 5, 7, and 8). In the second course, we cover Chapter 10(unemployment); Chapters 12, 13, and 14 (fiscal policy); Chapters 15 and 16 (internationalmacro); and Chapters 17, 18 and 19 (money and banking). Since this is quite a lot to coverin ten weeks, instructors of the second course have traditionally touched only briefly onunemployment and international macro and concentrated instead on monetary and fiscalpolicy. The second course can benefit substantially from outside readings, such as: RationalExpectations and Inflation by Thomas Sargent; A Monetary History of the United States by Milton Friedman and Anna Schwartz; and Job Creation and Destruction by Davis, Haltiwanger,and Schuh.This book would not have been possible without the support of the Department of Economics at the University of Chicago and the encouragement of Grace Tsiang. We wouldalso like to thank the many students and faculty who have helped us to develop this material. A number of exercises in the first half of the book were based on questions writtenby Robert E. Lucas, Jr. The material in the second half of this book has benefited from several generations of instructors of Economics 203. In particular, Alexander Reyfman wrotea series of lectures which were the genesis of Chapters 12 through 19. Reyfman’s teaching assistant Bill Dupor, and Lehnert’s teaching assistants Jerry Cubbin and Tom Miles,all contributed valuable suggestions. During Cubbin’s tenure as TA, he wrote most of thesolutions to the problem sets, and several of these have found their way into this book. Allstudents subjected to early drafts of this material contributed to the book’s current form;Shannon Thaden, Ben Ruff, and Calvin Chan deserve special mention.In spite of all the comments and suggestions we have received, this book inevitably contains errors and omissions. We would be grateful if you would bring these to our attention.The authors can be reached by e-mail at:m-doepke@uchicago.eduThere is also a tear-out feedback form at the end of the book, along with a tear-out midtermevaluation form for Economics 202 and 203.Finally, some of the material in this book involves policy prescriptions. At some level,policy is a matter of opinion. The opinions expressed herein are not necessarily those ofthe Board of Governors of the Federal Reserve System.Chicago, IllinoisSeptember 1999
ContentsPreface123iiiPreliminaries11.1Compound Interest . . . . . . . . . . . . . . . . . . . . . . . . . . . . . . . . .11.2Growth Rates . . . . . . . . . . . . . . . . . . . . . . . . . . . . . . . . . . . .3Exercises . . . . . . . . . . . . . . . . . . . . . . . . . . . . . . . . . . . . . . .5Work Effort, Production, and Consumption92.1Crusoe’s Production Possibilities . . . . . . . . . . . . . . . . . . . . . . . . .92.2Crusoe’s Preferences . . . . . . . . . . . . . . . . . . . . . . . . . . . . . . . .112.3Crusoe’s Choices . . . . . . . . . . . . . . . . . . . . . . . . . . . . . . . . . .122.4Income and Substitution Effects . . . . . . . . . . . . . . . . . . . . . . . . . .17Exercises . . . . . . . . . . . . . . . . . . . . . . . . . . . . . . . . . . . . . . .18Appendix . . . . . . . . . . . . . . . . . . . . . . . . . . . . . . . . . . . . . .19The Behavior of Households with Markets for Commodities and Credit213.1The General Setup . . . . . . . . . . . . . . . . . . . . . . . . . . . . . . . . . .213.2A Two-Period Model . . . . . . . . . . . . . . . . . . . . . . . . . . . . . . . .233.3An Infinite-Period Model . . . . . . . . . . . . . . . . . . . . . . . . . . . . . .28
ContentsviExercises . . . . . . . . . . . . . . . . . . . . . . . . . . . . . . . . . . . . . . .4The Demand for MoneyExercises . . . . . . . . . . . . . . . . . . . . . . . . . . . . . . . . . . . . . . .5689303336The Market-Clearing Model395.1A General Pure-Exchange Economy . . . . . . . . . . . . . . . . . . . . . . .395.2Normalization of Prices . . . . . . . . . . . . . . . . . . . . . . . . . . . . . .415.3Walras’ Law . . . . . . . . . . . . . . . . . . . . . . . . . . . . . . . . . . . . .425.4The First Welfare Theorem . . . . . . . . . . . . . . . . . . . . . . . . . . . . .44Exercises . . . . . . . . . . . . . . . . . . . . . . . . . . . . . . . . . . . . . . .46The Labor Market476.1Equilibrium in the Labor Market . . . . . . . . . . . . . . . . . . . . . . . . .476.2Intertemporal Labor Choice . . . . . . . . . . . . . . . . . . . . . . . . . . . .50Exercises . . . . . . . . . . . . . . . . . . . . . . . . . . . . . . . . . . . . . . .52Inflation578.1Money Supply and Demand . . . . . . . . . . . . . . . . . . . . . . . . . . . .578.2The Quantity Theory . . . . . . . . . . . . . . . . . . . . . . . . . . . . . . . .598.3A Cash-in-Advance Economy . . . . . . . . . . . . . . . . . . . . . . . . . . .61Exercises . . . . . . . . . . . . . . . . . . . . . . . . . . . . . . . . . . . . . . .68Business Cycles699.1Shocks and Propagation Mechanisms . . . . . . . . . . . . . . . . . . . . . .699.2A Real Business Cycle Model . . . . . . . . . . . . . . . . . . . . . . . . . . .729.3Simulations . . . . . . . . . . . . . . . . . . . . . . . . . . . . . . . . . . . . .77
ContentsExercises . . . . . . . . . . . . . . . . . . . . . . . . . . . . . . . . . . . . . . .10 Unemploymentvii818510.1 Job Creation and Destruction: Notation . . . . . . . . . . . . . . . . . . . . .8610.2 Job Creation and Destruction: Facts . . . . . . . . . . . . . . . . . . . . . . . .91Exercises . . . . . . . . . . . . . . . . . . . . . . . . . . . . . . . . . . . . . . .9211 Economic Growth9511.1 Growth Facts . . . . . . . . . . . . . . . . . . . . . . . . . . . . . . . . . . . . .9611.2 The Solow Growth Model . . . . . . . . . . . . . . . . . . . . . . . . . . . . .9711.3 Growth Accounting . . . . . . . . . . . . . . . . . . . . . . . . . . . . . . . . . 10211.4 Fertility and Human Capital . . . . . . . . . . . . . . . . . . . . . . . . . . . . 103Exercises . . . . . . . . . . . . . . . . . . . . . . . . . . . . . . . . . . . . . . . 10812 The Effect of Government Purchases12.1 Permanent Changes in Government Spending . . . . . . . . . . . . . . . . .11111212.2 Temporary Changes in Government Spending . . . . . . . . . . . . . . . . . 12212.3 Social Security . . . . . . . . . . . . . . . . . . . . . . . . . . . . . . . . . . . . 125Exercises . . . . . . . . . . . . . . . . . . . . . . . . . . . . . . . . . . . . . . . 12813 The Effect of Taxation13113.1 General Analysis of Taxation . . . . . . . . . . . . . . . . . . . . . . . . . . . 13213.2 Taxation of Labor . . . . . . . . . . . . . . . . . . . . . . . . . . . . . . . . . . 13713.3 Taxation of Capital . . . . . . . . . . . . . . . . . . . . . . . . . . . . . . . . . 14213.4 Redistribution and Taxation . . . . . . . . . . . . . . . . . . . . . . . . . . . . 146Exercises . . . . . . . . . . . . . . . . . . . . . . . . . . . . . . . . . . . . . . . 148
Contentsviii14 The Optimal Path of Government Debt15314.1 The Government Budget Constraint . . . . . . . . . . . . . . . . . . . . . . . 15414.2 Barro-Ricardo Equivalence . . . . . . . . . . . . . . . . . . . . . . . . . . . . . 15714.3 Preliminaries for the Ramsey Problem . . . . . . . . . . . . . . . . . . . . . . 16114.4 The Ramsey Optimal Tax Problem . . . . . . . . . . . . . . . . . . . . . . . . 165Exercises . . . . . . . . . . . . . . . . . . . . . . . . . . . . . . . . . . . . . . . 17015 Comparative Advantage and Trade17315.1 Two Workers under Autarky . . . . . . . . . . . . . . . . . . . . . . . . . . . 17415.2 Two Workers Who Can Trade . . . . . . . . . . . . . . . . . . . . . . . . . . . 176Exercises . . . . . . . . . . . . . . . . . . . . . . . . . . . . . . . . . . . . . . . 18117 Financial Intermediation18317.1 Banking Basics . . . . . . . . . . . . . . . . . . . . . . . . . . . . . . . . . . . . 18517.2 A Model with Costly Audits . . . . . . . . . . . . . . . . . . . . . . . . . . . . 19017.3 A Model with Private Labor Effort . . . . . . . . . . . . . . . . . . . . . . . . 19517.4 A Model of Bank Runs . . . . . . . . . . . . . . . . . . . . . . . . . . . . . . . 199Exercises . . . . . . . . . . . . . . . . . . . . . . . . . . . . . . . . . . . . . . . 20618 Fiscal and Monetary Policy21118.1 Are Government Budget Deficits Inflationary? . . . . . . . . . . . . . . . . . 21218.2 The Ends of Four Big Inflations . . . . . . . . . . . . . . . . . . . . . . . . . . 221Exercises . . . . . . . . . . . . . . . . . . . . . . . . . . . . . . . . . . . . . . . 22319 Optimal Monetary Policy22719.1 The Model of Lucas (1972) . . . . . . . . . . . . . . . . . . . . . . . . . . . . . 22919.2 Monetary Policy and the Phillips Curve . . . . . . . . . . . . . . . . . . . . . 231
Contentsix19.3 Optimal Monetary Policy without Commitment: The Nash Problem . . . . 23619.4 Optimal Nominal Interest Rate Targets . . . . . . . . . . . . . . . . . . . . . . 237Exercises . . . . . . . . . . . . . . . . . . . . . . . . . . . . . . . . . . . . . . . 239Solutions to Exercises243
Chapter 1PreliminariesThis chapter introduces interest rates and growth rates. The two topics are closely related,so we treat them together. The concepts discussed here are not in Barro, but they will helpyou understand the graphs and statistics that he uses throughout his book.1.1 Compound InterestWe begin with some common terms and calculations from the realm of fixed-income investments. The amount of the investment is called the principal. The “fixed-income” fromthe investments is called interest. The interest per unit of principal per unit of time is calledthe interest rate. Most commonly, interest rates are quoted in dollars per year per dollar ofprincipal. These units can be written: ( ). The dollar units cancel, so this interest ratehas units of one over years. Similarly, if the interest rate is apples per day per apple borrowed, the apple units will cancel, and the units of the interest rate will be one over days.In general, the units of an interest rate are one over some unit of time. yWhen the unit of time is a year, we say that an interest rate is an annual interest rate. If theunit of time is not mentioned, then it will almost always be an annual interest rate. Interestrates that are quoted in some specific unit of time can be converted to any other unit of timevia a simple linear transformation. For example, a daily interest rate of x% corresponds toan annual interest rate of (365)(x)%.1 (See Exercise 1.1 for an example.)PRWe use for the principal of a fixed-income investment and for the annual interest rate.Under simple interest the interest is earned on the amount of the principal only. In this case,1 You may be wondering about leap years. These are handled according to any of a number of conventions.For example, some interest rates are quoted using 360 days as a year; others use 365; still others use 365.25.
Preliminaries2n years the value of the investment will be:(1.1)Vs (n) RPn P:afterFor example, suppose you invest 5,000 at a 4.5% simple annual interest rate. After twoyears the value of your investment will be:Vs (2) (0:045)( 5; 000)(2) 5; 000 5; 450:It is much more common for interest to be compounded annually. In this case, at the endof each year, that year’s interest will be added to the principal, so the investment will earninterest on the interest. The first year will be just like simple interest, since none of theinterest will yet be compounded. Accordingly, the the value after the first year will be:Va (1) RP P (1 R)P:After the second year, the value will be:Va (2) RVa(1) Va (1) R(1 R)P (1 R)P (1 R)2P:Similarly, after n years, the value will be:(1.2)Va (n) (1 R)nP:Of course, this formula works only an integral numbers of years. For non-integral numbers, you round down to the nearest integral year , compute a ( ), and use that in thesimple-interest formula (1.1) for the fraction of the last year. (See Exercise 1.6 for an example.)nV nLet’s revisit our previous example. Once again, you invest 5,000 at a 4.5% annual interestrate, but this time interest compounds annually. After two years the value of your investment will be:Va (2) (1 0:045)2( 5; 000) 5; 460:13:(Here and throughout, dollar amounts are rounded to the nearest cent.) Notice that theinvestment is worth less under simple interest than under compound interest, since undercompounding you earn about 10 of interest on the first year’s interest.The above reasoning for compounding annually applies to compounding more frequently.The only catch is that the interest rate needs to be quoted in terms of the same time intervalas the compounding. If is an annual interest rate, and interest is to compound timesper year, then the value of an investment after years will be: tn() 1 tRV ntnRtP:We return to our example again, this time supposing that interest compounds daily. Aftertwo years, the value will be:V365 (2) 1 :0 045365 (365)(2);;: :( 5 000) 5 470 84
1.2 Growth Rates3As we compound more and more frequently, we arrive at the expression for continuouscompounding: tn () lim1 ct!1RtV nP:We can make this much more tractable by using the fact that: x 1 lim 1 x!1x ;ewhereing:(1.3)e is Euler’s constant. This gives us the following formula for continuous discountVc (n) tlim!1 tnR1 t P " lim!1(t R)1 1(t R) (t R) #RnP eRnP:We return to our example one last time, this time assuming continuous compounding.After two years, the value of the investment will be:(0:045)(2)( 5 000) 5 470 87c (2) Ve;;: :Again, notice how throughout these examples the value of the investment is greater themore often the interest compounds. Continuous compounding results in the highest value,but the returns to more-frequent compounding fall off fairly quickly. For example, thevalue is almost the same under daily versus continuous discounting.1.2 Growth RatesEconomists are often interested in the growth rates of economic variables. You might read,“Real Gross Domestic Product grew at a 2.3% annual rate this quarter” or “Inflation is 4%”or “The world’s population is growing 20% every decade.” Each of these statements dealswith a growth rate.An interest rate is just the growth rate of the value of an asset, and all the terminologyand formulae from the previous section apply to growth rates generally. For example, wecan calculate simple annual growth rates and annual growth rates that are compoundedannually or continuously.Consider the following values for the Gross Domestic Product (GDP) of a hypotheticalcountry:Year199119921993GDP 100,000,000 130,000,000 135,000,000
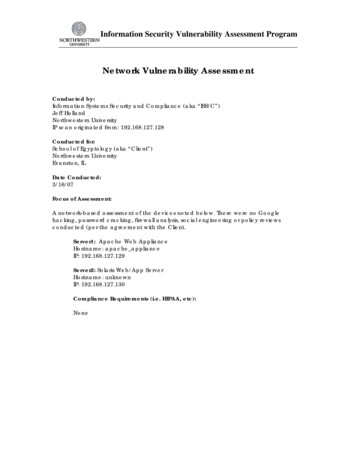
Preliminaries4The growth rate of GDP is just the interest rate that GDP would have had to earn if it werea fixed-income investment.RFor example, the simple rate of growth of GDP between 1992 and 1993 is given by inequation (1.1). Starting GDP is , ending GDP is s ( ), and is one year. Plugging all thenumbers in, we get:PV nn 135K (R)( 130K )(1) 130K; so:R 135K 130K 1 1:03846154 1 3:846154%:As another example, to calculate the annual rate of growth of GDP, compounded annually,between 1991 and 1993, we use equation (1.2). Starting GDP is , ending GDP is a ( ), andis two years. This gives us:PnV nK (1 R)2( 100K ); so:R ( 135K 100K )(0:5) 1 1:16189500 1 16:189500%: 135As a final example, we do the same calculation, but using continuous compounding. Wejust solve equation (1.3) for . Starting GDP is , ending GDP is c ( ), and is two years.RR [ln( 135K )K eK :PV nK;:n 135 2R ( 100 ) so:ln( 100 )](0 5) 0 15005230 15 15005230%::Economists generally prefer to use continuous compounding, for two reasons. First, under continuous compounding, computing the growth rate between two values of a seriesrequires nothing more than taking the difference of their natural logarithms, as above.This property is useful when graphing series. For example, consider some series that isgiven by ( ) 0 0:08n , which is depicted in Figure 1.1. By the equations above, we knowthat this series grows at an 8% continuous rate. Figure 1.2 depicts the natural logarithm ofthe same series, i.e., ln[ ( )] ln( 0 ) 0 08 . From the equation, you can see that this newseries is linear in , and the slope (0.08) gives the growth rate. Whenever Barro labels thevertical axis of a graph with “Proportionate scale”, he has graphed the natural logarithmof the underlying series. For an example, see Barro’s Figure 1.1.V n VenVnV: nThe second reason economists prefer continuous growth rates is that they have the following desirable property: if you compute the year-by-year continuous growth rates of a seriesand then take the average of those rates, the result is equal to the continuous growth rateover the entire interval.KKKFor example, consider the hypothetical GDP numbers from above: 100 , 130 , and 135 . The continuous growth rate between the first two is: ln( 130 ) ln( 100 ). Thecontinuous growth rate between the second two is: ln( 135 ) ln( 130 ). The average ofthese two is:KK Kln( 135 )K Kln( 130 ) ln( 130 )2KKK :ln( 100 )
Exercises582ln[V(n)]V(n)6412Year (n)Figure 1.1: Exponential Growth2520151050252015105000Year (n)Figure 1.2: Log of Exp GrowthKThe two ln( 130 ) terms cancel, leaving exactly the formula for the continuous growthrate between the first and third values, as we derived above.If we carry out the same exercise under simple growth or annually compounded growth,we will find that the average of the individual growth rates will not equal the overallgrowth rate. For example, if GDP grows by 8% this year and 4% next year, both calculated using annual compounding, then the two-year growth rate will not be 6%. (Youshould verify that it will actually be 5.98%.) On the other hand, if the 8% and 4% numberswere calculated using continuous compounding, then the continuous growth rate over thetwo-year period would be 6%.ExercisesExercise 1.1 (Easy)My credit card has an APR (annualized percentage rate) of 16.8%. What is the daily interestrate?Exercise 1.2 (Easy)My loan shark is asking for 25 in interest for a one-week loan of 1,000. What is that, asan annual interest rate? (Use 52 weeks per year.)Exercise 1.3 (Moderate)The Consumer Price Index (CPI) is a measure of the prices of goods that people buy. Biggernumbers for the index mean that things are more expensive. Here are the CPI numbers forfour months of 1996 and 1997:
Preliminaries6VariablePRnVs (n)Va (n)Vt(n)Vc (n)V0DefinitionPrincipal (amount invested)Nominal interest rateNumber of years investedValue after years under simple interestValue after years under annual compoundingValue after years when compounded times peryearValue after years under continuous compoundingInitial value of the investmentnnntnTable 1.1: Notation for Chapter .2Dec158.6161.3What is the growth rate of the CPI between June 1996 and September 1996? (Use a continuous growth rate and annualize your answer.)Exercise 1.4 (Moderate)Use the CPI data from the previous exercise to compute the growth rates in the CPI inthe four quarters starting in March 1996 (i.e, Mar-Jun 1996, Jun-Sep 1996, etc.). (Use acontinuous growth rate but do not annualize your answer.) Show that the sum of thesefour rates equals the (continuous) growth rate from March 1996 to March 1997.Exercise 1.5 (Easy)Real output of the United States will likely grow by about 2% over the first half of thenext century. At that rate (of continuous growth), how long will it take for real output todouble? Compare your exact answer with the approximation given by the “Rule of 72.”2Exercise 1.6 (Hard)This morning you invest 10,000 at 6.5% interest that compounds annually. What is thefirst date on which you would have at least 15,000? (Quote the answer in terms of years days from today. Interest accrues each night, but compounds only annually.)Exercise 1.7 (Easy)Suppose that 4.6 percent of the earth’s forests are cleared each year. How long will it take2 The “Rule of 72” is as follows. If the interest rate on an investment is x percent, then it takes about 72 x yearsfor the value of the investment to double.
Exercises7for half our current forests to be cleared? (Use annual compounding and solve for thefewest number of whole years.)Exercise 1.8 (Moderate)World population was about 679 million in the year 1700 and about 954 million in 1800.1. What was the annual growth rate of population between 1700 and 1800? (Use continuous compounding.)2. Suppose that the human race began with Adam and Eve and that the annual growthrate between 1700 and 1800 prevailed in all years prior to 1700. About when must ithave been that Adam and Eve were evicted from the Garden of Eden? (Hint: Whatwas the population in that year?)Exercise 1.9 (Moderate)According to figures compiled by the World Bank, per capita real income in the U.S. was 15,400 in 1984, while the corresponding figure for Japan was 10,600. Between 1965 and1984, per capita real income in the U.S. grew at an annual rate of 1.7 percent (using annualcompounding), while the corresponding figure for Japan was 4.7 percent.1. If these two growth rates remain constant at their 1965-84 levels, in what year willper capita real income be the same in these two countries? (Again, use annual compounding, and use hundredths of a year.)2. What will be the common per capita real income of these two countries at that date?
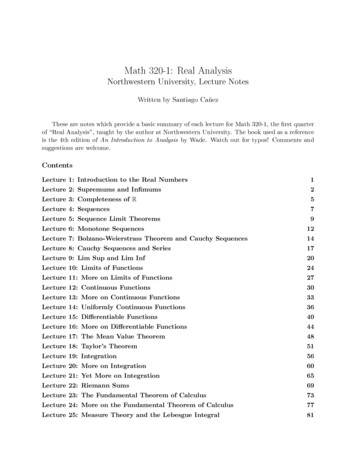
Chapter 2Work Effort, Production, andConsumptionRobinson Crusoe is alone on an island, so he is an economy unto himself. He has preferences over consumption and leisure and can produce consumption goods by using laborand capital. We examine production first. Then we turn to preferences. Putting these twopieces together yields Crusoe’s optimal choices of labor, leisure, and consumption.2.1 Crusoe’s Production PossibilitiesyCrusoe uses factors of production in order to make output . We can think of this output asbeing coconuts. Two common factors of production, and those we consider here, are capitaland labor . Capital might be coconut trees, and labor is the amount of time Crusoe works,measured as a fraction of a day. How much Crusoe produces with given resources dependson the type of technology that he employs. We formalize this production process via aproduction function.klAWe often simplify our problems by assuming that the production function takes some particular functional form. As a first step, we often assume that it can be written: ( ),for some function ( ). This means that as technology increases, Crusoe can get moreoutput for any given inputs. It is reasonable to require the function ( ) to be increasingin each argument. This implies that increasing either input or will increase production.Another common assumption is that output is zero if either input is zero: (0 ) 0 and( 0) 0, for all and .fy Af k; lAk lf k;klff ;lOne functional form that has these properties is the Cobb–Douglas function, for example:
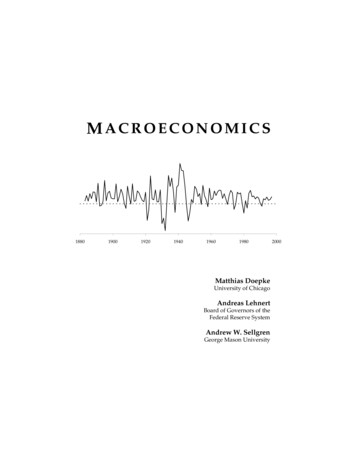
Work Effort, Production, and Consumption10y Ak1 l, for some between zero and one. This particular Cobb-Douglas functionexhibits constant returns to scale, since (1) ( ) 1. Figure 2.1 is a three-dimensionalrendering of this function for particular values of and .A10.610.4product (y)0.800.80.60.40.2000.210.4capital (k)0.60.80.2labor (l)Figure 2.1: Cobb-Douglas ProductionkWe will not be dealing with capital until Chapter 9, so for now we assume that capital isfixed, say, at 1. This simplifies the production function. With a slight abuse of notation,we redefine ( ) and write production as ( ). This is like what Barro uses in Chapter 2.kfy fly Ak lk1If the original production function was Cobb–Douglas, , then under 1 the. The graph of this curve is just a slice through theproduction function becomes: surface depicted in Figure 2.1. It looks like Barro’s Figure 2.1.y AllAs you know, the marginal product of some factor of production (e.g., labor ) is the additional output, or “product”, that results from increasing the input of that factor. Formally,the marginal product of an input is the derivative of the production function with respect to
2.2 Crusoe’s Preferences11dy dl f l 0 ( ).1 Since the marginalthat input. For example, the marginal product of labor is:product is the derivative of the the production function, and the derivative gives the slope,we can read the marginal product as the slope of the production function, as Barro does inhis Figure 2.1.In the particular case where production is Cobb–Douglas (and capital is fixed), the produc1, so the marginal product of labor is: . This is alwaystion function is: positive, as we require, and it decreases as we increase . Accordingly, this production function exhibits diminishing marginal product: the first unit of labor is more productive thanthe tenth unit of labor. Graphing this marginal product equation gives us something likeBarro’s Figure 2.2.y Alldy dl A lBarro talks about improvements in technology and argues how both the production function and the marginal-product schedule shift as a result. The effects of such a change intechnology are clearer when we examine a particular production function. For example,. The improvement in technology means thatconsider our production function: goes up. Accordingly, whatever production was before, it undergoes the same percentageincrease as the increase in . For example, if doubles, then output at each will be double what it used to be. Notably, when is zero, output is zero just as before, since twicezero is still zero. The result is that the production function undergoes a kind of upwardrotation, pivoting about the anchored origin, 0. That is precisely what Barro depicts inhis Figure 2.3.y AlAlAAllWe can examine the marginal-product schedule as well. Under the particular functional1form we are using, the marginal product of labor (MPL) is: . Accordingly,the marginal product at each undergoes the same percentage change as does . Since theMPL is higher at low levels of , the marginal-product curve shifts up more at those levelsof . Refer to Barro’s Figure 2
MACROECONOMICS 1880 1900 1920 1940 1960 1980 2000 MatthiasDoepke UniversityofChicago AndreasLehnert BoardofGovernorsofthe Fe