Transcription
Sales ProductivityBenchmark1
What is it?Environmental Scan of Sales Reveals strength andweakness areas Identifies best return forsales effort Provides sales benchmarksagainst relevant peers Generates improvement recommendations Uses diagnostic techniques and empirical data toimprove accuracy of assessment Relies on best practices for means to close sales gaps22
Sales Force Assessment FrameworkSTEPAccount SegmentationLead ManagementSegment accounts by Ideal Customer ProfileGenerate etPlan3DesignSales ForceSales ProcessMap customer/prospect buying process to custom built sales processChannelsDetermine optimal route to marketSales Force StructureSales Force SizeOrganizational model effectiveness vs. efficiencyMatch selling capacity to market demandSales InfrastructureCreate performance conditions for optimal results3BuildInfrastructure4YOURLOGO
44
Phase 15
Exec InterviewsCEO / CFO / CSO / CMO66Day in the Life of(DILO) reviews
77
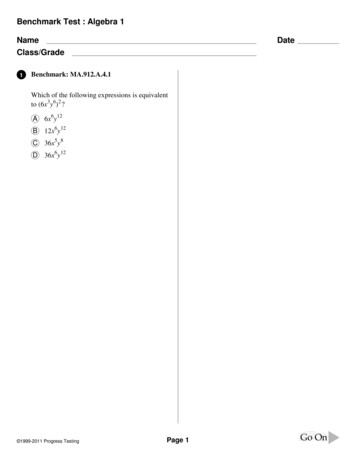
Customer Survey Findings (Trust)Q#10: When you buy these types of services, where do you place your trust?Takeaway MORE economic buyers place their trust in the rep The company itself is of little importance to the decision maker or user Services (offering maintenance) are what user buyers primarily trust8
Customer Survey Findings (Frequency)Q#17: How often do you communicate with your sales representative?Takeaway The communication frequency is surprisingly low for a community of buyers whodesire F2F interaction with their vendor Over 50% of EBs communicated with their reps quarterly or LESS frequently9
Customer Survey Findings (Mode)Q#16: Which method of engagement do you prefer with your sales rep?Takeaway Established customers prefer F2F interaction, even for follow-on procurements10
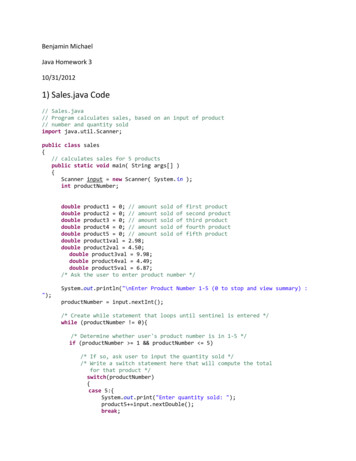
Sales Rep Survey#3: Within your existing accounts how many accounts havebought from you within the last 18 months?Takeaway Increased acct mgmt activity supports increased customer value; closing thegap of 24% between Acme Inc. & WC11
Sales Rep Time Study12
Phase 213
Sales Management Maturity ModelCapabilityLevel 2:DefinedLevel 1:Chaos- Ad Hoc Efforts- Ill-defined processes- Unpredictable resultLevel 3:Reportable- Adopted Processes- Documented Process- Not fully adopted- Some Repeatability- Varied Success- Limited Perf Tracking- Behavior changing- Limited Predictability- Lagging IndicatorsLevel 4:Managed- Leading Indicators- Early ProblemDetection- Best Practices- ContinuousImprovement beginsLevel 5:Predictable- Predictable Results- Change tolerant- Exceed World-Class- External BenchmarkMaturity14
Phase 2Best Practices Artifacts15
Phase 316
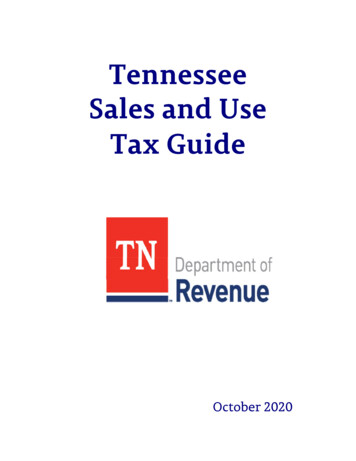
Recommendation: 4 focus areasDegree of DifficultyPhase 3VeryHighChannelOptimizationPhase 2Key AccountManagementSalesPerformanceManagementPhase 1Sales Mgr andSales RepTalent DevHighSales oderateFocus AreaOrg ChangeManagementHighSales ManagerAssessmentMediumValue18Low
Action Plan19
Assessment Summary 20Diagnosis: 24 metric benchmark 3 Day in the Life of (DILO) sales rep ride-alongs Sales rep survey Customer Survey 6 face-to-face executive interviews Mystery Shop sales team and (3) competitors Documentation review Expert panelOutput: Capture current state Show end state possibilities Make Recommendations Quantify impactDuration: 6-10 weeks
21
Uses diagnostic techniques and empirical data to . Map customer/prospect buying process to custom built sales process Develop Sales Strategy STEP 1. 4 4. 5 Phase 1 . 6 . closing the gap of 24% between Acme Inc. & WC Sales Rep Survey . 1