Transcription
Atmos. Chem. Phys., 21, 16413–16425, 2021https://doi.org/10.5194/acp-21-16413-2021 Author(s) 2021. This work is distributed underthe Creative Commons Attribution 4.0 License.Mapping gaseous dimethylamine, trimethylamine, ammonia,and their particulate counterparts in marine atmospheresof China’s marginal seas – Part 1: Differentiatingmarine emission from continental transportDihui Chen1 , Yanjie Shen1 , Juntao Wang1 , Yang Gao1,2 , Huiwang Gao1,2 , and Xiaohong Yao1,21 KeyLaboratory of Marine Environment and Ecology, and Frontiers Science Center for Deep Ocean Multispheres and EarthSystem, Ministry of Education, Ocean University of China, Qingdao 266100, China2 Laboratory for Marine Ecology and Environmental Science, Qingdao National Laboratory for Marine Science andTechnology, Qingdao 266237, ChinaCorrespondence: Xiaohong Yao (xhyao@ouc.edu.cn)Received: 25 March 2021 – Discussion started: 12 May 2021Revised: 26 September 2021 – Accepted: 1 October 2021 – Published: 9 November 2021Abstract. To study sea-derived gaseous amines, ammonia, and primary particulate aminium ions in the marineatmosphere of China’s marginal seas, an onboard URG9000D Ambient Ion Monitor-Ion Chromatograph (AIMIC, Thermo Fisher) was set up on the front deck of theR/V Dongfanghong-3 to semi-continuously measure the spatiotemporal variations in the concentrations of atmospherictrimethylamine (TMAgas ), dimethylamine (DMAgas ), andammonia (NH3gas ) along with their particulate matter(PM2.5 ) counterparts. In this study, we differentiated marineemissions of the gas species from continental transport usingdata obtained from 9 to 22 December 2019 during the cruiseover the Yellow and Bohai seas, facilitated by additionalshort-term measurements collected at a coastal site near theYellow Sea during the summer, fall, and winter of 2019.The data obtained from the cruise and coastal sites demonstrated that the observed TMAgas and protonated trimethylamine (TMAH ) in PM2.5 over the Yellow and Bohai seasoverwhelmingly originated from marine sources. During thecruise, no significant correlation (P 0.05) was observedbetween the simultaneously measured TMAH and TMAgasconcentrations. Additionally, the concentrations of TMAH in the marine atmosphere varied around 0.28 0.18 µg m 3(average standard deviation), with several episodic hourlyaverage values exceeding 1 µg m 3 , which were approximately 1 order of magnitude larger than those of TMAgas(approximately 0.031 0.009 µg m 3 ). Moreover, there wasa significant negative correlation (P 0.01) between theconcentrations of TMAH and NH4 in PM2.5 . Therefore,the observed TMAH in PM2.5 was overwhelmingly derived from primary sea-spray aerosols. Using TMAgas andTMAH in PM2.5 as tracers for sea-derived basic gasesand sea-spray particulate aminium ions, the values of nonsea-derived DMAgas , NH3gas , and non-sea-spray particulateDMAH in PM2.5 were estimated. The estimated averagevalues of each species contributed 16 %, 34 %, and 65 %of the observed average concentrations for non-sea-derivedDMAgas , NH3gas , and non-sea-spray particulate DMAH inPM2.5 , respectively. Uncertainties remained in the estimations, as TMAH may decompose into smaller molecules inseawater to varying extents. The non-sea-derived gases andnon-sea-spray particulate DMAH likely originated fromlong-range transport from the upwind continents based onthe recorded offshore winds and increased concentrations ofnon-sea-salt SO4 2 (nss-SO4 2 ) and NH4 in PM2.5 . Thelack of a detectable increase in particulate DMAH , NH4 ,and nss-SO4 2 concentrations in several SO2 plumes did notsupport the secondary formation of particulate DMAH inthe marine atmosphere.Published by Copernicus Publications on behalf of the European Geosciences Union.
16414 D. Chen et al.: Mapping gaseous dimethylamine, trimethylamine, ammonia, and their particulate counterparts1IntroductionGaseous amines and their particulate counterparts are vitalfor reduced nitrogen compounds in the marine atmosphere(Facchini et al., 2008; Müller et al., 2009; Hu et al., 2015,2018; van Pinxteren et al., 2015, 2019; Yu et al., 2016; Xie etal., 2018; Zhou et al., 2019) and are primarily derived fromseawater, where glycine betaine (GBT), trimethylamine Noxide (TMAO), and choline are the three major precursors(Burg and Ferraris, 2008; Lidbury et al., 2015a, b; Jamesonet al., 2016; Taubert et al., 2017). GBT, TMAO, and cholineare critical for maintaining the osmotic pressure in marineorganisms. When released into the environment, they canbe degraded by bacteria to trimethylamine (TMA), dimethylamine (DMA), or methylamine (MA) (Lidbury et al., 2015a,b). Gaseous DMA, TMA, and MA may be vital in the formation of secondary particles in the atmosphere by nucleation(Almeida et al., 2013; Chen et al., 2016; Yao et al., 2018; Zhuet al., 2019). In addition to biogenic amines, anthropogenicemissions are known as important sources of amines in thecontinental atmosphere but not in the marine atmosphere (Geet al., 2011). Modeling studies have shown that the continental amine species in the gas and/or particle phases canbe transported regionally, including downwind marine atmospheres (Yu and Luo, 2014; Mao et al., 2018). Simultaneousreal-time measurement of gaseous amines and their particulate counterparts in the marine atmosphere over the oceanremains challenging because of artifact signals related toself-vessel emissions and amine-containing dew evaporation;however, this is not the case in the continental atmosphere(VandenBoer et al., 2011). The lack of direct measurementsrestricts the determination of their sources and the relationship between the reduced nitrogen compounds and acid–baseneutralization reactions in the marine atmosphere.Reduced nitrogen compounds in the ocean can finally decompose into ammonium ions (NH4 ) and other smallermolecules. NH4 in surface seawater releases into the marine atmosphere as atmospheric ammonia (NH3gas ) under favorable conditions (Johnson et al., 2008; Carpenter et al.,2012; Paulot et al., 2015). The ocean is an important sourceof NH3gas , contributing approximately 40 % of the naturalNH3 emissions on Earth (Carpenter et al., 2012; Paulot etal., 2015). In the literature, large uncertainties remain in estimating NH3 emissions from the ocean; for example, theannual emission flux ranges from 2 to 23 Tg N a 1 (Clarkeand Porter, 1993; Dentener and Crutzen, 1994; Sutton et al.,2013; Paulot et al., 2015). These uncertainties are primarilyderived from two factors: (1) the major marine sources ofNH3gas are still disputed, such as seawater, seabirds, or thephotolysis of marine organic nitrogen at the ocean surfaceor in the atmosphere; (2) direct NH3gas observations in marine atmospheres are restricted as onboard ambient NH3gasmeasurement techniques sometimes suffer from large artifacts from NH3gas contamination associated with onboardhuman activities, dew evaporation, and water vapor interferAtmos. Chem. Phys., 21, 16413–16425, 2021ence (Quinn et al., 1990; Clarke and Porter, 1993; Johnson etal., 2008; Keene et al., 2009; Wentworth et al., 2016; Tenget al., 2017). Additionally, the long-range transport of atmospheric NH3gas from the continent may also complicatethe source analysis of NH3gas in marine atmospheres (McNaughton et al., 2004; Uematsu et al., 2004; Zhao et al.,2015; Lutsch et al., 2016).To identify and characterize sea-derived gaseous amines,ammonia, and sea-spray particulate aminium ions as well assecondary particulate aminium ions from continental transport in the atmospheres of China’s marginal seas, we conducted two cruise campaigns: one over the Yellow and Bohaiseas in China from 9 to 22 December 2019 (Campaign A)and another over the Eastern China and Yellow seas from27 December 2019 to 16 January 2020 (Campaign B). Winter cruise campaigns provide great opportunities for observational studies due to the following: (1) higher concentrations of nutrients in the seas at lower sea surface watertemperatures, which may favor higher primary production(Guo et al., 2020) and subsequently increase marine emissions of gaseous amines and/or aminium-containing seaspray aerosols; (2) periodically enhanced air–sea exchangesdriven by the strong winter Asian monsoon every 4–10 d(Zhu et al., 2018); (3) periodically enhanced long-rangetransport of anthropogenic pollutants from continents to theseas, which may enhance the formation of secondary ammonium and aminium aerosols (Guo et al., 2016; Yu et al., 2016;Xie et al., 2018; Wang et al., 2019).In this study, an onboard URG-9000D Ambient IonMonitor-Ion Chromatograph (AIM-IC, Thermo Fisher) instrument was used to simultaneously measure the spatiotemporal variations in the concentrations of gaseous aminesand NH3gas along with their counterparts in PM2.5 . Semicontinuous measurement data were analyzed to identify thestudy targets. This study was divided into two parts. In thissection, we distinguish the marine sources from the continental transport of reduced nitrogen compounds in marine atmospheres and subsequently quantify each contribution to theobserved species during the 9–22 December 2019 campaign.In the companion paper (Gao et al., 2021), we analyzed thespatiotemporal heterogeneity and related causes and subsequently delivered a hypothesis regarding the marine emissions of reduced nitrogen compounds using the data from thetwo campaigns and an additional cruise campaign previouslyreported by Hu et al. (2015).22.1ExperimentalSampling periods, locations, and instrumentsCampaign A was conducted from 9 to 19 December 2019on the R/V Dongfanghong-3 with a displacement tonnageof 5000. The research vessel was still within its testing period and used state-of-the-art combustion technology withhttps://doi.org/10.5194/acp-21-16413-2021
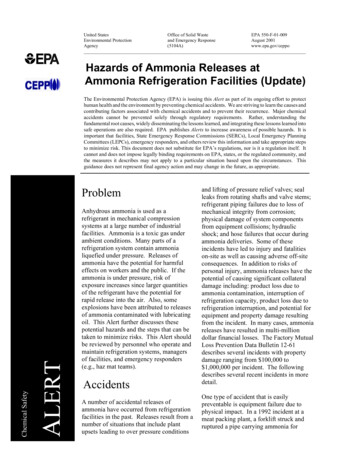
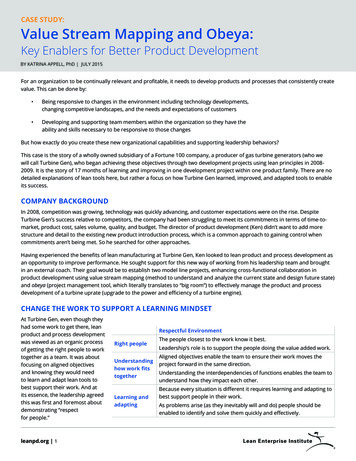
D. Chen et al.: Mapping gaseous dimethylamine, trimethylamine, ammonia, and their particulate counterparts 16415low-sulfur diesel. Campaign B started from 27 December2019 to 17 January 2020 and was organized by another research team. During 20–22 December, the vessel was anchored at the port while the sampling continued. The 44 hwere referred to as the transition period between campaignsA and B. A standard-sized air-conditioned container was setup on the front deck to house a suite of instruments including the AIM-IC, a fast-mobility particle sizer (FMPS, Tsi), acloud condensation nuclei counter (CCN-100, Droplet MT),and a single-particle aerosol mass spectrometer (SPAMS 05,Hexin). No human activities occurred on the front deck during cruising, excluding anchoring at the port. Even during theanchoring period, human activity on the front deck was rare.The use of the container on the front deck effectively minimized the self-vessel contamination by NH3gas and gaseousamines. The front deck was approximately 10 m a.s.l., andthe container height was 2.8 m.To ensure that the onboard AIM-IC was operated properly,it was housed in a mobile air-conditioned mini-container,which was further placed in a standard container with a 1 mstainless steel sampling probe connected to the ambient air.The inlet of the sampling probe extended from the top cornerof the standard container facing the sea. The AIM-IC consistsof two major parts: an ambient air sampling system and anion chromatography analysis system. For the sampling system, the AIM-IC was equipped with a PM2.5 cyclone and operated at a rate of 3 L min 1 . The sampled gases and particlesin the water solution were stored in two syringes prior to theirinjection for analysis. The ion chromatography analysis system measured the semi-continuous concentrations of chemically reactive gases. These included NH3gas , gaseous amines,and acidic gases such as SO2 and HNO3 , along with theirparticulate counterparts, at a temporal resolution of 1 h. Thisfacilitated the identification of possible interference from onboard dew evaporation, which typically occurs with sunrise(Teng et al., 2017).An automatic weather system providing real-time meteorological data is available on the R/V Dongfanghong-3.The heading wind was corrected to determine the true windspeed and direction. The surface seawater temperature wasnot measured during this cruise campaign and typically hada delay of a few hours compared to the ambient air temperature (Deng et al., 2014).On 1–9 August, 12 September to 1 October, and 16November to 1 December 2019, the AIM-IC was set up ata coastal site in Qingdao (36.34 N, 120.67 E) to conductroutine measurements (Fig. 1). Coastal measurement datawere obtained from 2 weeks to 4 months before the winter cruise campaign. The sampling site was located in a newhigh-technology zone near the Yellow Sea, with the shortestdistance from the sea being approximately 1 km in the south.The AIM-IC was housed in a research lab on the fifth floor ofa building, approximately 16 m a.g.l. The sampling probe extended out of the window and was directly connected to theambient air. Typically, higher biogenic emissions of trogen compounds over the continents are expected in thesummer than in the winter owing to the temperature effect(Yu et al., 2016; Teng et al., 2017).2.2Chemical analysisThe AIM-IC includes an ICS-1100 ion chromatograph,wherein an analytical column (Ion Pac CS17A – 2 250 mm)was used to measure cations, including Na , NH4 , protonated dimethylamine (DMAH ), and protonated trimethylamine (TMAH ), and an AS11-HC (2 50 mm) was used tomeasure anions, including SO4 2 , NO3 , Cl , and organicions. Methanesulfonic acid solution (5 mM) was used as theeluent for cation analysis, while potassium hydroxide solution (varying from 3 to 40 mM) was used as the gradienteluent for anion analysis. Each analysis took 26–28 min toobtain a complete ion spectrum. The volume of the injectionloop installed on the low-pressure valve was 250 µL, whichsubstantially reduced the limits of detection for all ions. Thelimits of detection for NH4 , DMAH , and TMAH were0.0004, 0.004, and 0.002 µg m 3 , respectively, in ambientair. The limits of detection for NO3 and SO4 2 were 0.05and 0.015 µg m 3 , respectively, in ambient air. The ICS-1100was calibrated onboard prior to obtaining regular measurements, and the second calibration was conducted when thevessel was anchored at the port. The AIM-IC analysis wasnot affected by ambient water vapor, as the device directlymeasured the ions. Detailed information regarding the AIMIC analysis is provided in Teng et al. (2017) and Xie et al.(2018). Notably, strong K interference occurred unexpectedly and occasionally and then disappeared during differentcampaigns. When the interference occurred, DMAH andTMAH were undetectable because of the increased baseline at the corresponding residence time in the ion chromatograph (Fig. S1 in the Supplement); consequently, somePM2.5 DMAH and TMAH concentration data are unavailable in Fig. 1. However, the concentrations of gaseous amineswere still detected correctly, with a low baseline at the residence. K interference remains to be investigated. Additionally, a few surface seawater samples were collected from different sea zones. The NH4 and aminium ion concentrationsin the samples were not measured, as the analytical methodswere still hindered by high sea-salt ion contents.33.1ResultsTemporal variations in the concentrations of basicgases and their PM2.5 counterparts in the coastalatmosphereBefore analyzing the basic gases and their counterparts inthe marine atmosphere, we initially presented their continental concentrations at the coastal site facing the Yellow Sea asimportant evidence to facilitate the analysis of the contributors to these species in the marine atmosphere. Figure 1aAtmos. Chem. Phys., 21, 16413–16425, 2021
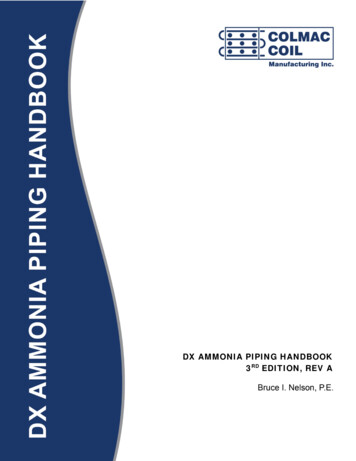
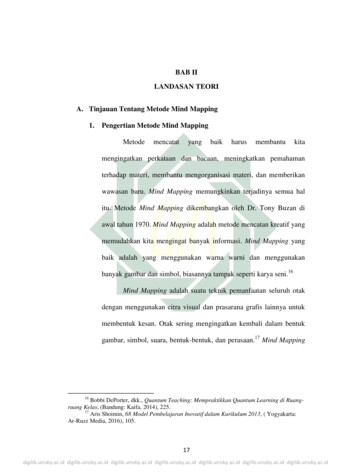
16416 D. Chen et al.: Mapping gaseous dimethylamine, trimethylamine, ammonia, and their particulate counterparts[DMAgas ] 5.6 10 3 [NH3gas ] (R 2 0.79, P 0.01)and [DMAH ]PM2.5 5.9 10 3 [NH4 ]PM2.5 (R 2 0.84, P 0.01). Generally, the DMAgas and DMAH concentrations were approximately 1/200 of those of the corresponding NH3gas and NH4 .3.2Figure 1. Temporal variations in the concentrations of NH3gas ,gaseous amines, and their counterparts in PM2.5 at a coastal siteduring three seasons of 2019. (a) NH3gas and gaseous amines; (b)counterparts in PM2.5 ; wind speed and direction superimposed onthe top of (a); a map of the sampling site superimposed on (b); themissing data regarding aminium ions in the PM2.5 shading in thegray shadow were due to occasional K interference (b).and b show that the TMAgas and TMAH concentrations inPM2.5 were mostly below the detection limit, varying at approximately 0.001 0.001 µg m 3 (average standard deviation), regardless of the presence of offshore or onshorewinds during short-term measurements in the three seasonsof 2019. The DMAgas and DMAH concentrations varied at0.018 0.021 and 0.017 0.013 µg m 3 , respectively, whichwere approximately 1 order of magnitude larger than those ofTMAgas and TMAH . TMAgas and TMAH concentrationsin the upwind continental and coastal atmospheres were substantially lower than those reported in the literature, by up toa few tens of ng m 3 (Ge et al., 2011). However, Gibb et al.(1999) reported a low average TMAgas (0.5 ng m 3 ) and particulate TMAH (0.5 ng m 3 ) in the marine atmosphere overthe Arabian Sea on 16 November to 19 December 1994. Xieet al. (2018) reported that TMAH concentrations were comparable to those of DMAH in atmospheric particles collected at two other coastal sites located approximately 20 kmfrom the study area, as listed in Table S1 in the Supplement.The cause of this change is beyond the scope of this studybut may be due to the large decrease in manure application,based on our recent survey in the Qingdao area.The DMAgas and DMAH concentrations in PM2.5 withoffshore winds from the north were substantially higherthan those with onshore winds from the south or southeast (top of Fig. 1a), suggesting that their continental emissions and related secondary sources were stronger. Moreover,the concentrations of DMAgas and DMAH were moderately correlated with those of NH3gas and NH4 , namely,Atmos. Chem. Phys., 21, 16413–16425, 2021Spatiotemporal variations in the concentrations ofbasic gases over the seasThroughout Campaign A, the TMAgas concentrations varied at approximately 0.031 0.009 µg m 3 (Fig. 2a–c), withthree peaks occurring at 4–5 d intervals (gray shadowing inFig. 2c). Peaks 1 and 2 were generally associated with offshore winds, while peak 3 was mostly associated with onshore winds (Fig. 2b). The peaks lasted from tens to dozensof hours and were not induced by the onboard dew evaporation at sunrise. For example, the highest value (0.060 µg m 3 )occurred at 23:00 LT (local time; UTC 08:00) on 16 December. The observed TMAgas concentrations were 1 orderof magnitude higher than those measured in the coastal atmosphere during the summer, fall, and winter. This suggestedthat the TMAgas observed during Campaign A was largelyderived from marine sources rather than from long-rangecontinental transport. The same conclusion can be drawn byanalyzing the three peaks of TMAgas and its temporal variations during the port-anchoring period. For example, during peak 1 (Fig. 2a), the concentrations of TMAgas increasedby approximately 100 % from 20:00 LT on 9 December to11:00 LT on 10 December, with an approximately 30 % decrease in the non-sea-salt SO4 2 (nss-SO4 2 ) concentration(from 22 to 16 µg m 3 ; Fig. 2b). Moreover, the peaks in theTMAgas concentrations corresponded to troughs in the nssSO4 2 concentrations during peak 3, as shown in Fig. 2cand d. The self-vessel emissions of nss-SO4 2 in PM2.5 werenegligible because of the use of low-sulfur diesel, which isdiscussed later. The increased nss-SO4 2 concentrations inPM2.5 may be a good indicator of continental transport andvice versa.The concentrations of DMAgas varied at approximately0.006 0.006 µg m 3 (Fig. 2d) and were significantly higherthan those of TMAgas (P 0.01). Unlike TMAgas , continental transport was likely an important contributor to theDMAgas and NH3gas observed in the marine atmosphere, particularly during peak 1, when higher nss-SO4 2 concentrations were observed in PM2.5 (Fig. 2c–e). The DMAgas andNH3gas concentrations were negatively correlated with thoseof TMAgas during peak 1, namely, R 2 0.35 (P 0.01)between TMAgas and DMAgas and R 2 0.17 (P 0.01)between TMAgas and NH3gas . This suggested that most ofthe DMAgas and NH3gas were likely derived from continental transport rather than marine sources. During peak 2, increased TMAgas , DMAgas , and NH3gas concentrations wereconcurrently observed with increasing nss-SO4 2 concentrations, suggesting that both marine emissions and continental transport simultaneously contributed to the observedhttps://doi.org/10.5194/acp-21-16413-2021
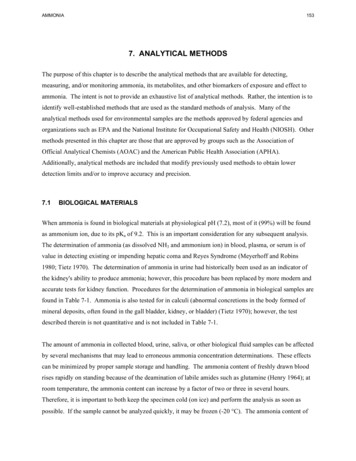
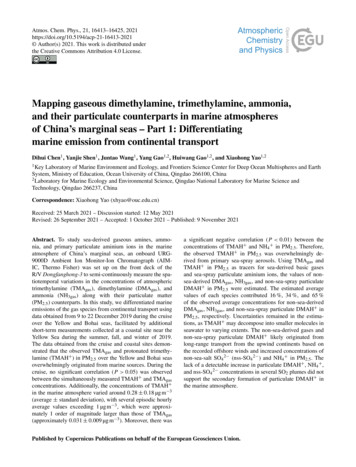
D. Chen et al.: Mapping gaseous dimethylamine, trimethylamine, ammonia, and their particulate counterparts 16417Figure 2. Spatiotemporal variations in the concentrations of basic gases and other parameters during cruise campaigns in the Yellow andBohai seas on 9–22 December 2019. (a) Mapping TMAgas by concentration; (b) mapping onboard recorded wind speeds and directions;time series of (c) TMAgas , (d) DMAgas , (e) NH3gas , and (f) ambient air temperature recorded onboard. The time series of nss-SO4 2 inPM2.5 were shown as indicators of anthropogenic air pollutants in (d); not all data were shown in (b) to avoid clustering.DMAgas and NH3gas . During the port-anchoring period from20 to 22 December, the DMAgas and NH3gas concentrations varied slightly and were moderate and low, respectively.However, the TMAgas concentrations continuously increasedby over 100 % as the ambient temperature increased (Fig. 2cand f). Additionally, the nss-SO4 2 concentrations of PM2.5varied greatly and followed a bell-shaped pattern during theport-anchoring period.Additionally, the NH3gas concentrations varied at approximately 0.53 0.53 µg m 3 from 9 to 22 December. The variation narrowed to approximately 0.24 0.07 µg m 3 duringthe port-anchoring period from 20 to 22 December. Whenthe data during Campaign A were used for the analysis,the NH3gas concentrations were significantly correlated withthose of DMAgas , namely, [DMAgas ] 9.2 10 3 [NH3gas ](R 2 0.71, P 0.01). However, there was no correlationbetween NH3gas and TMAgas concentrations.3.3Spatiotemporal variations in the aminium andNH4 ion concentrations of PM2.5 over the seasFigure 3a–f show the spatiotemporal variations in theTMAH , DMAH , and NH4 concentrations of PM2.5throughout Campaign A from 9 to 22 December, during which the TMAH concentrations varied greatlyat approximately 0.28 0.18 µg m 3 . However, they narrowed at approximately 0.21 0.04 µg m 3 during the portanchoring period. The TMAH concentrations generally inhttps://doi.org/10.5194/acp-21-16413-2021creased from 0.13 0.05 µg m 3 on 9 December to 0.46 0.05 µg m 3 on 16 December (Fig. 3a) and subsequentlydecreased to approximately 0.2 µg m 3 thereafter, excluding some strong peaks from 0.62 to 1.24 µg m 3 at 03:00–05:59 LT and from 1.02 to 1.81 µg m 3 at 14:00–16:59 LTon 18 December (gray shadowing representing peak 4 inFig. 3a–d). The peaks reproduced the episodes observed inthe marine atmosphere over the Yellow Sea in May 2012 (Huet al., 2015) and were repeatedly observed during CampaignB (Gao et al., 2021). However, they were not observed inseveral other marine cruise campaigns conducted across themarginal seas of China and the northwestern Pacific Ocean(Hu et al., 2018; Xie et al., 2018).As the TMAH concentrations were approximately 2 orders of magnitude higher than those observed at the coastalsite during the three seasons of 2019, the observed TMAH was largely derived from marine sources. The TMAH concentrations followed a spatiotemporal pattern that clearly differed from those of DMAH and NH4 , while the latter twoions exhibited a similar spatiotemporal pattern during mostperiods of Campaign A (Fig. 3a–c). A significant negativecorrelation (P 0.01) was observed between the concentrations of TMAH and NH4 in PM2.5 (not shown). The spatiotemporal pattern of the TMAH concentration also significantly differed from those of nss-SO4 2 (Fig. 2d) andSO2 (Fig. 3b), which are regarded as tracers of long-rangetransported continental pollutants and fresh-vessel plumes.Atmos. Chem. Phys., 21, 16413–16425, 2021
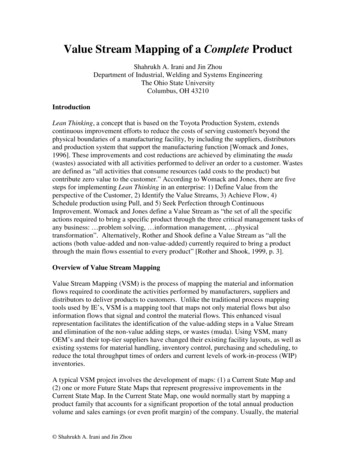
16418 D. Chen et al.: Mapping gaseous dimethylamine, trimethylamine, ammonia, and their particulate counterpartsFigure 3. Spatiotemporal variations in the aminium ions and NH4 concentrations of PM2.5 and other parameters during cruise campaignsover the Yellow and Bohai seas on 9–22 December 2019 (time series of (a) TMAH , (b) DMAH , and (c) NH4 in PM2.5 ; (d) wind speeds(WS); (e) mapping of the TMAH in concentration; (f) mapping of the NH4 concentration. The time series of SO2 is shown as an indicatorin (b); that of Na in PM2.5 is shown as an indicator of sea-spray aerosols in (c). To better show the spatiotemporal distributions of TMAH and NH4 during peaks 1, 2, and 4, only the data during periods shaded in (a–d) were used in (e) and (f) to avoid clustering).For example, extremely strong TMAH peaks occurred concurrently with low nss-SO4 2 , NH4 , and SO2 concentrations accompanied by high Na concentrations under highwind speeds, which are common indicators of sea-sprayaerosols (Feng et al., 2017). Moreover, the TMAH concentrations were approximately 1 order of magnitude largerthan those of TMAgas , and no significant correlation was observed between them (P 0.05). This suggests that the observed TMAH may not be derived from the neutralizationreactions of TMAgas with acids in the marine atmosphereand may have been derived from primary sea-spray organicaerosols (Hu et al., 2015, 2018). Primary sea-spray organicaerosols mainly contain primary and degraded biogenic organics (Ault et al., 2013; Prather et al., 2013; Quinn et al.,2015; Dall’Osto et al., 2019).The DMAH concentrations varied at approximately0.065 0.068 µg m 3 from 9 to 22 December; however, theyvaried at approximately 0.10 0.04 µg m 3 during the portanchoring period. The 25th percentile value of DMAH during Campaign A was 0.021 µg m 3 , suggesting a low background concentration in the marine area. The DMAH concentrations were significantly correlated with those of NH4 (R 2 0.71, P 0.01; data not shown). When the data obtained at 03:00–05:59 LT and 14:00–16:59 LT on 18 December (strong peaks of TMAH with a simultaneous increasein DMAH ) were removed for correlation, the R 2 value im-Atmos. Chem. Phys., 21, 16413–16425, 2021proved to 0.78. Unlike TMAH , the observed DMAH mayhave been partially derived from acid–base neutralization reactions in the ambient air in addition to the primary sea-sprayorganic aerosols. For example, a large increase in DMAH concentrations occurred concurrently with strong peaks inthe TMAH concentrations (gray shadowed peak 4 in Fig. 3aand b).The NH4 concentrations of PM2.5 varied greatly at approximately 4.7 7.2 µg m 3 during Campaign A (Fig. 3c).However, the 25th percentile values were as low as0.21 µg m 3 , suggesting low marine background values. The50th percentile value was also only 1.2 µg m 3 , which wasconsiderably smaller than the average owing to the presence of strong peaks in NH4 concentrations. The increasedNH4 concentrations associated with NO3 and nss-SO4 2 during Campaign A were likely due to the long-range transport from the upwind continents.44.1DiscussionEffects of temperature on the observed basic gasesin the marine atmosphereAs mentioned above, the observed TMAgas likely originated from marine sources. We plotted the concentrations ofTMAgas against the ambient air temperature (T ) in Fig. 4a,https://doi.org/10.5194/acp-21-16413-2021
D. Chen et al.: Mapping gaseous dimethylamine, trimethylamine, ammonia, and their particulate counterparts 16419Figure 4. Correlations between the concentrations of basic gases and ambient temperature. (a) TMAgas ; (b) DMAgas ; (c) NH3 . The coloredbar represents different wind speeds; full symbols represent the data observed throughout the campaign, excluding the period from 15:00 LTon 16 December to 01:00 LT on 19 December 2019.which generally increased with increasing T . We further separated the average hourly wind speed (WS) into three categories: WS 5.0, 5.0 WS 9.0, and WS 9.0 m s 1 . AtWS 9.0 m s 1 , the data obtained from 15:00 LT on 16 December to 01:00 LT on 19 December, including peaks 3 and4, were separately considered as half-full symbols in Fig. 4a.The concentrations of TMAgas (half-full symbols) generally exceeded those of the other gases at the same T , withwhich they exhibited a moderately good exponent correlation([TMAgas ] 0.03 e0.04T with R 2 0.72). From 15:00 LTon 16 December to 01:00 LT on 19 December, stronger emission potentials of TMAgas to the marine atmosphere were expected in the corresponding marine zone. However, the measured concentrations of TMAH and seawater pH in surfaceseawater are required to confirm this.Following the same approach, the DMAgas and NH3gasconcentrations were plotted against T , as shown in Fig. 4band c, respectively. These values generally increased with increasing T . The NH3gas concentrations (half-full symbols)were strongly correlated with T ([NH3gas ] 0.05 e0.3Twith R 2 0.96). As lower concentrations of nss-SO4 2 ,NH4 , and SO2 were generally observed simultaneously, thecontinental transport of NH3gas was greatly reduced; therefore, the observed NH3gas was mainly derived from the seas.Therefore, the seas were the net source of NH3gas at thetime of measurement. However, at the same T , the NH3gasconcentrations (half-full symbols) were generally
The data obtained from the cruise and coastal sites demon-strated that the observed TMAgas and protonated trimethy-lamine (TMAHC) in PM2:5 over the Yellow and Bohai seas overwhelmingly originated from marine sources. During the cruise, no significant correlation (P 0:05) was observe