Transcription
PSY 307 – Statistics for theBehavioral SciencesChapter 2 – Describing Data withTables and Graphs
Frequency Distributions{One of the simplest forms ofmeasurement is countingz{How many people show acharacteristic, have a given value orare members of a category.Frequency distributions count howmany observations exist for eachvalue for a particular variable.
Frequency Table{A frequency table is a collection ofobservations:zz{{Sorted into classesShowing the frequency for each class.A “class” is a group of observations.When each class consists of a singleobservation, the data is consideredto be ungrouped.
Creating a Table{{List the possible values.Count how many observations existfor each possible value.z{One way to do this is using hash-marksand crossing off each value.Figure out the correspondingpercent for each class by dividingeach frequency by the total scores.
Unorganized Data1, 5, 3, 3, 6, 2, 1, 5, 2, 1, 2, 6, 3,4, 1, 6, 2, 4, 4, 2{A set of observations like this isdifficult to find patterns in orinterpret.
Example
When to Create Groups{{{Grouping is a convenience thatmakes it easier for people tounderstand the data.Ungrouped data should have 20possible values or classes (not 20scores, cases or observations).Identities of individual observationsare lost when groups are created.
Guidelines for Grouping{{{{See pgs 29-30 in text.Each observation should be includedin one and only one class.List all classes, even those with 0frequency (no observations).All classes with upper & lowerboundaries should be equal inwidth.
Optional Guidelines{All classes should have an upperand lower boundary.z{Select an interval (width) that isnatural to think about:z{{Open-ended classes do occur.5 or 10 are convenient, 13 is notThe lower boundary should be amultiple of class width (245-249).Aim for a total of about 10 classes.
Gaps Between Classes{{With continuous data, there is animplied gap between where oneboundary ends and the other starts.The size of the gap equals one unitof measurement – the smallestpossible difference between scores.z{That way no observations can ever fallwithin that gap.Class sizes account for this.
Relative Frequency{{{Relative frequency – frequency ofeach class as a fraction (%) of thetotal frequency for the distribution.Relative frequency lets you comparetwo distributions of different sizes.Obtain the fraction by dividing thefrequency for each group by thetotal frequencyzTotal 1.00 (100%)
Example4/20 .20 or 20%5/20 .25 or 25%3/20 .15 or 15%3/20 .15 or 15%2/20 .10 or 10%3/20 .15 or 15%Total 20Total 1.0or 100%
Cumulative Frequency{{{Cumulative frequency – the totalnumber of observations in a classplus all lower-ranked classes.Used to compare relative standingof individual scores within twodistributions.Add the frequency of each class tothe frequencies of those below it.
Relative Frequency (Percent) andCumulative Frequency
Cumulative Proportion (Percent){The cumulative proportion orpercent is the relative cumulativefrequency.z{{Percent proportion x 100It allows comparison of cumulativefrequencies across two distributions.To obtain cumulative proportionsdivide the cumulative frequency bythe total frequency for each class.zHighest class 1.00 (100%)
Percentile Ranks{{Percentile rank – percent ofobservations with the same or lowervalues than a given observation.Find the score, then use thecumulative percent as the percentilerank:zzExact ranks can be found fromungrouped data.Only approximate ranks can be foundfrom grouped data.
Qualitative Data{Some categories are ordered (canbe placed in a meaningful order):z{{Military ranks, levels of schooling(elementary, high school, college)Frequencies can be converted torelative frequencies.Cumulative frequencies only makesense for ordered categories.
Interpreting Tables{First read the title, column headingsand any footnotes.z{{Where do the data come from, source?Next, consider whether the table iswell-constructed – does it follow thegrouping guidelines.Finally, look at the data and thinkabout whether it makes sense.zFocus on overall trends, not details.
Histograms{{{{{For quantitative data only.Equal units across x axis representgroups.Equal units across y axis representfrequency.Use wiggly line to show breaks inthe scale.Bars are adjacent – no gaps.
Histogram Applets{http://www.stat.sc.edu/ g/interactivate/activities/histogram/?version 1.6.0 11&browser MSIE&vendor Sun Microsystems Inc.z{{Uses Old Faithful geyser dataUses math SAT dataNotice that “bin width” refers to class orinterval size.SPSS automatically creates classes orintervals.
Frequency Polygons{{{{Also called a line graph.A histogram can be converted to afrequency polygon by connectingthe midpoints of the bars.Anchor the line to the x axis atbeginning and end of distribution.Two frequency polygons can besuperimposed for comparison.
Creating a Line Graph from aHistogram
Stem-and-Leaf Displays{Constructing a display:zzz{{Notice the highest and lowest 10sArrange 10s in ascending order.Copy right-hand digits as leaves.The resulting display resembles afrequency histogram.Stems are whatever digits makesense to use.
SampleStem and leaf display showing the number of passingtouchdowns.3 23372 0011122238891 2244456888899
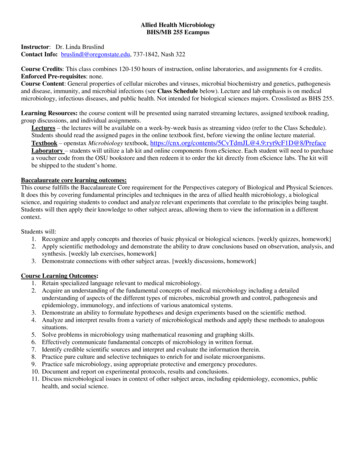
The Best Graph Every DrawnSource: http://strangemaps.wordpress.com/
Details About the Graph{{The map was the work of Charles Joseph Minard (17811870), a French civil engineer who was an inspectorgeneral of bridges and roads, but whose mostremembered legacy is in the field of statistical graphicsThe chart, or statistical graphic, is also a map. And astrange one at that. It depicts the advance into (1812)and retreat from (1813) Russia by Napoleon’s GrandeArmée, which was decimated by a combination of theRussian winter, the Russian army and its scorched-earthtactics. To my knowledge, this is the origin of the term’scorched earth’ – the retreating Russians burnt anythingthat might feed or shelter the French, thereby severelyweakening Napoleon’s army. It unites temperature, time,geography and number of soldiers, all in one picture.
Purpose of Frequency Graphs{{{In statistics, we are interested inthe shapes of distributions becausethey tell us what statistics to use.They let us identify outliers thatmight distort the statistics we willbe using.They present data so that readerscan quickly and easily grasp itsmeaning.
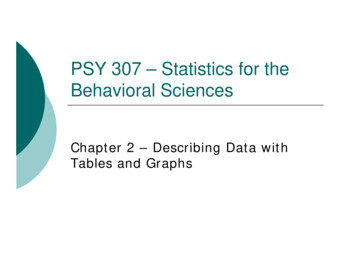
Shapes of Distributions{{Normal – bell-shaped andsymmetrical.Bimodal – two peaks.z{{Suggests presence of two differenttypes of observations in the same data.Positively skewed – lopsided due toextreme observations in right tail.Negatively skewed – extremeobservations in left tail.
Shapes of Graphsbimodalpositive skewnormalnegative skew
Heavy vs Light-tailed Distributions{{{Heavy-tailed – a distribution withmore observations in its tails.Light-tailed – a distribution withfewer observations in its tails andmore in the center.Kurtosis – a statistic that measuresthe shape of the distribution andthe size of the tails.
Qualitative Data{Bar graphs – similar to histograms.zz{Bars do not touch.Categorical groups are on x-axis.Pie chartsWhere tax moneygoes.
Misleading Graphs{{{{Bars should be equal widthsBars should be two-dimensional,not three-dimensionalWhen the lower bound of the y-axis(frequency) is cut-off (not 0), thedifferences are exaggerated.Height and width of the graphshould be approximately equal.
Gallup’s Terry Schiavo Poll
How Big are Crime ory.php?storyId 5480227
Misleading Scales
More Misleading 1L02.htm
Constructing Graphs{{{{{Select the type of graph.Place groups on the x-axis.Place frequency on the y-axis.Values for the groups andfrequencies depend on the data.Label the axes and give a title tothe graph.
Parts of a Graph
Other Kinds of Graphs{Frequency is not the only measurethat can be displayed on the y-axis.z{{We are using a graph to explore theshape of a distribution in this chapter.Usually the y-axis shows thedependent variable while the x-axisshows groups (independentvariable).Graphs can be visually interesting!
PSY 307 – Statistics for the Behavioral Sciences Chapter 2 – Describing Data with Tables and Graphs. Frequency Distributions {One of the simplest forms of measurement is counting z How many people show a charact