Transcription
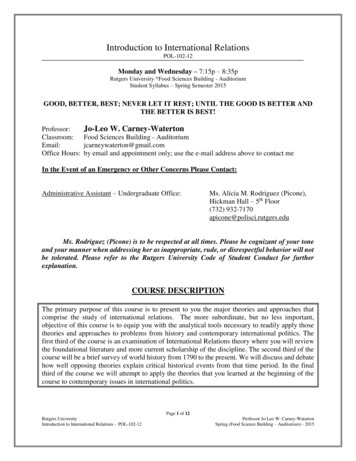
2020 No. 050Relations Among 2018-19 Kentucky PerformanceRating for Educational Progress (K-PREP) and ACTScoresFinal ReportPreparedfor:Kentucky Department of EducationOffice of Assessment and Accountability300 Sower BoulevardFrankfort, KY 40601Authors:Justin PaulsenEmily R. DickinsonArthur A. ThackerPreparedunder:Date:Contract # PON2 540 1900004339June 24, 2020
Relations Among 2018-19 Kentucky Performance Rating for EducationalProgress (K-PREP) and ACT ScoresTable of ContentsIntroduction . 1Description of Data . 2Results . 3Box Plot Illustrations of Relationships . 3Correlations Among Measures. 8Summary and Conclusion .14References .15List of TablesTable 1. K-PREP, ACT, and GPA Descriptive Statistics among All Students andComplete Cases . 3Table 2. Correlations Among K-PREP,ACT, and Self-Reported GPA . 8Table 3. Proportion of Kentucky Students and Mean K-PREP Science Scores WithinACT Science Percentile Rankings . 9Table 4. Proportion of Kentucky Students and Mean K-PREP On-Demand WritingScores Within ACT English Percentile Rankings .10Table 5. Cross-Classification Rates Across K-PREP Proficiency and ACT Scores .11Table 6. ACT Science Scores, Equated ACT Science Scores and Corresponding MeanK-PREP Science Scores .12Table 7. ACT English Scores, Equated ACT English Scores and Corresponding Mean KPREP On-Demand Writing Scores .13List of FiguresFigure 1. Relationship between K-PREP Science scale score and ACT Science score . 4Figure 2. Relationship between K-PREP On-Demand Writing scale score and ACTEnglish score . 5Figure 3. Relationship between K-PREP Science scale score and high school ScienceGPA . 6Figure 4. Relationship between K-PREP On-Demand Writing scale score and highschool English GPA . 7Relations Among K-PREP and ACT Scoresi
Relations Among 2018-19 Kentucky Performance Rating for EducationalProgress and ACT ScoresIntroductionThe Kentucky Department of Education (KDE) has contracted with Human Resources ResearchOrganization (HumRRO) to provide third party quality assurance and validity studies to assistKDE in meeting its statutory responsibilities under KRS 158.6453 and KRS 158.6455. Amongthe studies carried out on an annual basis, HumRRO independently conducts an analysis of theconsistency of student results across multiple measures of student achievement administeredunder the state accountability system.Two tests that are purported to measure the same or similar constructs are expected to behighly correlated. The pattern of student scores on one reading test, for example, would beexpected to be similar to the pattern of student scores on another test that was also designed tomeasure reading. This is referred to as convergent validity evidence. Similarly, the pattern ofstudent scores on a test designed to measure another construct (e.g., math) would not beexpected to be as similar to the pattern of scores on the reading test. This is referred to asdiscriminant validity evidence. Convergent and discriminant validity evidence support the overallvalidity that assessment scores represent the intended construct, or that scores on the testreflect the content the test is intended to measure.The purpose of this report is to contribute to the body of validity evidence for K-PREP. The othermeasures examined in this report are student scores from the ACT and student reported GPA.This report parallels previous analyses of the relations among KCCT and ACT (Dickinson &Thacker, 2009).Following adoption of the Kentucky Core Academic Standards (KCAS) through Senate Bill 1 in2009, Kentucky transitioned from the Kentucky Core Content Test (KCCT) to the K-PREPsystem for spring summative testing. K-PREP has been administered since 2012. From 2012 to2017, K-PREP was a blend of norm-referenced and criterion-referenced tests, incorporatingcontent from the Stanford Achievement Test (Stanford 10). Beginning in 2018, Stanford 10 wasremoved from the K-PREP assessments. In 2019, K-PREP at the high school level includedsummative tests in science (first operational year) and writing.During the 2018-19 school year all Kentucky high school students took the ACT, as mandatedby Senate Bill 1 in 2017. In addition, high school students were administered K-PREPassessments in science and on-demand writing (ODW) at grade 11. The statewideadministration of ACT allows for analysis of the relations between multiple measures of studentachievement at the high school level. No assessment other than K-PREP was administeredstatewide to students in grade 3-8.K-PREP and ACT are designed to measure different sets of content standards. The K-PREPassessment targets outlined in the Kentucky Academic Standards (KAS) represents theknowledge and skills that students " should have the opportunity to learn before graduating fromKentucky high schools" (Kentucky Department of Education, 2020). ACT assessments targetthe ACT College and Career Readiness Standards , described as the "essential skills andknowledge students need to become ready for college and career" (ACT, 2020).Relations Among K-PREP and ACT Scores1
Description of DataData for these analyses were provided by the Kentucky Department of Education (KDE).HumRRO received the dataset which included all Kentucky students with 2018-19 assessmentdata. Each student’s data made up one row in the dataset. The dataset included each student’sscale scores for every K-PREP test they attempted, as well as any additional standardized testsadministered during the year. Eleventh grade students attempt the science and on-demandwriting (ODW) assessment, in addition to the ACT. The dataset also included a variety ofdemographic variables including grade, gender, race, and free/reduced lunch program status. Aseparate dataset provided student’s high school course grades as reported when students tookthe ACT. Grade point averages (GPAs) for each subject were computed from the students’ selfreported scores for courses within that subject. The use of self-reported data undoubtedlyinvolves some inaccuracies; however, Cassady found students’ self-reported grades to be areliable measure of actual grades (Cassady, 2001). These self-reported grades were measuredcategorically (F 0, D 1, C 2, B 3 and A 4); therefore, interpretations of overall GPA for eachsubject should be made cautiously. Students reporting having received an ‘A’ in each of theirmath courses, for example, would show an overall math GPA calculated to be 4.0; however, this4.0 math grade point average is not a “perfect” score.A series of data cleaning steps were taken to conduct the analyses that follow. Observationswere removed that did not come from 11th grade students. Test scores that were 0 in thedataset when the student had not attempted the test were changed to N/A. Additionally, someACT component scores were listed as “—” or blanks and were recoded to N/A.The descriptive statistics in Table 1 come from the data after conducting the data cleaningsteps. K-PREP science and ODW scale scores range from 100 to 300. The ACT componentscores range from 1-36. The table includes a column for all students and one for completecases. Because some students did not attempt all possible K-PREP tests or ACT components,some data were not included for subsequent analyses. Differences between complete casesand all cases were minimal across the tests. The table also compares K-PREP and ACT resultsacross those who did and did not report their high school grades because of the large number ofstudents who did not provide these data. Those who did report GPA showed meaningfullyhigher test scores across all tests than those who did not report GPA. This suggests thereported GPA results likely represent a disproportionate amount of higher achieving students.Reviewing reported GPAs from the 2008 HumRRO study of convergent validity also indicatesthat the GPAs reported below are much higher than in past years.The standard deviation for K-PREP ODW is more than twice as large as the standard deviationfor K-PREP science and the mean K-PREP ODW score is much farther from the range midpointthan the K-PREP science mean. These differences between the scales are likely a result of thescoring system for K-PREP ODW. While K-PREP ODW scale scores range from 100-300, thereare only 17 possible scale score points within that range. Students received a rating between 0and 4 for each of the two ODW prompts to create raw scores between 0 and 8. To account fordifferent levels of difficulty between forms, there are two scale scores for each raw scorebetween 1 and 8, resulting in 17 scale score points placed across the 100 to 300 interval. Themost common raw score was 6 which resulted in a left-skewed distribution with far more studentscores above 200 than below. Between the skewed distribution and the large gaps betweenscore points, the standard deviation is much larger than the K-PREP science standarddeviation.Relations Among K-PREP and ACT Scores2
Table 1. K-PREP, ACT, and GPA Descriptive Statistics among All Students and CompleteCasesK-PREPScienceK-PREPODWACTScienceACT EnglishACTReadingACT MathHS ScienceGPAHS EnglishGPAHS MathGPAHS SocialStudiesGPAMeanS. D.NMeanS. D.NMeanS. D.NMeanS. D.NMeanS. D.NMeanS. D.NMeanS. D.NMeanS. D.NMeanS. D.NMeanS. D.NAll StudentsComplete d 8328,389No GPA esultsBox Plot Illustrations of RelationshipsFigures 1 and 2 illustrate the relationships between K-PREP science and ACT science and KPREP ODW and ACT English, respectively. While the relationship between K-PREP and ACTscience is clear, the decision to examine the relationship between K-PREP ODW and ACTEnglish requires further justification. The K-PREP ODW assessment consists of two writingprompts that students respond to through essays. We found sufficient overlap between thescoring criteria for the K-PREP ODW and the ACT English blueprint that we deemed itappropriate to consider the two tests as assessments of similar content.Relations Among K-PREP and ACT Scores3
The box-and-whiskers plots represent the distribution of students on K-PREP scores for thedifferent ACT ranges noted on the x-axis. The median is represented by the line in the middle ofthe box, with the 25th and 75th percentile marked by the bottom and top of the rectangle. Thewhiskers, or lines extending from the rectangle, represent the spread of the distribution ofstudents. Below each box and whisker plot the number of students in the given ACT range isindicated. Each plot includes three dashed lines to separate the K-PREP test scores into fourachievement levels: Novice (the bottom level), Apprentice (the second level), Proficient (thethird level), and Distinguished (the fourth level).Figure 1 illustrates a positive relationship between ACT science score and K-PREP sciencescale scores. The median K-PREP science scale score increases as the ACT science scorerange increases. This indicates that students who score higher on the ACT science test tend togenerally score higher on the K-PREP science test.Figure 1. Relationship between K-PREP Science scale score and ACT Science scoreRelations Among K-PREP and ACT Scores4
Figure 2 illustrates a somewhat similar relationship between ACT English and K-PREP ODWtests. The median K-PREP ODW scores increase substantively between each of the first fourACT English score ranges. However, the median K-PREP ODW scores for the last three ACTEnglish score ranges are essentially equal. As noted above, the K-PREP ODW scores are leftskewed and because there are a limited number of scale score points, the scale score with thelargest number of examinees was the same in each range. While the mean for ODW scoreincreases for each of these higher ranges, the median ends up being the same in each.Because the relationship is flat between K-PREP ODW and ACT English scores in these higherranges, the correlation between the two assessment scores will be somewhat attenuated.Figure 2. Relationship between K-PREP On-Demand Writing scale score and ACT EnglishscoreRelations Among K-PREP and ACT Scores5
Figures 3 and 4 demonstrate a positive relationship between GPA and K-PREP test scores. Therelationship between high school science GPA and K-PREP science test scores shows a moregradual increase in test scores between GPA categories. Figure 4 shows more grouping, wheredifferent high school English GPA categories show fairly similar medians and ranges of K-PREPODW scores. These images also illustrate the skewed GPA distributions, as seen by bothscience and English GPA 4.0 categories having many more students than any other GPAcategory.Figure 3. Relationship between K-PREP Science scale score and high school ScienceGPARelations Among K-PREP and ACT Scores6
Figure 4. Relationship between K-PREP On-Demand Writing scale score and high schoolEnglish GPARelations Among K-PREP and ACT Scores7
Correlations Among MeasuresTable 2 presents correlations among the 11th grade K-PREP, ACT tests, and students' self-reportedGPAs. The table differentiates between the correlations among the content areas within each of thedifferent assessments from the correlations between the different kinds of assessments (Campbell& Fiske, 1959), thus allowing for the examination of the following relationships: The same content area within different achievement measures, or convergent validitycoefficients. These correlations are in bold and are underlined. Different content areas within the same achievement measures. These correlations arein italics. Different content areas within different achievement measures. These correlations are inbold but not underlined.The ACT reading and math tests and English and math GPAs are included to illustratecorrelations among different content areas and across different achievement measures.In correlation tables of this type, the expectation is for the highest correlations to be betweendifferent measures of the same content. Then, because of similarities in test-taking strategies orother method effects, the next highest correlations are typically between different contentmeasured by the same assessment. Correlations between different content areas with differentmeasures should be the lowest in the table.Table 2. Correlations Among K-PREP,ACT, and Self-Reported GPAVariableK-PREP1. Science2. On-Demand WritingACT3. Science4. English5. Reading6. MathGPA7. Science8. English9. Math10. Social 1.48789101.00.70.63.681.00.68.711.00.691.00As Table 2 illustrates, the correlations between measures are all strongly positive, ranging from.47 to .71 between K-PREP and ACT, and between .39 and .53 for GPA and K-PREP or ACT.In a study of school-level assessment scores, Sicoly discussed the existence of a generalcognitive factor that “cuts across content areas” (Sicoly, 2002). If such a “g-factor” exists, then itwould be expected that students with high ability would score well on any test, regardless of thecontent. Correlations presented in Table 2 suggest that Kentucky students who exhibit highability in one content area can be expected to perform well in other content areas.Relations Among K-PREP and ACT Scores8
Both K-PREP assessments diverged somewhat from the patterns expected in the correlationtable. K-PREP science correlated most highly with ACT English (.71) rather than ACT science(.66) and correlated least with K-PREP ODW (0.60) rather than ACT reading (.69) or ACT math(.66). Similarly, among relationships with GPAs, K-PREP science correlated more highly withEnglish and social studies (.45 and .46, respectively) than with science (.41). K-PREP ODWcorrelated most strongly with K-PREP science (.60) rather than ACT English (.57), but both ofthose correlations were higher than correlations with the other ACT test scores, as would beexpected. Similarly, K-PREP ODW correlated more with English GPA (.45) than any of theGPAs from other, less related subject. The correlations with GPA results are likely attenuatedbecause of the limited sample skewing toward higher GPAs.Another way of considering K-PREP-ACT comparisons uses the percentile rankings ACTreports for each student. The percentile rankings allow students to quickly determine how wellthey’ve scored compared to the national population of ACT-taking students. Tables 3 and 4contain ACT data percentiles and their associated scale scores for comparable content areas.The data were divided into deciles to make interpretation easier; however, ACT scores rangefrom 1 to 36 and the number of students represented by each scale point varies substantially.Consequently, splitting the data into deciles resulted in uneven distributions. The percentage ofstudents represented in each cell is provided in addition to target deciles. For instance, thepercentile range from 90-99 could include ACT scores from 28-36, but a score of 28 might placestudents in the 91st percentile. In that case, the range of scores from 28-36 would actually bethe top 9% of students despite our attempts to represent the top 10%.Tables 3 and 4 can be analyzed by examining the mean K-PREP score for each ACT decile.For both K-PREP science and ODW, the mean score increases from every lower ACT scorerange to every higher ACT score range. Focusing on the means and using smaller ACT ranges,as compared to the medians in the box plot analyses above, shows a more consistent changepattern for the K-PREP ODW results.Table 3. Proportion of Kentucky Students and Mean K-PREP Science Scores Within ACTScience Percentile RankingsACTPercentile RankingNationalPercentileActual ACTScoreNumber of KYstudentsMean K-PREPScience90-99 (10%)92-99 (8%)29-362100 (5%)223.1580-89 (10%)82-91 (10%)25-283953 (9%)217.5070-79 (10%)70-81 (12%)23-245595 (13%)211.1660-69 (10%)64-69 (6%)223350 (7%)207.4850-59 (10%)50-63 (14%)20-214349 (10%)204.6540-49 (10%)43-49 (7%)194133 (9%)201.8830-39 (10%)30-42 (13%)17-186912 (16%)197.8620-29 (10%)24-29 (6%)162579 (6%)194.7710-19 (10%)13-23 (11%)14-155585 (13%)192.610-9 (10%)0-12 (13%)1-135570 (12%)189.16Relations Among K-PREP and ACT Scores9
Table 4. Proportion of Kentucky Students and Mean K-PREP On-Demand Writing ScoresWithin ACT English Percentile RankingsACTPercentile RankingNationalPercentileActual ACTScoreNumber of KYstudentsMean K-PREPODW90-99 (10%)90-99 (10%)30-362936 (7%)274.2780-89 (10%)82-89 (8%)26-292551 (6%)267.2570-79 (10%)70-81 (12%)23-254864 (11%)260.2960-69 (10%)59-69 (11%)21-224851 (11%)254.0250-59 (10%)48-58 (11%)19-204635 (10%)247.9140-49 (10%)40-47 (8%)17-184253 (9%)240.3630-39 (10%)30-39 (10%)15-165689 (13%)232.3520-29 (10%)23-29 (7%)143350 (7%)226.1110-19 (10%)11-22 (12%)11-136741 (15%)213.070-9 (10%)0-10 (11%)1-105078 (11%)199.96Additionally, Table 3 and 4 allow for comparisons of the percentiles in the different ACT rangesamong the national and Kentucky sample to see how comparable the distributions are. Thetables indicate that the distribution of Kentucky ACT science and English scores is fairly similarto the national distribution. The Kentucky distributions have somewhat fewer students in thehighest deciles and somewhat more in the middle and lower deciles.Kentucky students are classified into one of four proficiency categories based on their K-PREPscores, and the proportion of students classified as Proficient and above contributes positivelyto school-level accountability scores. ACT published a set of College Readiness Benchmarks(ACT, 2013), which suggest that when a student has scored 18 or above on the ACT Englishtest a student has approximately a 50% or better chance of earning a B or better, andapproximately a 75% chance of earning a C or better, in a university English Compositioncourse. Scoring a 23 or higher on the ACT science test indicates the same probabilities forearning a B or C or better in a university Biology course.Table 5 presents cross tabulations of students’ ACT scores, categorized above or below therelevant ACT benchmark score, with students’ classifications above or below the Proficient cutscore on K-PREP. Cross classification tables can be analyzed by examining the percent ofstudents who would be classified in the same way by both tests (the top left and bottom right cellswithin a subject) to those that were differentially classified by the two tests (the bottom left and topright cells within a subject). Examining the science assessments finds that the ACT and K-PREPtests would classify about 80% of students in the same way (about 62% as below proficient and19% proficient and above). About 20% of examinees would be differentially classified by ACT andK-PREP assessments, with slightly more (12%) being rated proficient or above by K-PREP butnot by ACT. The English assessments would classify students at a slightly lower rate ofagreement (about 72%) than the science assessments. The differential classifications among theassessments were relatively similar between cases where K-PREP ODW classified as proficientand above and ACT did not (about 15%), and vice versa (about 13%). Although the K-PREPproficiency levels were designed to equate to the Council for Postsecondary Education’sbenchmarks, which are related to but slightly different from the ACT benchmarks (Thacker,Dickinson, & Sinclair, 2013), some amount of differential classification is to be expected.Relations Among K-PREP and ACT Scores10
Table 5. Cross-Classification Rates Across K-PREP Proficiency and ACT ScoresScienceScienceK-PREP Below ProficientK-PREP Proficient & AboveACT Score 2327,185 (61.61%)5,293 (11.99%)ACT Score 233,328 (7.54%)8,320 (18.86%)English/ODWEnglish/ODWK-PREP Below ProficientK-PREP Proficient & AboveACT Score 1815,403 (35.05%)6,581 (14.97%)ACT Score 185,591 (12.72%)16,373 (37.26%)Tables 6 and 7 provide scoring comparisons for K-PREP and ACT throughout the range ofpossible scores. We chose to base these tables on the ACT scale score because there are only36 potential ACT scores, whereas K-PREP scores are on a larger, 200-point scale. The firstcolumn in these tables lists all potential ACT scores. The second column, Equated K-PREPScore, contains an equivalent score on K-PREP for each ACT scale score. This equivalentscore was calculated using equipercentile equating estimated through the relative distributionsof scores on both assessments. The Linking with Equivalent Groups or Single Group Designprogram (Brennan, 2004) was used to conduct the equipercentile equating. It is important toreiterate that the K-PREP assessment uses a 100-300 scale, and that the K-PREP ODWassessment includes only 17 score points. Differences in the number of scale score points cancomplicate the relationship between the linked scores (Pommerich, Hanson, Harris, & Sconing,2000).Because we have essentially the full population of students in Kentucky taking the ACT in oursample, we were also able to calculate a simple mean K-PREP score for students scoring ateach scale score on ACT. The fourth column in the tables, Mean K-PREP Score, containsthese mean scores and provides a check on the accuracy of the equated results. The sixthcolumn contains the difference between the two. The third and fifth columns contain theperformance category represented by either the equated K-PREP scores or the mean KPREP scores, respectively. Each of the categories is color coded (N Red, A Yellow,P Green, and D Purple) to show clearly where the K-PREP categories fall on the ACT scalecalculated using both linear equating and the mean student scores. As might be expected, theequating results are particularly strong in the middle of the distributions where the moststudents’ scores fell and more disparate at the tails of the distributions where fewer studentsscored. The science distribution shows some disordering of mean K-PREP scores andachievement level categories for lower ACT scores, likely due to the extremely small samplesizes for these ACT scores.Finally, Tables 6 and 7 contain gray horizontal shading line indicating the ACT CollegeReadiness Benchmarks for science, when ACT 23, and ACT 18 for English. For bothdistributions, the College Readiness Benchmark aligns closely with where the equated scoresbegin the Proficient achievement level.Relations Among K-PREP and ACT Scores11
Table 6. ACT Science Scores, Equated ACT Science Scores and Corresponding Mean KPREP Science Mean 70.160.180.200.170.240.290.240.53Relations Among K-PREP and ACT Scores12
Table 7. ACT English Scores, Equated ACT English Scores and Corresponding Mean KPREP On-Demand Writing Mean .050.02Relations Among K-PREP and ACT Scores13
Summary and ConclusionThe purpose of this report is to explore whether K-PREP scores appropriately related to othermeasure of educational achievements, the ACT assessment and students' self-reported grades.Results contribute to the body of validity evidence for K-PREP. Specifically, evidence ofconstruct validity supports the assertion that students' K-PREP scores provide meaningfulinformation about their performance in the tested content areas. Meaningful information aboutstudent academic performance is essential for robust school accountability systems.Overall, the results indicate strong, positive relations between K-PREP and ACT test scores.Correlations between K-PREP and ACT are strong, but not so strong as to indicate that the twotests are interchangeable. The box plots and percentile analyses both demonstrate a positiveassociation between the K-PREP and ACT tests, althoug
PREP ODW and ACT English, respectively. While the relationship between K-PREP and ACT science is clear, the decision to examine the relationship between K-PREP ODW and ACT English requires further justification. The K-PREP ODW assessment consists of two writing prompts that students respond t

