Transcription
White PaperCboe Volatility Index 2019 Cboe Exchange, Inc. All rights reserved.
Contents Introduction. 3 Volatility as a tradable asset: VIX Futures & Options. 3 Beyond the VIX Index . 4 Historical Prices: The VIX Index and Other Volatility Indexes. 4 The VIX Index Calculation: Step-by-Step. 4 Getting Started. 5 Step 1: Select the options to be used in the VIX Index calculation. 6 Step 2: Calculate volatility for both near-term and next-term options. 8 Step 3: Calculate volatility for both near-term and next-term options (Cont’d). 9 VIX Index Filtering Algorithm. 10 The Calculation of the Final Settlement Value for VIX Derivatives. 10 Related VIX Values. 11 Appendix 1: Complete SPX Option Data Used in Sample VIX Index Calculation. 13 Appendix 2: Individual Contributions. 17Cboe Proprietary Information. Copyright 2019 Cboe. All rights reserved.Page 2
IntroductionIn 1993, Cboe Global Markets, Incorporated (Cboe ) introduced the Cboe Volatility Index (VIX Index), which wasoriginally designed to measure the market’s expectation of 30-day volatility implied by at-the-money S&P 100 Index (OEX Index) option prices. The VIX Index soon became the premier benchmark for U.S. stock market volatility. It is regularlyfeatured in the Wall Street Journal, Barron’s and other leading financial publications, as well as business news shows onCNBC, Bloomberg TV and CNN/Money, where the VIX Index is often referred to as the “fear gauge.”Ten years later in 2003, Cboe together with Goldman Sachs, updated the VIX Index to reflect a new way to measureexpected volatility, one that continues to be widely used by financial theorists, risk managers and volatility traders alike.The new VIX Index is based on the S&P 500 Index (SPXSM), the core index for U.S. equities, and estimates expected volatilityby aggregating the weighted prices of SPX puts and calls over a wide range of strike prices. By supplying a script forreplicating volatility exposure with a portfolio of SPX options, this new methodology transformed the VIX Index from anabstract concept into a practical standard for trading and hedging volatility.In 2014, Cboe enhanced the VIX Index to include series of SPX WeeklysSM. First introduced by Cboe in 2005, weekly optionsare now available on hundreds of indexes, equities, ETFs and ETNs and have become a very popular and actively-tradedrisk management tool. Today, SPX Weeklys account for one-third of all SPX options traded, and average close to 350,000contracts traded per day1.The inclusion of SPX Weeklys allows the VIX Index to be calculated with S&P 500 Index option series that most preciselymatch the 30-day target timeframe for expected volatility that the VIX Index is intended to represent. Using SPX optionswith more than 23 days and less than 37 days to expiration ensures that the VIX Index will always reflect an interpolation oftwo points along the S&P 500 volatility term structure.Cboe began dissemination of the VIX Index outside of U.S. trading hours in April 2016. The VIX index is now availableduring “extended trading hours” between 3 a.m. and 9:15 a.m ET, as well as during regular trading hours between 9:30a.m. and 4:15 p.m. ET. As part of the VIX Index expansion, Cboe implemented a smoothing algorithm for VIX Index valuesdisseminated during both extended and regular market hours.Volatility as a tradable asset: VIX Futures & OptionsOn March 24, 2004, Cboe introduced the first exchange-traded VIX futures contract on its new, all-electronic Cboe FuturesExchangeSM (CFE ). Two years later in February 2006, Cboe launched VIX options, the most successful new product in Cboehistory. In 2015, combined trading activity in VIX options and futures grew to nearly 800,000 contracts per day.The negative correlation of volatility to stock market returns is well documented and suggests a diversification benefitto including volatility in an investment portfolio. VIX futures and options are designed to deliver pure volatility exposurein a single, efficient package. Cboe/CFE provides a continuous, liquid and transparent market for VIX products that areavailable to all investors from the smallest retail trader to the largest institutional money managers and hedge funds.1Based on 2015 Volume.Cboe Proprietary Information. Copyright 2019 Cboe. All rights reserved.Page 3
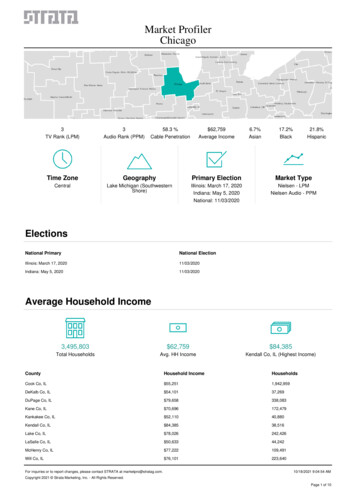
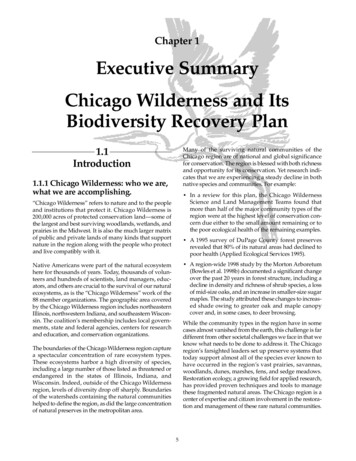
Beyond the VIX IndexIn addition to the VIX Index, Cboe calculates several other broad market volatility indexes including the Cboe ShortTerm Volatility Index (VIX9DSM), which reflects 9-day expected volatility of the S&P 500 Index, the Cboe S&P 500 3-MonthVolatility Index (VIX3MSM), Cboe S&P 500 6-Month Volatility Index (VIX6MSM) and the Cboe S&P 500 1-Year Volatility Index(VIX1YSM). Cboe also calculates the Nasdaq-100 Volatility Index (VXNSM), Cboe DJIA Volatility Index (VXDSM) and the CboeRussell 2000 Volatility Index (RVXSM).Historical Prices: The VIX Index and Other Volatility IndexesPerhaps one of the most valuable features of the VIX Index is the existence of more than 25 years of historical prices. Thisextensive data set provides investors with a useful perspective of how option prices have behaved in response to a varietyof market conditions. Price history for the original Cboe Volatility Index (VXO) based on OEX options is available from 1986to the present. Cboe has created a similar historical record for the new VIX Index dating back to 1990 so that investors cancompare the new VIX Index with VXO, which reflects information about the volatility “skew” or “smile.”The VIX Index Calculation: Step-by-StepStock indexes, such as the S&P 500, are calculated using the prices of their component stocks. Each index employs rulesthat govern the selection of component securities and a formula to calculate index values.The VIX Index is a volatility index comprised of options rather than stocks, with the price of each option reflecting themarket’s expectation of future volatility. Like conventional indexes, the VIX Index calculation employs rules for selectingcomponent options and a formula to calculate index values. Some different rules and procedures apply when calculatingthe VIX Index value to be used for the final settlement value of VIX futures and options. For more information about thosedifferences, refer to the section below titled “The Calculation of the Final Settlement Value for VIX Derivatives.”The generalized formula used in the VIX Index calculation§ is:2 2TiK i RTe Q( K i )2Ki21 FT K01WhereVIXTFK0KiKi100Time to expirationKi Forward index level derived from index option pricesFirst strike below the forward index level, FStrike price of i out-of-the-money option; a call ifKi K0 and a put if Ki K0; both put and call if Ki K0.thInterval between strike prices – half thedifference between the strike on either side of Ki:RR Q(K i )K i 1Ki12Risk-free interest rate to expirationThe midpoint of the bid-ask spread for eachoption with strike Ki.Please see “More than you ever wanted to know about volatility swaps” by Kresimir Demeterfi, Emanuel Derman, MichaelKamal and Joseph Zou, Goldman Sachs Quantitative Strategies Research Notes, March 1999.§Cboe Proprietary Information. Copyright 2019 Cboe. All rights reserved.Page 4
Getting StartedThe VIX Index measures 30-day expected volatility of the S&P 500 Index. The components of the VIX Index are near- andnext-term put and call options with more than 23 days and less than 37 days to expiration. These include SPX options with“standard” 3rd Friday expiration dates and “weekly” SPX options that expire every Friday, except the 3rd Friday of eachmonth. Once each week, the SPX options used to calculate the VIX Index “roll” to new contract maturities. For example,on the second Tuesday in October, the VIX Index would be calculated using SPX options expiring 24 days later (i.e., “nearterm”) and 31 days later (i.e., “next-term”). On the following day, the SPX options that expire in 30 calendar days wouldbecome the “near-term” options and SPX options that expire in 37 calendar days would be the “next-term” options.In this hypothetical example, the near-term options are “standard” SPX options with 25 days to expiration, the next-termoptions are P.M.-settled SPX Weeklys with 32 days to expiration; and the calculation reflects prices observed at 9:46 a.m. ET.For the purpose of calculating time to expiration, “standard” SPX options are deemed to expire at the open of trading onSPX settlement day - the third Friday of the month, and “weekly” SPX options are deemed to expire at the close of trading(i.e., 4:00 p.m. ET).The VIX Index calculation measures time to expiration, T, in calendar days and divides each day into minutes in order toreplicate the precision that is commonly used by professional option and volatility traders. The time to expiration is givenby the following expression:T { MCurrent day MSettlement day MOther days } / Minutes in a yearWhereMCurrent dayminutes remaining until midnight of the current dayMSettlement dayminutes from midnight until 9:30 a.m. ET for “standard” SPX expirations; or minutes from midnight until4:00 p.m. ET for “weekly” SPX expirationsMOther daystotal minutes in the days between current day and expiration dayUsing 9:46 a.m. ET as the time of the calculation, T for the near-term and next-term options, T1 and T2, respectively, is:T1 {854 510 34,560} / 525,600 0.0683486T2 {854 900 44,640} / 525,600 0.0882686The risk-free interest rates, R1 and R2, are yields based on U.S. Treasury yield curve rates (commonly referred to as“Constant Maturity Treasury” rates or CMTs), to which a cubic spline is applied to derive yields on the expiration dates ofrelevant SPX options. As such, the VIX Index calculation may use different risk-free interest rates for near- and next-termoptions. In this example, assume that R1 0.0305% for the near-term options and that R2 0.0286% for the next-termoptions. Note in this example, T2 uses a value of 900 for MSettlement day, which reflects the 4:00 p.m. ET expiration time of thenext-term SPX Weeklys options. Since many of the interim calculations are repetitive, only representative samples appearbelow. The complete set of SPX option data and calculations may be found in Appendix 1.Cboe Proprietary Information. Copyright 2019 Cboe. All rights reserved.Page 5
Step 1: Select the options to be used in the VIX Index calculationThe selected options are out-of-the-money SPX calls and out-of-the-money SPX puts centered around an at-the-moneystrike price, K0. Only SPX options quoted with non-zero bid prices are used in the VIX Index calculation.One important note: as volatility rises and falls, the strike price range of options with non-zero bids tends to expand andcontract. As a result, the number of options used in the VIX Index calculation may vary from month-to-month, day-to-dayand possibly, even minute-to-minute.For each contract month: Determine the forward SPX level, F, by identifying the strike price at which the absolute difference between the call and putprices is smallest. The call and put prices in the following table reflect the midpoint of each option’s bid / ask quotation. Asshown below, the difference between the call and put prices is smallest at the 1965 strike for the near- and the 1960 strike for thenext-term options.Near Term OptionsNext Term OptionsStrike PriceCallPutDifferenceStrike 017.80Using the 1965 call and put in the near-term, and the 1960 call and put in the next-term contract applied to the formula:F Strike Price eRT x (Call Price - Put Price)the forward index prices, F1 and F2, for the near- and next-term options, respectively, are:F1 1965 e(0.000305 x 0.0683486) x (21.05 - 23.15) 1962.89996F2 1960 e(0.000286 x 0.0882686) x (27.30 - 24.90) 1962.40006 Next, determine K - the strike price equal to or otherwise immediately below the forward index level, F - for the near- and nextterm options. In this example, K , 1960 and K , 1960. Select out-of-the-money put options with strike prices K . Start with the put strike immediately lower than K and move to0010200successively lower strike prices. Exclude any put option that has a bid price equal to zero (i.e., no bid). As shown below, oncetwo puts with consecutive strike prices are found to have zero bid prices, no puts with lower strikes are considered for inclusion.(Note that the 1350 and 1355 put options are not included despite having non-zero bid prices.)Cboe Proprietary Information. Copyright 2019 Cboe. All rights reserved.Page 6
Put es13800.10.2YesNot considered following two zerobidsNoNext, select out-of-the-money call options with strike prices K0. Start with the call strike immediately higher than K0 and moveto successively higher strike prices, excluding call options that have a bid price of zero. As with the puts, once two consecutive calloptions are found to have zero bid prices, no calls with higher strikes are considered. (Note that the 2225 call option is not includeddespite having a non-zero bid price.)Call 000.0522250.050.1225000.05Not considered following two zerobids Finally, select both the put and call with strike price K . Notice that two options are selected at K , while a single option, either aput or a call, is used for every other strike price. The following table contains the options used to calculate the VIX Index in this example. The VIX Index uses the midpoint of00quoted bid and ask prices for each option selected. The K0 put and call prices are averaged to produce a single value. The priceused for the 1960 strike in the near-term is, therefore, (24.25 21.30)/2 22.775; and the price used in the next-term is (27.30 24.90)/2 26.10.Near term StrikeOption TypeMidpoint PriceNext term StrikeOption TypeMidpoint 5Put19.751955Put23.201960Put/Call Average22.7751960Put/Call 0Call0.12125Call0.12200Call0.08Cboe Proprietary Information. Copyright 2019 Cboe. All rights reserved.Page 7
Step 2: Calculate volatility for both near-term and next-term optionsApplying the VIX formula (1) to the near-term and next-term options with time to expiration of T1 and T2, respectively,yields:2212 Ki2T1 K i R2T2eQ( K i )2Ki1 F2T2 K 0Ki2T2e R1T1 Q( K i )1 F1T1 K 0i2i2121The VIX Index is an amalgam of the information reflected in the prices of all of the selected options. The contribution ofa single option to the VIX Index value is proportional to ΔK and the price of that option, and inversely proportional to thesquare of the option’s strike price.Generally, ΔKi is half the difference between the strike prices on either side of Ki. For example, the ΔK for the next-term1325 Put is 37.5: ΔK1325 Put (1350 – 1275)/2. At the upper and lower edges of any given strip of options, ΔKi is simply thedifference between Ki and the adjacent strike price. In this example, the 1370 Put is the lowest strike in the strip of nearterm options and 1375 is the adjacent strike. Therefore, ΔK1370 Put 5 (i.e., 1375 – 1370).The contribution of the near-term 1370 Put is given by:K1370 Put2K1370PutK1370 Put2K1370Pute R1T1 Q(1370 Put)e R1T1 Q(1370 Put) 5e .000305 ( 0.0683486) (0.20) 0.000000532821370A similar calculation is performed for each option. The resulting values for the near-term options are then summed andmultiplied by 2/T1. Likewise, the resulting values for the next-term options are summed and multiplied by 2/T2. The tablebelow summarizes the results for each strip of options.Near termStrikeOption TypeMidpointPriceContribution byStrikeNear termStrikeOption TypeMidpointPriceContribution 7482T1iK i R1T1e Q( K i )K i20.0184952T2iK i R2T2eQ( K i )K i2Cboe Proprietary Information. Copyright 2019 Cboe. All rights reserved.0.018838Page 8
1 FT K0Next, calculate21for the near-term (T1) and next-term (T2):21 F1T1 K 011 0.068348621962.8999619601 0.0000320321 F2T2 K 011962.400061 0.0882686196021 0.00001699Now calculate σ21 and σ22:2122 2T1 2T2Ki R1T1e Q( K i )Ki2i1 F1T1 K 021 0.018495 – 0.00003203 0.01846292K i R2T21 F2eQK()iK i2T2 K 0i21 0. 018838 – 0. 00001699 0.01882101Step 3Calculate the 30-day weighted average of σ21 and σ22. Then take the square root of that value and multiply by 100 to getthe VIX Index value.VIX 100T121N T2N 30N T2N T1 T222N 30 N T1N T2N T1N 365N 30The inclusion of SPX Weeklys in the VIX Index calculation means that the near-term options will always have more than 23days to expiration and the next-term options always have less than 37 days to expiration, so the resulting VIX Index valuewill always reflect an interpolation of σ21 and σ22 ; i.e., each individual weight is less than or equal to 1 and the sum of theweights equals 1.Returning to the example NT1 number of minutes to settlement of the near-term options (35,924)NT2 number of minutes to settlement of the next-term options (46,394)N30 number of minutes in 30 days (30 x 1,440 43,200)N365 number of minutes in a 365-day year (365 x 1,440 525,600)VIX 1000.0683486 0.018462946,39443,20046,394 35,924 0.0882686 0.01882143,200 35,924525,60046,394 35,92443,200VIX 100 0.13685821 13.69Cboe Proprietary Information. Copyright 2019 Cboe. All rights reserved.Page 9
VIX Index Filtering AlgorithmAs described above, “spot” VIX Index values are based on the average of SPX option bid/ask quotes (“mid-quote” prices),and only options that have a non-zero bid price are included. The bid-ask spread is generally accepted as a currentindication of market price, and the average of the bid and ask quotes can be thought of as an indication of “fair” value.Spot VIX Index values are calculated using mid-quote option prices.From time to time, option price quotations widen due to changing market conditions, technology failures or other reasons.When this occurs, options that were previously included in a VIX Index value calculation might be excluded due to themnow having a zero-bid price. In other instances, the mid-quote prices of one or more SPX options might materially change.This can result in a VIX Index value that, while accurately reflecting SPX option quotes at the time, may not reflect theexpected volatility of the S&P 500 Index. Cboe uses a filtering algorithm to address this circumstance.The VIX Index Filtering Algorithm operates as follows:1.The first VIX Index spot value calculated during the Cboe RTH session or the Cboe GTH session is deemed to be the“baseline” VIX Index spot value.2.Any VIX Index spot value calculated after and within two (2) minutes of the baseline that is higher than the baselinevalue or lower than the baseline value by .49 volatility points or less becomes the new baseline value.3.If VIX Index spot values calculated after and within two (2) minutes of a baseline are lower than the baseline by0.50 volatility points or more, then the baseline VIX Index spot value will be republished as the VIX Index spot value.Calculated values above the baseline are not filtered.4.If the published VIX Index spot values remain the same for a period of two (2) minutes because the calculatedvalues are 0.50 or more volatility points lower than the baseline, the first VIX Index spot value calculated after thetwo-minute period becomes the new baseline VIX Index spot value.5.The filtering algorithm does not apply to the first VIX Index spot value calculated during the Cboe RTH session(approximately 9:30 a.m. ET) or the first VIX Index spot value calculated during the Cboe GTH session(approximately 3:15 a.m. ET). All other VIX Index spot values calculated during Cboe RTH and Cboe GTH aresubject to the filtering process.The Calculation of the Final Settlement Value for VIX DerivativesThe final settlement value for VIX futures and options is determined on the morning of their expiration date (usuallya Wednesday) through a Special Opening Quotation (“SOQ”) of the VIX Index. There are several ways in which thecalculation of the SOQ of the VIX Index differs from the calculation of the VIX Index at all other times. The SOQ calculation uses SPX, or SPXW, options from a single expiration 30 calendar days from the subjectsettlement day. Unlike the VIX Index calculation at other times, the SOQ calculation does not involve theinterpolation of volatility calculated with near-term and next-term options.Cboe Proprietary Information. Copyright 2019 Cboe. All rights reserved.Page 10
Unlike the VIX Index calculation at other times, the determination of the strike range used for the SOQ calculationdoes not depend on whether options with consecutive strikes have zero bid prices. Cboe determines andannounces the strike range to be used in the SOQ calculation. It does so by using an algorithm to determine thecall with the highest strike and the put with the lowest strike to be used in that calculation. The strike pricesused in the SOQ calculation include all put options within the strike range that have a strike price K0, all calloptions within the strike range that have a strike price K0, and both the put and call options that have a strikeprice equal to K0. Importantly, options within the Cboe-determined strike range with a zero bid price are eligibleto be included in the SOQ calculation, which also differs from the calculation of the VIX index at other times. The SOQ calculation uses the “opening trade price” of each of the selected options, as determined pursuant toCboe’s rules during the special opening auction that Cboe conducts on days when VIX derivatives settle. Thisapproach is different from the mid-quote prices that are used to calculate the VIX Index at all other times. Cboeuses the mid-quote price in the SOQ calculation only if a selected option does not have an opening price, in whichcase Cboe uses the midpoint price of the highest bid and lowest offer at the time of the opening.For more information about Volatility Derivatives settlement, visit vixoptions-and-futures/vix-index/vix-faqs.Related VIX Index ValuesIn addition to the VIX Index, Cboe publishes the Cboe VIX Indicative Bid Index (“VWB”), a VIX Index value based on SPX bidquotations, and the Cboe VIX Indicative Ask Index (“VWA”), a VIX Index value based on SPX option ask quotations. Thesevalues provide a market estimate of SPX option bid-ask “spreads” expressed in volatility terms. Cboe also publishesvolatility information related to the near-term and next-term VIX “components”, σ1 and σ2, under ticker symbols “VIN”(Cboe Near-Term VIX Index) and “VIF” (Cboe Far-Term VIX Index) every 15 seconds during each Cboe trading day.Cboe Proprietary Information. Copyright 2019 Cboe. All rights reserved.Page 11
The information in this document is provided for information purposes only, and is not intended to provide, and should not be relied on for financial orlegal advice. The Cboe Volatility Index (VIX index) and all other information provided by Cboe Global Markets, Incorporated (Cboe) and its affiliates andtheir respective directors, officers, employees, agents, representatives and third party providers of information (the “Parties”) in connection with the VIX Index (collectively “Data”) are presented “as is” and without representations or warranties of any kind. The Parties shall not be liable for loss or damage,direct, indirect or consequential, arising from any use of the Data or action taken in reliance upon the Data.Options involve risk and are not suitable for all investors. Prior to buying or selling an option, a person must receive a copy of Characteristics and Risks ofStandardized Options. Copies are available from your broker, by calling 1-888-OPTIONS or from The Options Clearing Corporation at www.theocc.com.Futures trading is not suitable for all investors, and involves risk of loss. No statement within this document should be construed as a recommendation tobuy or sell a security or futures contract or to provide investment advice. It is not possible to invest directly in an index.The VIX index methodology is the property of Cboe. Cboe , Cboe Exchange, Inc , Cboe Global Markets , CFE , Cboe Volatility Index , OEX , VIX andVXST are registered trademarks and Cboe Futures ExchangeSM, WeeklysSM, Cboe Short-Term Volatility IndexSM, SPXWSM, VXMTSM, VXXLESM, VXEEMSM, VXEFASM,VXGDXSM, VXSLVSM, VXEWZSM, VXFXISM, VXAPLSM, VXAZNSM, VXGSSM, VXGOGSM, VXIBMSM, EVZSM, GVZSM, OVXSM, RVXSM, SPXSM, VXDSM, VXNSM, VXOSM and VXVSM are servicemarks of Cboe Exchange, Inc. or its affiliates. Cboe and its affiliates do not sponsor, endorse, sell or promote any third party investment product that is ormay be based on the VIX Index. Standard & Poor’s , S&P , S&P 100 and S&P 500 are registered trademarks of Standard & Poor’s Financial Services, LLCand have been licensed for use by Cboe Exchange, Inc. Any products that have the S&P Index or Indexes as their underlying interest are not sponsored,endorsed, sold or promoted by Standard & Poor’s or Cboe and neither Standard & Poor’s nor Cboe make any representations or recommendationsconcerning the advisability of investing in products that have S&P indexes as their underlying interests. DJIA and Dow Jones Industrial AverageSM aretrademarks or service marks of Dow Jones Trademark Holdings, LLC and have been licensed to CME Group Index Services, LLC and sublicensed for use forcertain purposes by Cboe. Nasdaq-100 Index , Nasdaq-100 and Nasdaq are trademark or service marks of The Nasdaq Stock Market, Inc. (with whichits affiliates are the “Corporations”). These marks are licensed for use by Cboe in connection with the trading of products based on the Nasdaq-100 Index.The products have not been passed on by the Corporations as to their legality or suitability. The products are not issued, endorsed, sold or promoted bythe Corporations. THE CORPORATIONS MAKE NO WARRANTIES AND BEAR NO LIABILITY WITH RESPECT TO THE PRODUCT(S). Russell 2000 is a registeredtrademark of Russell Investments, used under license. All other trademarks and service marks are the property of their respective owners. Redistribution,reproduction and/ or photocopying in whole or in part are prohibited without the written permission of Cboe.Copyright 2019 Cboe. All rights reserved.Cboe Proprietary Information. Copyright 2019 Cboe. All rights reserved.Page 12
Appendix 1: Complete SPX Option Data Used in Sample VIX Index CalculationOption Series included in the VIX Index calculation are highlighted.Near-Term OptionsStrikeNext-Term .100.051275686.00688.700.050.1
Kamal and Joseph Zou, Goldman Sachs Quantitative Strategies Research Notes, March 1999. 2 0 2 1 1 ( ) 2 K F T e Q K K K T i RT i i 2 i 100 VIX T Time to expiration F Forward index level derived from index option prices K 0 First strike below the forward index level, F Strike price of ith out-of-the-money