Transcription
Princeton UniversityTableauAn Introduction
ContentsTableau at Princeton University Overview . 1Course Overview . 2The Tableau Environment at Princeton . 3How Does Tableau Fit with Cognos?. 3What you need to know about Tableau and how we use it at Princeton . 3The Tableau Reporting Tool . 5Application Terminology . 5Icons and Visual Cues for Fields . 6Getting Started in Tableau Desktop . 7Helpful Hints . 9Data Sources . 9Security Considerations . 10Data . 10Report Access and Security in Tableau . 10Tableau Server . 12Collecting and Assembling Data. 13Understanding Tableau Data Sources. 14Tableau Data Format . 15Connect to an Excel Data Source . 16Connecting to an Excel File with Multiple Tabs . 20Connecting to More than One Separate File . 24Data Blending . 24Cross Database Joins . 30When to Blend and When to Join . 34Connecting to a Server Data Source . 35Editing and Saving a Data Source. 38Modifying Data Attributes . 38Saving Your Data Source . 39Understanding Changes to Data . 41Mechanics of Tableau Desktop to Create Visualizations . 43Filtering . 44Filtering on a Dimension . 44
Filtering on a Measure . 47Creating Date Filters . 50Quick Filters . 55Groups . 60Create a Group from the Data Pane . 64Create a Group Using a Visual Grouping. 64Hierarchies . 69Building a Hierarchy Using Drag and Drop . 69Building a Hierarchy Using the Right-Click Menu . 69Sets . 72Creating a Constant Set. 72Creating a Dynamic Set . 76Creating a Combined Set . 79Dates in Tableau. 83Discrete vs. Continuous Dates . 84Defining a Fiscal Year . 88Custom Dates . 88Crosstabs . 90Exercise: Create a Crosstab . 91Show Me . 94Bar Charts. 95Exercise: Create a Stacked Bar Chart with a Separate Bar for Each Dimension . 95Exercise: Create a Bar Chart Stacked Bar Chart with a Separate Bar for Each Measure . 98Exercise: Create a Bar Chart with Multiple Measures on a Single Axis . 101Exercise: Create a Horizontal Bar Chart . 104Chart Customization . 106Heat Maps . 119Create a Heat Map . 119Donut Charts . 122Dashboards – Connecting Your Worksheets to One Another . 133Publishing to Tableau Server . 138Helpful Links and Resources . 142
Tableau at Princeton University OverviewCourse OverviewThe Tableau Environment at PrincetonThe Tableau Reporting ToolData SourcesTableau ServerAn Introduction to Tableau1 Page
Course OverviewThe goal for this course is to introduce Tableau within the context of its usage at Princeton University. We willteach the skills needed and provide the contact information for those who can grant access to the appropriatedata so you can get the most out of the information. Upon completion, each student should understand: How Tableau is used at PrincetonBasics of the Tableau reporting toolHow to select and use various data sourcesWhen and how to publish to the Tableau ServerThere is no preferred web browser when using the Tableau server. You may use IE, Chrome, or Safari dependingupon your personal preference.An Introduction to Tableau2 Page
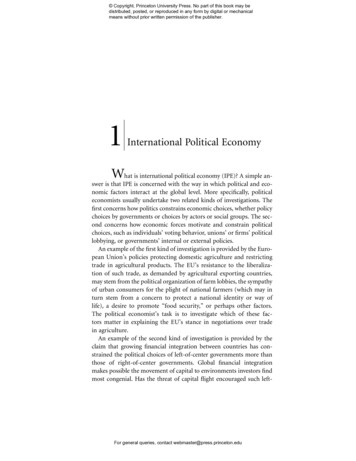
The Tableau Environment at PrincetonHow Does Tableau Fit with Cognos?It’s important to know that Tableau is not meant to be a replacement for Cognos. Here are some quick referencepoints about the two tools.Cognos will remain the primary reporting tool for the University. Represents the primary “front door” to the Information Warehouse Continued focus on operational reporting Capable of supporting analytics Scaled to support the entire University Provides a supportable platform for scheduled and ad hoc report distribution Totally browser-based with unlimited client usage Centrally managed, highly structuredTableau is an additional tool that will serve as an option for analytics and data visualization. Primary source of data will be the Information Warehouse Will not replace Cognos as the enterprise reporting tool Lacks some of the enterprise-wide reporting capabilities, such as report distribution and “bursting” Has the capability to integrate local sources of data (spreadsheets, surveys, etc.) Includes both a desktop version (limited number of licenses) and a web version for Interactors and ViewersWhat you need to know about Tableau and how we use it at PrincetonAs an introduction, let’s take a step back and give the 100,000 foot view of Tableau. It’s important to understandhow or why you might be working with your data and to assess what your level of usage might be. Below aresome important questions to consider: Will I be creating my own reports or will I only access reports others have created?Will others need to access the reports I create?Will reports I create need to be available to the general public?Do I need a license?The answer to each of these questions will determine the type of access you’ll need and how you’ll need to handlethe distribution or publication of your material.Here at Princeton, we use Tableau in a manner similar to the way in which we use the data warehouse. Differencesarise from the structure of the tool itself.Tableau ServerData SourceTableau DesktopAn Introduction to TableauTableau PublicHappy Princeton Users3 Page
You may choose from a variety of data sources. We’ll go into further detail about these in a little while.Tableau Desktop is central to the creation of all Tableau visualization and data sources. In fact, if you only wantto create reports but do not have a need for circulation or wider consumption, the desktop version would be allyou need.Tableau Server is used when you have a visualization that has been designed to be consumed by others. If youhave a specific, restricted audience and would like to control the manner in which they interact with your work,they should be defined on the server and you would publish your work to be accessed.Tableau Public is a version of server but security has been setup such that the visualizations published here maybe accessed without authentication. This is where you would publish work that you want anyone at all to viewand consume. An example of this would be a graph demonstrating historical applications to the university. Thismight be included on the Princeton public website.CeDAR takes a role in the Princeton Tableau world by centrally managing the Tableau Desktop licenses andproviding training. We also maintain the Tableau Servers (Development, Production, and Public). Finally wecoordinate the Princeton Tableau User Group where we can all share experiences and ask questions of oneanother.An Introduction to Tableau4 Page
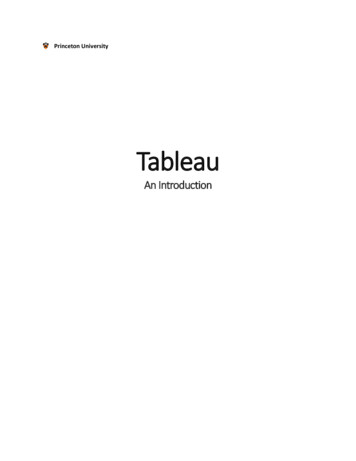
The Tableau Reporting ToolApplication Terminology1. Go to Start Page: Toggle between the active sheet and the Desktop Start Page.2. Data Pane: Includes dimensions and measures, populated from your selected data source. May alsoinclude calculated fields, parameters, or sets.3. Analytics Pane: Includes options you can use to apply reference lines, forecasts, trend lines, to add totalsto crosstabs, and to
Tableau is an additional tool that will serve as an option for analytics and data visualization. Primary source of data will be the Information Warehouse Will not replace Cognos as the enterprise reporting tool Lacks some of the enterprise-wide reporting capabilities, such as report distribution and “bursting” Has the capability to integrate local sources of data .