Transcription
Options Combinations & StrategiesAndrew Wilkinson1
Disclosure of RiskOptions involve risk and are not suitable for all investors. For moreinformation, read the “Characteristics and Risks of Standardized Options”before investing in options. For a copy call 203 618-5800 or click here.There is no guarantee of execution. Orders will be routed to US optionsexchanges.Interactive Brokers LLC is a member of NYSE, NASD, SIPCIn order to simplify the computations, commissions, fees, margin interestand taxes have not been included in the examples used in these materials.These costs will impact the outcome of all stock and options transactionsand must be considered prior to entering into any transactions. Investorsshould consult their tax advisor about any potential tax consequences.Any strategies discussed, including examples using actual securities andprice data, are strictly for illustrative and educational purposes only andare not to be construed as an endorsement, recommendation orsolicitation to buy or sell securities. Past performance is not a guaranteeof future results.2
What does the graph show me? X-axis depicts price of underlying ( ) Y-axis measures profit and loss Combines price variation with cost &P/L of trade Allows trader to immediately visualize: Trade costMaximum lossMaximum profitBreakeven points3
What does the graph show me? Buying any option costs a ‘premium’(debit) Maximum loss can be shown visuallyas a horizontal line parallel to (andbelow) the X-axis Selling an option creates a credit4
Naked Put (Bullish) Risky strategy used when trader expects underlying tokeep rising Maximum gain is the premium received at any pointabove the strike price Maximum loss is unlimited since the underlying couldturn lower Losses grow at and below strike price5
Crude Oil – Naked Put A trader might expect the price of May crude oil toresume its uptrend Using a riskier strategy of selling out-of-the-money putoptions he or she can create an account credit Strategy is safe while price is stable and rises Strategy is very risky if the trader is wrong6
Crude Oil – Naked Put Underlying May crude @ 62.04 Sell May 57.0 put @ 1.35( 1,350) Maximum gain is 1.35 andoccurs at all values from 57.0and up Breakeven is strike MINUSpremium or 55.65 Losses mount penny for pennybelow here and are essentiallyinfinite7
Naked Call (Bearish) Risky strategy used when trader expects underlying tokeep falling Maximum gain is the premium received at any pointbelow the strike price Maximum loss is unlimited since the underlying couldturn higher Losses grow at and above strike price8
10-Year Treasury Note – Naked Call Example Bond (note) prices move inversely to yields When bond prices rise, yields decline Trader assumes that bear market for bonds will continueand yields will continue to rise from 4.50 to 5.00 percent Feels comfortable receiving call premium on 10-yearnote9
10-Year Treasury Note – Naked Call Example June notes @ 109-00 Sell June 110-00 call @ 29 (29/64) Tick value of 15.625 yieldspremium of 453.13 (29* 15.625) Maximum gain is total premiumreceived at ANY price BELOW110-00 Trade breaks even at 110-29/64(strike price PLUS premium) Losses are open ended above110-29/6410
Naked Selling Although naked selling is risky and can lead to unlimitedlosses, traders use this strategy when they arecomfortable with an established trend or trading range Selling puts in bull markets can be smart Likewise, selling calls at the top of a range or throughoutbear market can be productive11
Neutral Strategies While neutral may infer dull and boring tradingconditions, savvy traders use such periods to position forcontinuation or reversal of such conditions We will now long at straddles, strangles, butterflies andcondor combinations These are made up of several of the strategies we justwent through12
Long Straddle Don’t know and don’t care which way market will move, just so longas it moves! Buy a call and a put of the same strike and expiration Combined premium is maximum loss and occurs at strike price i.e. ifmarket stagnates Breakeven occurs at: Strike price minus premium cost (put starts to payoff) Strike price plus premium cost (call starts to payoff) Maximum profit is unlimited in either direction13
Long Straddle – S&P Example Early February saw global stocks fall One week later began a recovery Trader wonders whether this is a genuine resumption ofuptrend or whether downtrend will be tested Trader decides to buy at-the-money straddles in thehope that the market doesn’t stay still14
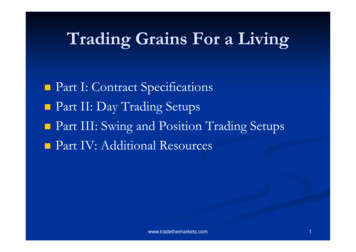
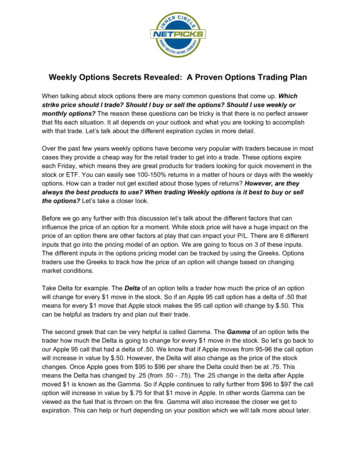
Long Straddle – S&P Example June S&P trading @ 1416.75Buy June 1415 call @ 37.75 1,887.50Buy June 1415 put @ 35.50 1,775.00Total premium and max loss is 73.25 points ( 3,662.50)Max loss would occur at the strike price since both call and put would be worthless!Trade breaks even in two places:If S&P value rises above strike plus gross cost of tradeIf S&P value falls below strike minus gross cost of tradeSo breakevens occur at 1415 73.25 1488.25 and1415 – 73.25 1341.75Remember, changing volatility will impact put and call cost15
Long Straddle16
Short Straddle For every buyer, there must be a sellerSell a call and a put of the same strike and expirationCombined premium is maximum profit and occurs at strike price i.e.if market stagnates Breakeven occurs at: Strike price minus premium income (put starts to lose) Strike price plus premium income (call starts to lose) Maximum loss is unlimited in either direction17
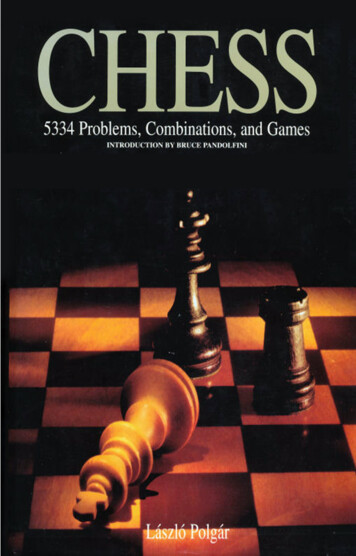
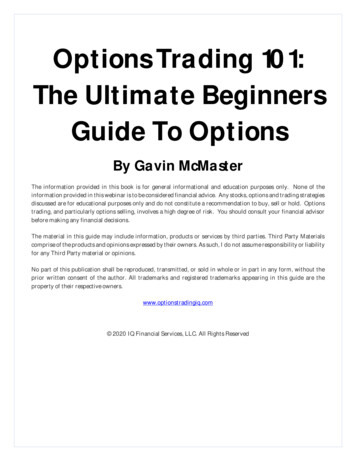
Short Straddle – S&P Example Trader might feel that the S&P index is set to stall and go nowherefor the summer Interest rates on hold, mild earnings growth and so-so growth Major bull market set to take a breather The cost of the June straddle at 73.25 points represents a /- 5.2%swing over the next 90 days If trader believes that this range is set to narrow he might sell thestraddle18
Short Straddle19
Short Straddle and Time Decay Options prices are governed largely by expectations of futuremovements based upon historical observations Read “volatility” Let’s look at the same S&P straddle but look at how time valueerodes April 1415 straddle 25 22 47 pointsMay 1415 straddle 32 29 61 pointsJune 1415 straddle 37 36 73 pointsEach month the trade loses 13 points assuming the market does stagnate20
Short Straddle and Time Decay21
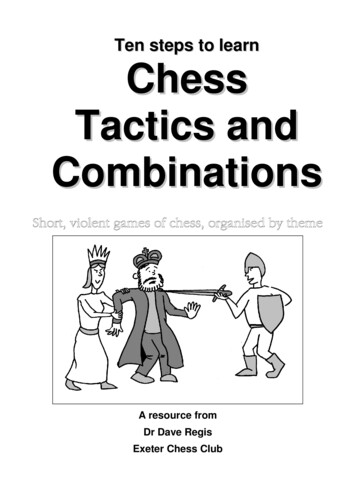
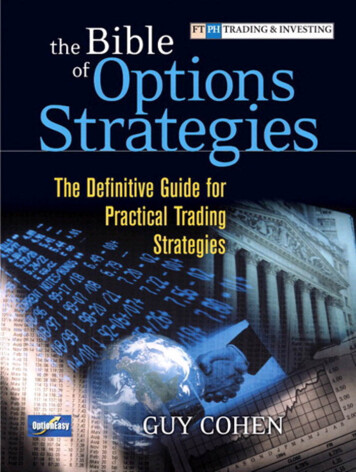
Short Straddle and Volatility Change Premiums change as volatility does The June S&P 1415 call has a six month historic implied volatilityrange of between 9-12 percent March 9, 2007 June S&P @ 1418, implied vol of 12.36 percent,June 1415 call @ 37.75 Varying volatility will change call price 9 percent volatility call premium 28.02 10 percent volatility call premium 30.92 11 percent volatility call premium 33.81 12 percent volatility call premium 36.7122
Short Straddle and Volatility Change40.00Call Premium as Implied Volatility 8.0228.0026.0024.0022.0020.009%10%11%12%23
Long Strangle The strangle differs from the straddle since it combinesputs and calls at different strike prices This can lower the cost of the trade since both strikescould be out of the money – either side of the underlying The trade still requires an explosive move in eitherdirection By settling for a lower cost trade, you may need a biggerprice swing to shift the trade to profitability24
Long Strangle Shares in Citigroup at 51.64 Trader unsure if financial stocks willslide or rocket Buys a May 50.0 put @ 0.60 Buys a May 55.0 call @ 0.10 Total premium0.70 If shares rise the call rises If shares decline put rises The trade must rise further than thenet premium paid Breakevens are 49.30 and 55.7025
How Does a Long Straddle Compare? The 52.5 straddle is pricedat 2.35 (add together calland put premium) Calculate the breakeven 52.5 minus 2.35 50.15 52.5 plus 2.35 54.85 In this case the trade costsmore to establish Breakevens are closer26
Short Strangle If a trader believes that prices will do nothing orsimply stagnate SELLING strangles could proveprofitable The trader will take in the premium by being on theother side of the previous trade Let’s revisit that chart but this tme from theperspective of the strangle SELLER We’ll measure how far share price would need tomove from its current price to hurt the strategy27
Short Strangle Citigroup shares at 51.64 Sell a May 55.0 call @ 0.10 Sell a May 50.0 put @ 0.60 Receives total premium 0.70 Trader has a “cushion” at thepremium above the call strikeand below the put strike Breakevens at 49.30 and 55.70 See how shares would need toeither rally 6.6% or fall 4.5% inorder for the trade to lose28
Long Butterfly Call or put butterflies achieve same outcome Neutral position made up of same amount of long &short positions Want shares to stagnate at the center of the trade29
Long Butterfly – Accredited Home Lenders Subprime lender whose shares had lost 67% in value Hedge fund, Farallon Capital injected 200 million loan Shares jumped 21% to 11.00 on the news Looks like a call butterfly was made A butterfly gets the name from the p/l profile it creates When describing “long or short” we are referring to“wings” A butterfly covers three consecutive strikes A long position means buying the lower and the upperstrike while selling TWICE as many of the middle strike30
Long Butterfly – Accredited Home Lenders Shares at 11.00 Buy 1 call with 10.0 strike @ Sell 2 calls with 12.5 strike @ Buy 1 call with 15.0 strike @ Net cost1.50debit0.85 (*2 1.7) credit0.65debit0.45debit31
Long Butterfly – Accredited Home Lenders Strikes 10.0, 12.5 & 15.0 Net cost 0.45 Max loss 0.45 Max profit 2.05 Lower breakeven 10.45 Upper breakeven 14.5532
Long Butterfly – Accredited Home Lenders Try to think of the net position –long 2 calls/ short 2 calls That’s why at breakeven in both directions we have theflat line Max loss is limited to the premium paid Breakeven is the spread between strikes minus cost(2.5-0.45 2.05) Added to lower strike Subtracted from upper strike10.0 0.45 10.4515.0 – 0.45 14.55 Maximum profit is at the strike and is the spreadbetween strikes minus cost (2.05)33
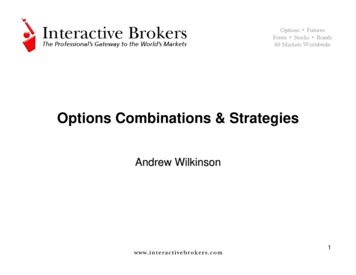
Short Butterfly - Amgen Aim is to capture some premium at May expiration Amgen shares slumped from 76 to 56 Damaged by damaged by fears over poor results tolong-term study of top-selling Aranesp anemia drug The latest report was positive and shares spent severaldays rallying before and on the report’s release Taking the view that the report will draw a line under thestock take in some premium in the hope that: Shares will riseShares will NOT revisit the 60.00 level – if they do I don’t want them tostay there If shares continue to fall I want them to revisit the recent low34
Amgen Share Price35
Amgen Short Butterfly Sell one 55.0 put Buy two 60.0 puts Sell one 65.0 put Net@ 0.20@ 1.00 (2.00)@ 3.601.80creditdebitcreditcredit36
Amgen Short Put Butterfly Strikes 55.0, 60.0 & 65.0 Net credit 1.80 Max loss 3.20 Max profit 1.80 Lower breakeven 56.80 Upper breakeven 63.2037
Ratio Put Spread Decline in price of underlying seen as limited Trade combines long put position with multiple shortpositions at different strikes but same expiration The aim is to reduce the initial premium outlay for thestrategy But by holding a net short position the risk is increasedsince at some point the investor is vulnerable tosubstantial losses38
Ratio Put Spread Qualcomm was heading into earnings - one investorremained cautious on the stock at 43.30 Bought one April 42.50 put @ 0.90 Sold two April 40.00 puts @ 0.30 (*2 0.60) Net cost is0.3039
Ratio Put Spread Strikes 40.0 & 42.50 Net cost/premium 0.30 Upper breakeven 42.50 – 0.30 42.20 Lower breakeven 40.0 – 2.2 37.80 Maximum profit of 2.2 Is at lower strike 40.0 Losses are unlimitedbelow 37.8040
Ratio Call Spread Used when shares expected to rise to a resistance point Used to “cheapen” the cost basis of the trade Trade established at a cost Profits are easily defined – but revert to losses if sharesrunaway to the upside41
Ratio Call Spread April 17 Apple Computer shares trading at 90.00 Investor remains bullish and decides to buy callspread Buys one May 95.0 call@ 2.00 Sells two May 100.0 calls@ 0.90 (*2 1.80) Net cost of 1*2 call spread is 0.2042
Ratio Call Spread Strikes 95.0 & 100.00 Net cost/premium 0.20 Lower breakeven 95.0 0.20 95.20 Upper breakeven 100.0 4.8 104.80 Maximum profit of 4.8 Is at upper strike 100.0 Losses are unlimitedbeyond 104.8043
Ratio Spreads With a common 1*2 ratio spread, trade cost kept lowThe downside is that risks are increasedHowever, there is an inbuilt cushion of profits that must be erodedbefore losses are incurred beyond strike prices where the trade isnet short In Qualcomm example share price would need to fall 7.6% to reachlower strike, but 12.7% to start losing money In Apple, shares would need to rally 11.1% to maximize profits but16.5% before losing money It is possible to increase ratio to create CREDIT spreads, but bydoing this risks are increased also44
Conclusions The opportunity with options combinations is endless Define your trade scenario before you start How bullish or bearish are you? Somewhat, or a lot? Selling premium has both benefits and risks Consider the implied ranges that prevailing optionsprices are telling you about45
Buying any option costs a ‘premium’ (debit) Maximum loss can be shown visually as a horizontal line parallel to (and below) the X-axis Selling an option creates a credit. 5 Naked Put (Bullish) Risky strategy used when trader expects underlying to keep rising Maximum gain is the premium received at any point above the strike price Maximum loss is unlimited since the underlying could turn .