Transcription
Trading Grains For a Living Part I: Contract SpecificationsPart II: Day Trading SetupsPart III: Swing and Position Trading SetupsPart IV: Additional Resourceswww.tradethemarkets.com1
Part I:Contract Specifications, for Corn, Wheatand Soybeans, or, “How much money doI need to trade these things?”www.tradethemarkets.com2
How do the AGS work? Contract specification for all AGS is just like the eminiS&P futures.In the emini S&Ps, 1 quarter point tick 12.50 and 1full point 50. 50 also equals the equivalent 10 point YM move.In the AGS, 1 quarter cent tick 12.50 and a full 1cent move 50.So 1 full cent in the AGS is like catching 1 ES point or10 YM points.The AGS have a similar “cent” movement each day thatlines up with the S&P “point” movement.www.tradethemarkets.com3
How do the AGS work? Corn is typically the least volatile of the grains,though that has changed recently with the highinterest in ethanol.Soybeans are typically the most volatile of thegrains. Wheat can vary depending on weatherconditions but is often in the middle of the 2.Maintenance Margin on ES and YMwww.tradethemarkets.com4
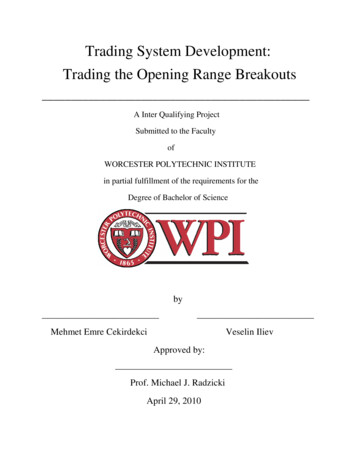
Market Price Range of corn, wheat, soybeans and S&P futuresfrom April 12 – May 3, 2007Corn Range:349 – 394 (45 points) 2250 per contractWheat Range:448 – 520 (72 points) 3600 per contractSoybean Range:708 – 760 (52 points) 2600 per contractS&P Futures Range:1442 – 1509 (67 points) 3350 per contractwww.tradethemarkets.com5
How do the AGS work? Catching a 20 cent move in AGS is like catching20 points in the ES or 200 points in the YM.This move in all cases equals 1,000 per contract.A full 1.00 move in the AGS equals 5,000 percontact, or the same as 100 ES points or 1,000YM points.If you are comfortable with the emini S&P andthe minimini-sized Dow, then there is no reason totrade the “mini“mini-AGS.”This would be like trading a “mini of the emini”on the stock index futures.www.tradethemarkets.com6
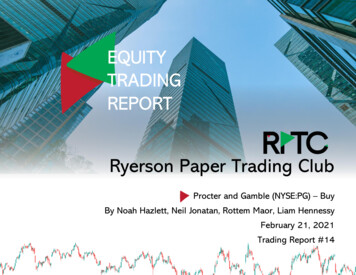
Day Trade Comparison of Grains vs. Stock Index Futureswww.tradethemarkets.com7
How do the AGS work? Pit traded hours are 9:30 a.m. to 1:15 p.m.central. This is where the volume is. Pit andelectronic trade side by side during this time.You can trade during the nonnon-pit hours from6:32 p.m. to 6:00 a.m. central. This session iselectronic trading only.Electronic Symbols are ZS, ZW, and ZCQuotes: If C, W or S is trading at: 2.38 ½ it is quoted as 2384 (238 4/8) 2.38 ¾ it is quoted as 2386 (238 6/8) www.tradethemarkets.com8
What About Mini Ags? These are 1/5 the size of the full sized AGS andtrade in 1/8 cent tick increments, with each tickmeasuring 1.25A ¼ cent tick 2.50 and 1 full cent 10.00Margin is 200I personally don’t trade these as I like the fullsized contracts, but they are great for getting afeel of how the AGS work with 1/5 theexposurewww.tradethemarkets.com9
Contract months are different than ES and YM, which trades eachquarter. AGS have more trading months each year. Corn: Jul, Sep, Dec, Mar, May Wheat: Jul, Sep, Dec, Mar, May Soybeans: Jul, Aug, Sep, Nov, Jan, Mar, MayIf you aren’t sure of the front month, just check the CME Group website:www.tradethemarkets.com10
Part II:Day Trading Setupswww.tradethemarkets.com11
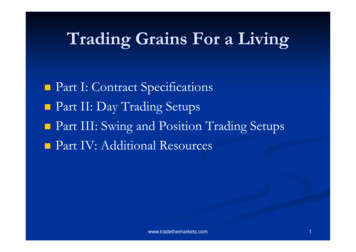
Grains Provide Opportunities for Position, Swing and Day Tradingwww.tradethemarkets.com12
What About “Limit” Moves?Limit moves prevent trading outside of a prepre-specifiedinterval from the settlement price of the previous day.Limits for Grains:Corn: was 20 cents now 30 cents, Wheat: was 30 centsnow 45 cents and Soybeans: was 50 cents now 70 centsThese moves generally happen after grain sensitivereports are released. For report schedule, check: www.cmegroup.com then search for “grain reports”www.nass.usda.govSwing Trades can be hedged with options (go longfutures, then buy puts to protect against a limit downmove)www.tradethemarkets.com13
What About “Limit” Moves? For day trading, limit moves provide tradingopportunities.Example, is corn goes “limit up” and wheat andsoybeans are not “limit up” then these othergrains will generally rally (or vice versa if corn is“limit down.”This also provides a hedging opportunity—opportunity—if youare short corn and it goes limit up, then buywheat or soybeans as a potential hedge.www.tradethemarkets.com14
www.tradethemarkets.com15
Key Points for Day Trades There are times when AGS trade in a slow,narrow range.And there are times when they “go nuts.”When the AGS are quiet, they all generallymove in about the same range.When the AGS “go nuts” Soybeans generallymove 3 to 4 times as much as corn or wheat.www.tradethemarkets.com16
www.tradethemarkets.com17
Key Points for Day Trades I like to watch both pit and electronicsessions on charts.charts.For the pit session, I’ll look at a 3 minutechart, let the markets trade for 30 minutes,then start taking the breaks of the highs andlows of the pit session.For the electronic session, I’ll look at an 89tick chart, and look for 8/21 MA crossovers,TTM Trend Changes, Squeezes, and Scalperswww.tradethemarkets.com18
Corn Day Trading Setupwww.tradethemarkets.com19
Wheat Day Trading Setupwww.tradethemarkets.com20
Soybean Day Trading Setupwww.tradethemarkets.com21
Trade The Markets (TTM) TrendWhat is it ? We use this indicator a lot, so we want to explain itearly in the seminar as it comes up on many charts.Modified Version Of the HeikinHeikin-Ashi Technique.It’s just a easier way to look at candle sticks.The heikinheikin-ashi method (heikin means "average" or"balance" in Japanese, while ashi means "foot" or"bar") is a visual technique that eliminates irregularitiesfrom a normal chart, offering a better picture of trendsand consolidations.www.tradethemarkets.com22
Trade The Markets Trendhow is it calculated? The heikinheikin-ashi candlestick technique uses modified openopen-highhigh-low--close (OHLC) values and displays them as candlesticks but Ilowhad them converted to paint bar studies . The modified valuesare computed using these definitions: haClose (O H L C)/4haOpen (haOpen (previous bar) haClose (previous bar))/2haHigh Maximum(H, haOpen, haClose)haLow Minimum(L, haOpen, haClose) www.tradethemarkets.com23
www.tradethemarkets.com24
Part III:Swing and Position Trading Setupswww.tradethemarkets.com25
Soybean Trading Setupwww.tradethemarkets.com26
Corn Swing Trading Setupwww.tradethemarkets.com27
Wheat Swing Trading Setupwww.tradethemarkets.com28
Weekly Charts – Even if Your Just Day Tradingwww.tradethemarkets.com29
Soy Position Trading Setupwww.tradethemarkets.com30
Corn Position Trading Setupwww.tradethemarkets.com31
Part IV:Additional Resourceswww.tradethemarkets.com32
Attitude of a Trader Right attitude will make or break a traderBiggest obstacles are Greed and EuphoriaGreed KillsGreed takes over and mistakes kick in:overtrading, not sticking to parameters, yelling atscreenAll you can eat buffet: no reason to overloadyour plate on 1 trip; you can keep going backwww.tradethemarkets.com33
Attitude of a Trader (cont.) Euphoria is worse than GreedThings are going great – so double up!This is like eating a great dinner. It tastes reallygreat.So, to make your life even better you order asecond plateThis will only end in one way:Badly: Develop a business plan and stick to it!www.tradethemarkets.com34
www.tradethemarkets.com35
www.tradethemarkets.com36
www.tradethemarkets.com37
Book released December, 2005www.tradethemarkets.com38
John CarterTrade the .com39
The heikin-ashi candlestick technique uses modified open-high-low-close (OHLC) values and displays them as candlesticks but I had them converted to paint bar studies . The modified values are computed using these definitions: haClose (O H L C)/4 www.tradethemarkets.com 23 haOpen (haOpen (previous bar) haClose (previous bar))/2 haHigh Maximum(H, haOpen, haClose) haLow