Transcription
University of JordanFaculty of Engineering and TechnologyDepartment of Chemical EngineeringChemical Engineering Laboratory(4)Manual SheetNovember/2016Version 5
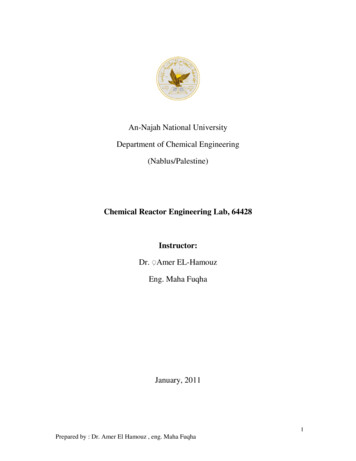
University of JordanFaculty of Engineering and TechnologyDepartment of Chemical EngineeringChemical Engineering Laboratory (4)Continuous Stirred Tank ReactorExperiment (1)ObjectiveTo determine the kinetics and reaction rate constant of the essentially irreversiblereaction between ethyl acetate and sodium hydroxide by the capacity flow method andto measure the residence time density function of the effluent stream.ApparatusContinuous stirred tank reactor-see Fig.(1)- consisting of reaction vessel, two feedtanks with two pumps, two flow meters and sump tank. Brinkmann pc-600 ProbeColorimeter, continuous chart recorder and glassware for concentrationmeasurements.2
ProcedurePart A1. Prepare 40 liters of 0.04 M solution of ethyl acetate and 0.04 M sodiumhydroxide , 2 liters of 0.03 M solution of HCl and 0.03 M NaOH(Chemicals prepared should be standardized).2. Place the 40 liters solutions into the feed tanks.3. Switch on the pumps, allow the solutions to be delivered to the reactor atequal flow rates and set the stirrer to maximum speed.4. At steady state find the conversion of NaOH.5. Repeat the experiment at two different flow rates and at the sametemperature.6. Determine the form of the rate equation between ethyl acetate and sodiumhydroxide.Part B1. Fill the reactor with tap water.2. Calibrate the spectrophotometer-recorder combination by plotting a graphof transmittance vs pen deflection.3. At zero time introduce a pulse of colored tracer (phenol red) into thereactor and record the change of transmittance vs time.Calculations1. Determine the reaction rate equation (n, K).2. Determine E-curve of the effluent stream and determine the reactors flowmodel.References1. Levenspiel, O., “Chemical Reaction Engineering”, Second Edition, JohnWiley and Sons, 1972.2. Denbigh, K.G. and Page, F.H., Disc. Faraday Soc., 17 145 (1954).3. Kendall, H.B., Chem. Eng. Progr. Symp. Ser. 70 (73), 3 (1976).4. Wen, C.Y. and Chung, S.F., Can. J. Chem. Eng., 43, 101 (1965).3
Continuous Stirred Tank Reactor's data sheetTitrants:Conc. of HCLConc. of NaOHReactants:Volume of NaOH sampleVolume of HCl needed for titrationVolume of ethyl acetate sampleVolume of NaOH addedVolume of HCl needed for titrationItemRun 1Run 2Run 3Flow rate of ethyl acetateFlow rate ofhydroxideResidence timesodiumSample 1:Volume of NaOHSample 2:Volume of NaOHSample 3:Volume of NaOHTemperature4
University of JordanFaculty of Engineering and TechnologyDepartment of Chemical EngineeringChemical Engineering Laboratory (4)Temperature MeasurementExperiment (2)Objectives:1. To be familiar with many different methods of measuring temperature,highlighting accuracy, calibration and error sensitivity of each in a variety ofworking conditions.2. To introduce the students to the international Temperature Scale, and allowsinvestigation of the Platinum resistance temperature measurement method thatforms a fundamental part of the standard.Equipment:The unit consists of a small bench mounted Console contains a number of differentinstruments and connection points for sensors. A temperature controlled heater plateis also available as well as a computerized data acquisition system with computermonitor and printer. The sensors available are: Platinum Resistance, Thermistor, &three types of thermocouple. A vacuum flask and stainless steel beaker are alsoavailableTheory:Temperature can be defined technically as an indication of intensity of molecularactivity. The temperature of a body is a measure of the thermal potential of that bodyand determines whether heat is supplied to or rejected from the body when in contactwith a body at different temperature.Different scales are used in thermometry such as Centigrade scale which is based onthe point at which ice melt and pure water boils at standard atmospheric pressure. TheCelsius scale indicated that the ice point be substituted by the triple point which in thestate of pure water existing as a mixture of ice, liquid and vapor in equilibrium, andequals 0.01 celsius. Another scale is the Kelvin scale, and another one is theinternational temperature scale.5
Procedure:Several experiments can be performed in the temperature measurement unit:Exp. No. 1The use of liquid in glass thermometer, Vapor pressure & bi-metallic expansiondevices for measurement of fixed scale point.1. Partially fill the vacuum flask with ice and water and place one of the glasstube thermometers in the mixture.2. Fill 2/3 of the stainless steel beaker with pure water and place rubber disc ontop, place the beaker on heater plate and turn on the main switch. Set theheater plate to a temperature of about 200 C.3. Once the water has reached boiling point, turn the temperature setting down toabout 120 C.4. Record the temperature of the water in the beaker and in the vacuum flask.5. Repeat using vapor pressure thermometer & the bi-metallic expansionthermometer instead of liquid in glass thermometer.Exp.No.2Response of different temperature measuring devices as temperature changeswith time.1. Fill 2/3 of the stainless steel beaker with pure water and place rubber disc ontop, place the beaker on heater plate and don’t turn on the main in this stage.2.Place the Glass thermometer, Platinum resistance, Thermistor and theThermocouple in the unheated water in the beaker and switch on the heaterplate and set the heater plates to temperature 200 C.3. Start recording the temperature using the computerized unit.4. Record the temperature of the thermometer each 30 sec.5. Once the water has reached boiling point, turn the heater off and stoprecording.6
Exp.No.3a- The Peltier thermo-electric effect.1. Partially fill the vacuum flask with ice and water, and fill 2/3 of the stainlesssteel beaker with pure cold water and place rubber disc on top, place thebeaker on heater plate and don’t turn on the main in this stage.2. Put water in a beaker and measure the ambient temperature by using the glassthermometer.3. Select one of the shrouded type K thermocouple and do the instructedconnection.4.Now place the thermometer with the thermocouple in the unheated water inthe beaker and switch on the heater plate and set the heater plate totemperature of about 200 C.5. Start recording the temperature and millivolt signal by using the computerizedunit.6. Record the temperature of the thermometer each 30 sec.7. Once the water has reached 40 C, stop recording and turn the temperaturesetting down to about 120 C.b- Seebeck effect.1. Select two of the shrouded type K thermocouples and connect them asinstructed.2. Place BOTH thermocouples in the vacuum flask and record the millivolt.3. Place one thermocouple in the stainless steel beaker on the hot plate togetherwith a glass thermometer, and record the millivolt.4. Place the thermocouple that has been immersed in the vacuum flask into thehot water with the other thermocouple, note the millivolt reading.5. Now reverse the positions of the thermocouples (Hot beaker thermocouple tovacuum flask), and record the millivolt.7
Exp. No. 4Voltage calibration of different thermometer types using water-ice reference.1. Select two of the shrouded type K thermocouples.2. Partially fill the vacuum flask with ice and water, and fill 2/3 of the stainlesssteel beaker with pure water and place rubber disc on top, place the beaker onheater plate and don’t turn on the main in this stage.3. Connect the two thermocouples as instructed, and put one of the thermocouplein vacuum flask and the other in the beaker with a glass thermometer.4. Plug in the Platinum resistance plug and the Thermistor plug to the unit andplace the probes in the water in the beaker.5. Switch on the heater plate and set the temperature to 200 C.6. Start recording the temperature and the millivolt signal by using thecomputerized unit at regular intervals until the water boils.Exp. No. 5The law of intermediate metals and intermediate temperature associated withthermocouple.1. Select two of the shrouded type K thermocouples.2. Partially fill the vacuum flask with ice and water, and fill 2/3 of the stainlesssteel beaker with pure water and place rubber disc on top, place the beaker onheater plate and don’t turn on the main in this stage.3. Connect the two thermocouples as instructed by using the two greenthermocouple extension leads supplied, and put one of the thermocouple invacuum flask and the other in the beaker.4. Switch on the heater plate and set the temperature to 200 C. Once the waterhas reached boiling point, turn the temperature setting down to about 120 C.5. Record the millivolt reading.6. Immerse either junction A, B, or C in the ice-water mixture or the boilingwater and record the millivolt.7. Break the junction B and rejoin this using a RED or BLACK copperconnecting lead, and record the millivolt.8. Immerse the two new junctions either in the ice-water or boiling water, andrecord the millivolt.9. Remove the RED or BLACK copper lead and record the millivolt.8
10. Take the thermocouple from the ice-water and hold it in your hand until themillivolt meter display is constant and then record the millivolt.11. Replace the thermocouple in the ice-water and allow the millivolt meter toreturn to its original reading.12. Now remove the other thermocouple from the boiling water ALLOW TOCOOL SLIGHTLY and then hold in your hand as before until the millivoltmeter display is constant and record the millivot reading.Exp. No. 6Connection of thermocouple in parallel for averaging of measured temperatureand series for signal amplification1. Partially fill the vacuum flask with cold water, and fill 2/3 of the stainless steelbeaker with pure water and place rubber disc on top, place the beaker onheater plate and turn on the main switch. Set the temperature to about 200 C.2. Once the water has reached 70 C, turn the temperature setting down to about120 C.3. For parallel; select two of the type K thermocouples, connect the two type Kthermocouple to any two of the thermocouple sensor sockets.4. Place one thermocouple in the vacuum flask and the other in a beaker, full ofhot water of about 70 C.5. Depress the switches INDIVDUALLY and record the temperature. Thendepress both switches together and record the temperature.6. For Series; select four type K thermocouples (two shrouded and two exposedtip) and connect them as instructed.7. The BLACK thermocouples plugs are shown as B, the RED thermocouplesplugs are shown as R, the thermocouples junctions are shown as K. The pair ofthermocouples shown as H are in the stainless steel beaker and the pair ofthermocouples shown as C are shown in the vacuum flask.8. Once the water in the stainless steel beaker starts boiling, observe and recordthe millvolt meter display.9
Calculation:Each number indicates to experiment number:1. Record the temperature of the water by using Glass thermometer, Vaporpressure, Bi-metallic expansion device, Platinum resistance, Thermistor &Thermocouple, and explain why the temperature doesn’t reach 0 C and 100 C.2. Plot the temperature readings of the devices used versus time and note theresponse of each measuring device.3. Record the reading of millivolt as indicated and explain the negative readingyou get in both Peltier thermo-electric effect & Seebeck effect.4.Refer to the tables in the lab sheet for a type of thermocouple that you used inthis experiment showing the millivolt signal and corresponding temperaturewhen the reference junction is held at 0 C and at each temperature reading,compare between the recorded millivot reading and the millivolt from thetable that corresponds to that temperature.5. Record the reading of millivolt as indicated and explain your results.6. Record the reading of millivolt as indicated and explain your results.10
Temperature MeasurementPart 1ThermometerTemperature ( C )Glass thermometerVapor pressureBi-metallicPlatinum resistanceThermistorThermocouplePart 2TimeTemperature ( C )Glass thermometer11
Part 3a- Peltier thermo-electric:Ambient temperature:TimeTemperature ( C )Glass thermometerb- Seebeck effect:VoltageBoth thermocouples in cold waterThermocouple (1) in cold and (2) in hotThermocouple (2) in cold and (1) in hot12
Part 5Intermediate metal:Voltage for the junction without intermediate metal:VoltageJunction A in hot waterJunction B in hot waterJunction C in hot waterJunction A in iceJunction B in iceJunction C in iceVoltage for the junction with intermediate metal:VoltageJunction B in hot waterJunction B’ in iceIntermediate Temperature:VoltageE hot – E iceE hot-E handE hand- E icePart 6Parallel connection:Series connection:Temp by depress switch # 1Temp by depress switch # 2Temp by depress switch # 3Voltage Temp by depress switch #Temp by depress switch1 2#1 2 313
University of JordanFaculty of Engineering and TechnologyDepartment of Chemical EngineeringChemical Engineering Laboratory (4)TEMPERATURE MEASUREMENT(PART 1)Experiment (2)1-THE PELTIER THERMOELECTRIC EFFECT:Objective: To demonstrate the temperature dependent of electrical potential producedby dissimilar metals in contact.Equipment: See the attached sheet.Theory:The Peltier thermoelectrical effect (1834) can be stated as follows: current flowingacross a junction of dissimilar metals causes heat to be absorbed or liberated. Thedirection of heat flow can be reversed by reversing the current flow. The rate of heatis proportional to temperature versus the voltage reading.Requirement: plot the measured temperature versus the voltage reading.2-THE SEEBECK THERMO-ELECTRICAL EFFECT:Objective: To demonstrate the resultant electromotive force produced in athermocouple circuit.Equipment: See the attached sheet.Theory:The Seebeck effect or Seebeck principle discovered by T.J Seebeck (1821) states thatan electric current flows in a circuit of two dissimilar metals if the two junctions are atdifferent temperatures.14
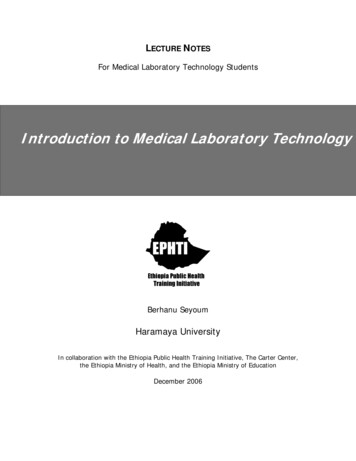
In figure 1: The temperature of the hot junction is the temperature being measuredand Tc is the cold junction temperature or the reference temperature. The mostcommon thermocouples are: platinum-rhodium/platinum, chromel/alumel, andcopper/constantan. The circuit in figure 1 can be used for temperature measurementas shown as in figure 2. In chemical industries, sometimes it is not possible tomaintain the cold junction at 0 C. Normally, the cold junction is at ambienttemperature, with correction is made automatically by temperature-sensitive resister.MMFig.(1): Electro-thermal circuit of two dissimilar metals.Reference junctionMMeasuring junctionFig.(2): Thermocouple circuit.References:1. Shahian, B. and Hassul, M., Control System Design. Prentice Hall, 1993.2. Considine, D., M., Process Instruments and Control Handbook. McGrawHill, 1974.15
University of JordanFaculty of Engineering and TechnologyDepartment of Chemical EngineeringChemical Engineering Laboratory (4)TEMPERATURE MEASUREMENT(PART 2)Experiment (2)1-THE LAWS OF INTERMEDIATE METALS ANDTEMPRETURES:Objective: To demonstrate the effect of introducing different types of metals in athermocouple circuit, and the principle of intermediate temperatureEquipment: See the attached sheet.Theory:Several thermoelectric laws have been established experimentally by measuring thecurrent resistance, and emf in thermoelectric circuits. These laws are experimentallyaccepted despite the lack of theoretical development. In fact, we need not tounderstand the complexities of electron-phonon (the quantum particles of thermalconduction waves) to understand the working principles of thermocouples. We needonly to pay attention to the understanding the laws of thermoelectricity.1-Law of homogeneous materials:A thermoelectric current cannot be sustained in a circuit of a single homogeneousmaterial by the application of heat alone. A fact could be drawn from this law thattwo different types of metals are required to construct any thermocouple circuit.Experiments have shown that a measurable thermoelectric current flows in a circuit ifa nonsymmetrical temperature gradient is set up in a homogeneous wire. This for nodoubt is attributed to non-homogeneous metals.2- Law of intermediate metals:The algebraic sum of the thermoelectromotive forces in a circuit composed of anydissimilar metals is zero provided that all of the circuit is at a uniform temperature.16
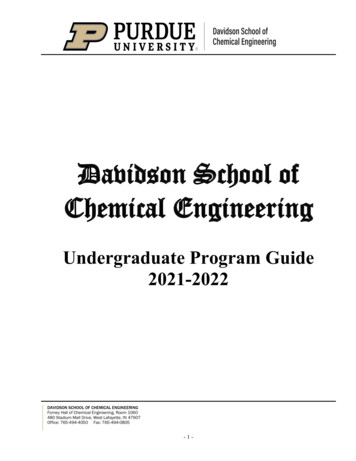
A consequence of this law is that a third homogeneous wire can be added in athermocouple circuit as long as its extremities are kept at the same temperature. So adevice for measuring the thermoelectromotive force can be introduced into a circuit atany point without effecting the net emf if all the connections at the same temperature.In Figure 1:if T1 T2, then from the Seebeck principle the net emf is zero.3- Law of successive or intermediate temperatures:If two dissimilar homogeneous materials produce a net emf of Eti ,t0 when the twojunctions are at T, TI, the emf generated when the junctions are at T and T0 is given by:ET ,T0 ETI ,T0 ET ,TI(1)Metal CTTTcAFigure (1): Thermocouple circuit with intermediate metal type C.Equation (1) is evident from Figure 2 and the Seebeck principle:TTFigure (2): Emfs are additive for materials.ET ,TI T TI 17
ETi ,T0 TI T0 ET ,T0 T T0 ET ,T0 ETI ,T0 T T0 TI T0 T TI ET ,TINote that equation 1 follows from the last result, where TI satisfies: T0 TI T .Questions:1. A thermocouple of type J (iron-constantan) has the following input-outputdata from standard tables:T ( C ):030300emf (mV):01.5152. Discuss the validity of the law of intermediate temperatures on the basis ofSeebeck principle over a wide temperature range (0 t0 500 C).References:1. Considine, D. M., Process instruments and control handbook. McGraw-Hill,1974.2. Benedict, P. E., Fundamentals of temperature, pressure and flowmeasurements. John Wiley, 1984.3. Bolton, W., Mechatronics: electronic control systems in mechanicalengineering. Longman, 1997.18
University of JordanFaculty of Engineering and TechnologyDepartment of Chemical EngineeringChemical Engineering Laboratory (4)TEMPERATURE MEASUREMENT(PART 3)Experiment (2)Objectives: To understand the static and dynamic characteristics of measuringdevices and in particular temperature measuring devicesEquipment: See the attached sheet.Temperature Sensors:One of the most important variables in chemical industries is the temperature. It is notonly used as a direct control variable, but also as a means to infer about othercontrolled variables (inferential control). Table 1 below shows the most popularsensors used for temperature measurement.The term sensor is used to identify an element that produces a signal when subjectedan input physical change. Often the term transducer is used interchangeably with theterm ratureMeasurement.I. Expansion thermometersA. Liquid-in-glass thermometersB. Solid-expansion thermometers (bimetallic strip)C. Filled-system thermometers (pressurethermometers)1. Gas-filled2. Liquid-filled3. Vapor-filledII. Resistance-sensitive devicesA. Resistance thermometersB. ThermistorsIII. Thermocouples19
1. Expansion thermometers:Liquid-in-glass thermometers: indicate temperature change caused bythe difference between the temperature coefficient of expansion for glass andthe liquid employed. Mercury and alcohol are the most widely used liquids.2. Solid Expansion thermometers (Bimetallic strip):Bimetallic strip thermometer: The working principle depends ondifferent expansion coefficients of metals as a function of temperature. Fig(1)shows a typical bimetallic strip thermometer. The temperature-sensitiveelement is a composite of two different metals fastened together into a strip. Acommon combination is invar (64% Fe, 36% Ni), which has a low coefficient,and another nickel-iron alloy that has a high coefficient.Fig.(1): Details of bimetallic strip thermometer [1].3. Filled-system thermometers (pressure thermometers):A typical filled-system thermometer. is shown in Fig.(2) The fluid expands orcontracts due to temperature variations which is sensed by theBourdonspring and transmitted to an indicator or transmitter. These elements arepopular in the chemical process industries.due to their design simplicity andrelatively low cost.Resistance thermometers Devices(RTD): Fig.(3) shows RTD whichbased on the principle that the electrical resistance of pure metals increaseswith an increase in temperature. This provides an accurate way to measuretemperature because measurements of electrical resistance can be made withhigh precision.20
Fig.(2): Filled system thermometer [1,4].The resisitance of most metals increases linearly with temperature:Rt R0(1 aT )(1)The most commonly used metals are platinum, nickel, tungsten, and copper. AWheatstone bridge is generally used for the resistance reading and, consequently, forthe temperature reading.Fig.(3): Resistance thermometer device (RTD): a- Assembly. b- Components [1,4].21
1. Thermistors:Modern thermistors are usually mixtures of oxides such as the oxides ofnickel, manganese, iron, copper, cobalt and titanium, other metals and dopedceramics. The material is formed into various forms such as beads discs androdes as shown in Fig.(4). Thermistors can have either a negative temperaturecoefficient (NTC), where the resistance decreases with temperature, or apositive temperature coefficient(PTC) depending on the type of materials used.They were originally named from a shortened form of the term thermallysensitive resistor. The resistance-temperature relationship can be described by:R Ke b / TWhere(2)K and b are constants.Fig.(4): Thermistor construction [2,4].Fig.(5): Thermocouple circuit2. Thermocouples:The thermocouple is the best-known industrial temperature sensor. It works ona principle discovered by Seebeck in 1821. The Seebeck effect, or Seebeckprinciple, states that an electric current flows in a circuit of two dissimilar metalsif the two junctions are at differenttemperatures. Fig.(4) shows a simple22
circuit in which M1 and M2 are the two metals, TH is the temperature beingmeasured, and TC, is reference temperature. The voltage produced by thisthermoelectric effect depends on the temperature difference between the twojunctions and on the metals used.Static Characteristics:The output values given when steady state condition is attained, after a certaininput is received, are known as static characteristics of the sensor. The mostimportant static characteristics are:1. Range: The limits between which the input can vary.2. Error: The difference between the true (standard) value and the result ofmeasurement.3. Accuracy: The extent to which the value indicated by the measuring device iswrong. It is the sum of all the possible expected errors including thecalibration accuracy.4. Precision: It describes an instrument’s degree of freedom from random errors.If a large number of readings are taken of the same quantity by a highprecision instrument, then the spread of readings will be very small.5. Repeatability: It describes the closeness of output readings form themeasuring device when the same input is applied repetitively over a shortperiod of time, with the same measurement conditions, same instrument andobserver, same location and same conditions of use maintained throughout.6. Reproducibility: describes the closeness of output readings for the same inputwhen there are changes in the method of measurement, observer, measuringinstrument, location, conditions of use and time of measurement. Fig.(6)compares the accuracy, repeatability and reproducibility.7. Sensitivity: Sensitivity is the ratio of the change in response of an instrumentto the change in the stimulus (how much output you get per unit input).8. Hysteresis: The difference between the measuring device readings during acontinuously increasing and decreasing change of the input. Fig.(7) shows atypical hysteresis curve.23
TargetFig.(6): Comparison of accuracy and precision.Fig.(7): Measuring device static characteristics with hysteresis.Dynamic Characteristics:The dynamic characteristics of a measuring instrument describe its behaviour betweenthe time the input value changes and the time the instrument output attains a steadyvalue in response.24
In any linear, time-invariant measuring system, the following general relation can bewritten between input and output for time t 0:d nyd n - 1ydya n n a n - 1 n - 1 .a 1 a 0y b0udtdtdt(3)Where y and u are the output and input respectively, a 0, a 1,.a n and b0 are constantmodel parameters.1. Zero-order dynamics: An instrument is said to show zero-order dynamics, ifit responds instantaneously to the applied input. Mathematically, this meansthat: a n a n - 1 .a 1 0 . Consequently, the instrument sensitivity(gain) is given by:Ke bDy 0Dua0(4)Fig.(8) shows the response of such instrument.Fig.(8): Zero-order instrument dynamic response.2. First-order dynamics: An instrument is said to show first-order dynamics, ifit reaches 63 percent of the final steady state value after a time equals oneinstrument time constant. First-order dynamic instruments follow a dynamic25
response given by Eq.(3) after settingresults in:a1a n a n - 1 .a 2 0 whichdy a 0y b0udt(5)Fig.(9): First-order dynamic characteristics.The above equation is solved for the output after replacing: d / dt by theoperator to get:y (b0 / a 0 )uK eu 1 t eD1 (a 1 / a 0 )DD(6)Where: Ke and t e are the instrument sensitivity and time constant respectively. Theexact solution of Eq.(6) due to step change in u is shown in Fig.(9). In this figure theoutput response reaches 99 percent of its final value after five time constants ( 5t e ).A good example for such instrument (first order instrument) is the liquid-in-glassthermometer. If a thermometer at room temperature is plunged into boiling water, theoutput does not rise instantaneously to a level indicating 100 C, but insteadapproaches a reading indicating 100 C in a manner similar to that shown in Fig.(9).26
Requirements:1. Study experimentally the static and dynamic characteristics of the availabletemperature measuring instruments in the Lab.2. Investigate the dynamic linearity of the selected temperature sensor using themirror image method.References:1. Smith, C. A. & Corripio, A. B. (1997). Principles and practice of automaticprocess control, John Wiley & Sons, New York.2. Morris, A. S. (2001). Measurement and Instrumentation Principles.Butterworth- Heinemann, Oxford.3. Shahian, B. and Hassul, M., Control System Design. Prentice Hall, 1993.4. Considine, D., M., Process Instruments and Control Handbook. McGrawHill, 1974.27
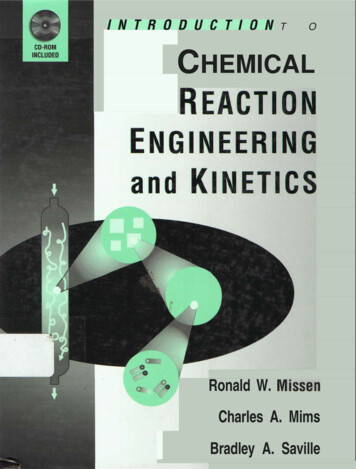
University of JordanFaculty of Engineering and TechnologyDepartment of Chemical EngineeringChemical Engineering Laboratory (4)Batch ReactorExperiment (3)Objectives1. To find the reaction rate constant for Saponification reaction in a batchreactor.2. To study the effect of varying process conditions on the reaction rate constant.ApparatusThe batch reactor vessel is a double skinned glass vessel with one liter and a half ofinternal working volume, the reactor is mounting on a computer controlled chemicalreactors service unit which also provides the ancillary services for the reactor. Thereactor is equipped with an agitator driven by an electric motor and controlled usingthe Armfield software. The speed can be varied using the up/down arrows or bytyping in a value between 0-100%-see figures (1) & (2). A clear, acrylic, selfcontained hot water circulator is positioned on the unit at the front right hand side-seefigure (3)-this vessel incorporates an element for heating water, a thermostat and leveldetector are incorporated in the vessel to prevent the heater from operating if thewater is too hot or the level in the vessel is too low. A thermocouple sensor T2 issupplied with this unit to measure the fluid temperature in the vessel. Flexible tubesare used to connect the circulator to the reactor. Water, heated by an electrical heatingelement in the circulator, is circulated by a gear pump located at the back of the plinthbehind the vessel. Temperature control is achieved by circulation of heated waterthrough the jacket of the batch reactor. T1 is designed to be used individually withreactors in conjunction with the PID controller in the software and T2 is to be usedwith hot water circulator vessel. A conductivity probe is supplied to be used with thereactor, the conductivity is displayed on the software in units of millisimens/cm.During the chemical reaction, the conductivity of the reacting solution changes asmore of the reactants are converted. This data can be logged and used to determine thedegree of conversion and the rate of reaction.28
29
TheoryThe Armfield batch reactor is designed to demonstrate the mechanism of a chemicalreaction in a reactor, as well as the effects of varying process conditions such asreaction temperature and reagents concentrations. In this experiment, theSaponification of Ethyl acetate by Sodium hydroxide is the reaction chosen to studythese conditions.NaOH CH3COOC2H5 CH3COONa C2H5OHFor this second order elementary reaction the rate equation is:-rA k.CA.CB(1)Where,rA rate of reaction (mol.L-1.S-1)K reaction rate constant (S-1)CA concentration of NaOH (mol.L-1)CB concentration of Ethyl acetate (mol.L-1)If the initial concentrations of reactants are equal, then:-dCA/dt k.CA2(2)Integration of this rate law for a single reactant gives;1/CA k.t 1/CAo(3)t time (s)CAo initial concentration of NaOH (mol.L-1)Hence, a plot of 1/CA against t gives a straight line of gradient k and an intercept of1/CAoIf the initial concentrations of reactants are not equals, then the rate equation aboveshould be combined with the following equations:𝜃 C
Chemical Engineering Laboratory (4) Manual Sheet November/2016 Version 5 . 2 . Objective To determine the kinetics and reaction rate constant of the essentially irreversible reaction between ethyl acetate and sodium hydroxide by the capacity flow method and . 2 liters of 0.03 M solution