Transcription
DataViz: improving data visualisation for thepublic sectorwww.communities.gov.ukcommunity, opportunity, prosperity
DataViz: improving data visualisation for thepublic sectorSeptember 2009Tom Smith, Stefan Noble, David Avenell and Graham Lally,Oxford Consultants for Social Inclusion (OCSI) LtdDepartment for Communities and Local Government
The findings and recommendations in this report are those of the authors and donot necessarily represent the views of the Department for Communities and LocalGovernment.Department for Communities and Local GovernmentEland HouseBressenden PlaceLondonSW1E 5DUTelephone: 020 7944 4400Website: www.communities.gov.uk Queen’s Printer and Controller of Her Majesty’s Stationery Office, 2009Copyright in the typographical arrangement rests with the Crown.This publication, excluding logos, may be reproduced free of charge in any format or medium for research,private study or for internal circulation within an organisation. This is subject to it being reproduced accuratelyand not used in a misleading context. The material must be acknowledged as Crown copyright and the title ofthe publication specified.Any other use of the contents of this publication would require a copyright licence. Please apply for a Click-UseLicence for core material at , or by writing to the Office ofPublic Sector Information, Information Policy Team, Kew, Richmond, Surrey TW9 4DUe-mail: licensing@opsi.gov.ukIf you require this publication in an alternative format please email es and Local Government PublicationsTel: 0300 123 1124Fax: 0300 123 1125Email: product@communities.gsi.gov.ukOnline via the Communities and Local Government website: www.communities.gov.ukSeptember 2009Product Code: 09RPD06059ISBN 978-1-4098-1766-6
DataViz: improving data visualisation for the public sector ContentsSection 1Section 2Section 3Introduction41.1 Introduction41.2 How we have carried out this project51.3 Acknowledgements6Stage 1: What visualisations are being used, both by public sector,and elsewhere?72.1 Discussion72.2 Outputs7Stage 2: Is there a useful typology of visualisation solutions(for public sector users)?113.1 Discussion113.2 Outputs15Stage 3: How effective are particular visualisation solutions insupporting public sector research and decision-making?164.1 Overview164.2 Practical steps to good data visualisation164.3 Outputs17Stage 4: What are the most appropriate visualisation options forparticular purposes?185.1 Discussion185.2 Outputs20Appendix A Call for evidence21Appendix B Topic guide for interviews23Appendix C Acknowledgements25Section 4Section 5
DataViz: improving data visualisation for the public sectorSection 1Introduction1.1 IntroductionBackground1.1.1Effective visualisation of data can help users explore and understand data,and also communicate that understanding to others: Exploring and analysing: Data visualisation can be of great use in theanalysis process, enabling researchers to explore datasets to identifypatterns, associations, trends and so on. Good visualisation should be seenas a central tool in carrying out analysis Presenting and communicating: Good data visualisations should helpothers make robust decisions based on the data being presented: Theyshould provide an effective representation of the underlying data, to helpanswer a particular question at hand. Communicating data in this waymight: support senior decision-makers engaged in strategic planning,or operations managers needing to understand where services could beimproved, or managers wanting to monitor performanceProject scope1.1.2Communities and Local Government (CLG) commissioned this project tobetter understand the potential for visualisation solutions to analyse andcommunicate intelligence, and provide guidance for national and localanalysts on making best use of visualisation.1.1.3In particular, CLG were looking to: assess and appraise the current range of visualisation solutions provide advice on the decision making process for selecting visualisationsat different levels of the government delivery chain.1.1.4In this project, we have addressed four central questions in order to provideadvice in using visualisation effectively in both exploring/analysing, andpresenting/communicating data:1. What visualisations are being used, both by public sector, and elsewhere?2. Is there a useful typology of visualisation solutions (for public sectorusers)?
DataViz: improving data visualisation for the public sector 3. How effective are particular visualisation solutions in supporting publicsector research and decision-making?4. What are the most appropriate visualisation options for particularpurposes?Key audiences1.1.5The primary audience for the project is local, regional and nationalinformation and research teams. The website and outputs are also intendedto be useful to all researchers engaged in visualising and presenting data– but may not provide examples of more technical visualisations used inspecific areas.Project outputs1.1.6The primary project output is the data visualisation website DataViz –www.improving-visualisation.org. This report acts as project record, andusers should view the website for the project outputs. The website contains: examples of visualisations with associated descriptive ‘metadata’, as wellas assessment of benefits and pitfalls to avoid for each visualisation case studies of visualisations supporting public sector research anddecision-making a typology of visualisations, based on policy/research questions ofrelevance to public sector users menu-driven filters, to enable users to identify appropriate visualisationsfor particular purposes (based on the typology policy/research questions) links to visualisation resources on the web; and functionality for users to add their evaluations of each visualisation.1.2 How we have carried out this project1.2.1Our project work has been based on: Call for evidence: Contact with wide range of stakeholders to identifygood (and bad) examples of visualisation, through emails to user-groups,and forum and blog postings. See Appendix A for the call to evidence text. In-depth consultations: Face-to-face and telephone interviews, with asmaller number of selected local, regional and national stakeholders, aswell as commercial partners. These covered issues such as extent to whichvisualisation is used in analysis, and policy/decision-making. See AppendixB for the topic guide. Visualisation literature research. Development of the project website DataViz and database. Seewww.improving-visualisation.org
DataViz: improving data visualisation for the public sector1.3 Acknowledgements1.3.1We would like to thank the CLG team and project Steering Group for theirhelp with the project: James Geehan (CLG), Robert Rutherfoord (CLG),Alistair Edwardes (CLG), Alan Smith (ONS), Professor Mike Batty (UCL CASA)1.3.2A full list of acknowledgements is provided in Appendix C.
DataViz: improving data visualisation for the public sector Section 2Stage 1: What visualisations arebeing used, both by public sector,and elsewhere?2.1 Discussion2.1.1Our starting point has been to identify what visualisations are being used bythe public sector and elsewhere. It is clearly not possible to identify each andevery example in existence, so we have focused on identifying examples of awide range of visualisation types.2.1.2Based on the brief, the project has identified visualisations appropriatefor small area data, e.g. Output Area and Super Output Area, as well ashigher scales of geography. In addition, we have looked at visualisationsthat help understand and communicate trends and dynamics over time, andbenchmarking comparisons between areas/groups and services – both ofthese issues are critical to local areas wanting to improve service delivery andmeet LAA targets.2.1.3We have also identified examples of “exploratory visualisation”; that is, whenanalysts are asked to mine a data-set to uncover unknown patterns or trends.The research question or decision-making process maybe unknown, and onlythrough engagement and experimentation with different visualisations canthese be uncovered.2.2 Outputs2.2.1The main outputs were: the project website, with a wide range of visualisation examples (currently170) provided as separate resources. Each provides metadata, includingwhat the visualisation shows, common pitfalls to avoid short case study summarising the types of data visualisation reported inthree key local strategies and plans – for example, Sustainable CommunityStrategies, Local Area Agreements and Joint Strategic Needs Assessments(this is live on the website).2.2.2The next pages show screenshots from the website, showing the gallery of allvisualisations.
DataViz: improving data visualisation for the public sector
DataViz: improving data visualisation for the public sector
10 DataViz: improving data visualisation for the public sector
DataViz: improving data visualisation for the public sector 11Section 3Stage 2: Is there a usefultypology of visualisation solutions(for public sector users)?3.1 Discussion3.1.1In order to provide advice to users on the most appropriate visualisation touse (Stage 4), we need to understand the types of visualisation solution usedfor different purposes. We have developed a basic typology of visualisationsolutions relevant to public sector users.3.1.2Based on our initial proposal and discussions with the steering group, wehave identified that the most appropriate typology is one based on: the purposes that visualisation is being used to help understand; and the audience for the visualisation .3.1.3In addition, we have ‘tagged’ each of the examples on the website withvisualisation type (eg bar-chart, map etc) and have used this to provide anadditional way for users to select and find examples based on visual types.Themes and questions for the visualisation typology3.1.4We have organised the example visualisations under four themes relevantto the key audience of local, regional and national information and researchteams (see figure below): Understanding needs “What do we need to do?”: For public services,“understanding needs” requires addressing a set of questions around toget a clear understanding of what communities/users/citizens are like. Improving service delivery “How do we do it?”: Improving service deliveryis fundamentally about understanding users, and how services can bebetter tailored and targeted to their needs. Performance and reporting “How did we do?”: Covering questions suchas whether targets are being met, how performance compares withothers, whether there has been improvement in outcomes and whetherthere has been user satisfaction with performance. Our classification based on role/purpose is also used by Stephen Few (2006) in Information Dashboard Design: The effectivevisual communication of data, O’Reilly.
12 DataViz: improving data visualisation for the public sector Data exploration: Exploring your data with no specific research questionin mind; looking at patterns in the data, relationship between datasets,whether findings are statistically significant etc.Typology of visualisation, based on four themes relevant to the key audience of local, regional andnational information and research teamsFor example What do our communities look like?How do we compare with other areas? How are needs changing over time? Who is most at risk? What factors are associatedwith high levels of needUnderstanding needs “what do we needto do?”Performance andreporting “how did we do?”For example Are we meeting targets?What targets are we failing on? How does performance ofservices compare with similar areas? How are outcomes changingover time?Data exploration3.1.5For example Who are our service users?Who is most/least satisfiedwith services? How do costs of services comparewith similar areas? How doestake-up compare? What groups and areas have poortake-up of services?Improving servicedelivery “how do we do it?”For example How do we compare? What is changing over time? What is the distribution (of socio-economic indicators)?What are the components of an indicator? What is the relationship between differentsocio-economic factors? How significant are differences? How can I interactively explore a dataset?Under each of these themes, we have identified a series of policy andresearch areas. In turn, each of these areas is linked to different types ofvisualisation. The tables below identifies the policy research areas (andillustrative questions), and the visual types linked to these.
DataViz: improving data visualisation for the public sector 13Understanding needs – policy and research areasPolicy and researchareasExample (illustrative) questionsChart types (used to link toexamples)What are ourneighbourhoods like? What is the demographic composition of ourneighbourhoods? How do our neighbourhoods fare on a rangeof indicators? choropleth mapbar chartbox plotrange chartpiescarf chartpopulation pyramidtreemapHow do our communitiescompare? How do needs compare with (similar)benchmark areas? Which neighbourhoods/groups are faringworse than the average? Where are the priority areas? bar chartchoropleth mapunivariate chartsmooth statistical mapbubble mapdeviation bar graphspiderthematic tableHow are things changingover time? Are deprived areas/groups “narrowing thegap”? What are recent socio-economic trends? How many people are on benefits forshort periods? Are people cycling betweenbenefits and low pay? What are projected future trends? How areneeds likely to change in future? line chartarea chartspiderflow mapWho is coming in to (andmoving out from) ourarea? What are the levels of inward and outwardmigration like? What are the commuting patterns (in-flowand out-flow) from our area? flow mapcomparative chartWho is most at risk? Whatfactors are associated withhigh levels of need? Who is most at risk? What factors areassociated with high levels of need? What is the distribution of need? How do health inequalities vary by gender?By deprivation level? How do areas with specific socio-economicissues fare economically? What factors are associated with whatoutcomes? Which groups are appropriate forpreventative work? scatterplothistogrambox plot]clustered bar chartchoropleth mapproportional area chartcomparative chartquadrant plotAccess to services What groups and areas have poor access toservices? choropleth mapsmooth statistical mapbubble mapAre differencessignificant? Are we doing significantly worse/better thanbenchmark areas on key indicators of need? Are changes over time significant? confidence intervalsfunnelWhat are our citizenpriorities? qualitativebar charttraffic lightWhat are the key priorities for citizens?Which groups have particular views?
14 DataViz: improving data visualisation for the public sectorImproving service delivery – policy and research areasPolicy and researchareasExample (illustrative) questionsChart types (used to link toexamples)How do our servicescompare? How do costs of services compare with(similar) benchmark areas? How do levels of service demand and takeup compare with (similar) benchmark areas? Where are services most stretched (highestlevels of take-up)? bar chartchoropleth mapspiderUnderstanding customers(‘insight’) Who is most/least satisfied with services? What are the key priorities for citizens andusers in improving services? Which groups have particular views? What groups and areas have poor take-upof services? Preferred services and communicationchannels? tag cloudqualitativerelationship diagrambar chartproportional area chartUser access to services Where are services located? What groups and areas have difficultiesaccessing services? point location mapchoropleth mapsmooth statistical mapbubble mapWho are our service users Who are our service users? How do serviceusers compare with the overall population? Where do our service users come from? What is our travel to work area? Where are commuters coming from? bar chartproportional area chartflow mapPerformance and reporting – policy and research areasPolicy and researchareasExample (illustrative) questionsChart types (used to link toexamples)How are we performingon targets? Are we meeting targets? What targets are we failing on? What service areas are failing to meettargets? scorecardbar chartconfidence intervalstraffic lightrange bar chartHow do we compare? How does our partnership performanceservices compare with (similar) benchmarkareas? How does performance of services comparewith (similar) benchmark areas? Are we providing Value for Money? bar chartchoropleth maprange bar chartHow are outcomeschanging over time? What do performance trends look like? Are our programmes working? Are area andindividual outcomes improving? Are deprived areas/groups “narrowing thegap”? line charttraffic lightarea chartSatisfaction with services bar chartqualitativeHow satisfied are service users?Who is most/least satisfied with services?
DataViz: improving data visualisation for the public sector 15Data exploration – policy and research areasResearch questionsChart types (used to link to examples)How do we compare (with other areas)? bar chartchoropleth mapWhat is changing over time? animationsflow mapstime lineline chartWhat is the distribution (of socio-economicindicators)? histogramscatterplotbubble mapsmooth statistical mapchoropleth mapWhat are the components of an indicator (forexample, how does the workless total split betweenjobseekers, incapacity benefits, lone parents etc) proportional area chartWhat is the relationship between different socioeconomic factors? scatterplotquadrant plotclustered bar chartchoropleth mapcomparative chartHow significant are differences? confidence intervalsfunnelHow can I interactively explore a dataset? InteractiveHow can I visualise qualitative (text) data? qualitativeHow can I visualise categorical data (for example,neighbourhood area classifications or servicelocations) categorical (data-type tag)point location (data-type tag)3.2 Outputs3.2.1All examples on the website have been ‘tagged’ with relevant themes andquestions from the typology (note, each visualisation can lie under morethan one theme-question, and each question can contain more than oneexample).3.2.2Drop-down lists are provided to enable users to select all visualisationsbelonging under each theme-question.
16 DataViz: improving data visualisation for the public sectorSection 4Stage 3: How effective areparticular visualisation solutions insupporting public sector researchand decision-making?4.1 Overview4.1.1There is no objective, reliable, way of assessing the effectiveness ofvisualisations – for supporting public sector research and decision-making(or indeed any other use of visualisations). In addition, the role played byinformation, including visualisation, in decision-making is a particularly murkyarea .4.1.2We have approached assessing the visualisations in two ways: practical steps to good data visualisation, case study identifying series ofcommon pitfalls to avoid (with “before” and “after” visualisations) enabling users to evaluate each visualisation on the project website, basedon three dimensions (each on a 5-point scale). The ratings are displayed onthe website, along with facility for users to add their own ratings:– Impact for the specific audience– Accuracy of portraying the underlying data.4.2 Practical steps to good data visualisation4.2.1 Based on our review of the visualisation literature, we have identified a seriesof practical steps for accurately showing the data. We have structured thesearound three areas – audience, form (i.e. size and shape), and colour:E.g. see Vale & Bovaird (2008). Making better use of information to drive improvement in local public services.
DataViz: improving data visualisation for the public sector 17Audience Think about how to present data to decision makers – an example from Leicestershire Help the audience by being selective in what you show – limit the number ofcategories in a visualisationForm (i.e. size andshape)Colour Don't use visualisation effects such as 3D that can hide the data Do not vary the size of objects in graphs, except to convey difference in values Don't miss zero off the axis scale For bar charts, set the base of the bars to zero (not the lowest value) Consider using bar charts, not pie charts, to present composition data Avoid using line charts where data is only available for a small number of timepoints When choosing colours to use, understand the principles of colour design When using colours in visualisations, ensure that colours are sufficiently contrastingto distinguish between data values Where colour is needed, use solid blocks of colour and avoid fill patterns Avoid using strong or bold colours for the background in a visualisation When creating choropleth maps, choose colours to help users identify patterns andrelationships between areas4.2.2Under each of the practical steps above, we have produced “before” and“after” visualisations, identifying how the practical step can improve theeffectiveness of the visualisation.4.3 Outputs4.3.1Outputs include: assessment of each of the visualisation solutions based on benefits anddrawbacks (added to the project website resources) practical steps to good data visualisation, case study identifying series ofcommon pitfalls to avoid (with “before” and “after” visualisations) website facility added to enable users to rate visualisations on relevance,impact and accuracy (with resources displaying the user ratings).
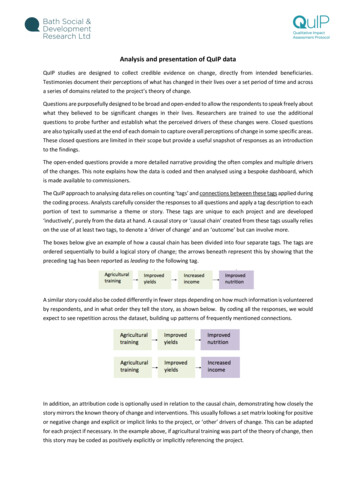
18 DataViz: improving data visualisation for the public sectorSection 5Stage 4: What are the mostappropriate visualisation optionsfor particular purposes?5.1 Discussion5.1.1The typology identified in Stage 2 above provides the framework for theprocess by which we identify appropriate visualisation options to users.Linking the typology to the questions asked by users has the benefit that ourtypology and classification of visualisation solutions is closely matched to ouranalysis of most appropriate visualisation solutions for a particular purpose.5.1.2Our guidance to users follows the typology set out in Stage 2 (see figurebelow):What are the most appropriate visualisation options for particular purposes?What is an appropriate visualisation technique to use?What issue am Itrying tounderstand?Eg Understanding needsUnderstanding performanceUnderstanding causes and what worksHow do we prioritise between XYZ?How can I explore this dataset.Who is myaudience?Eg Senior managers/decision-makersTechnical analystsGeneral public/citizens.Visualisation examplesEach with benefitsdrawbacks and userratings
DataViz: improving data visualisation for the public sector 195.1.3Selecting the step-by-step link on the navigation menu
20 DataViz: improving data visualisation for the public sector5.2 Outputs5.2.1The outputs include: toolkit facility for users to select guidance on appropriate visualisationsolutions, live on the website guidance on the website to users on how to identify appropriatevisualisation solutions.
DataViz: improving data visualisation for the public sector 21Appendix ACall for evidenceA.1.1The call for evidence was sent out to email lists, forums, blogs including theCASA DigitalUrban blog . This was also presented at the January 2009 LocalInformation Systems event. Improving data visualisation for public sectordecision-makers and researchersCall for EvidenceA.1.2We are carrying out a review of data visualisation – how data is presentedand brought to life using charts, graphs, maps, timelines, animations etc– for public sector decision-makers and researchers. The work will identifygood practice in visualising data, particularly for: analysing and presenting small area data (eg, below District level) understanding and communicating trends and dynamics over time benchmarking comparisons (between areas, groups and services).A.1.3We are looking for good examples of visualisation that have: made an impact/helped communicate findings to decision-makers helped researchers understand the story behind the data.A.1.4The project/website will be an excellent opportunity to show case your ownexamples of good visualisation, and help contribute to common standardsof good practice in the research community. If you have any examples, wewould love to hear from you! (contact details below)BackgroundA.1.5The project has been commissioned by Communities and Local Government,who are looking to understand the potential for visualisations to analyse andcommunicate data, and provide guidance for national and local analysts onmaking best use of visualisation.A.1.6Work on the project will explore questions including: What visualisations are being used by the public sector? What can welearn from elsewhere? http://digitalurban.blogspot.com/
22 DataViz: improving data visualisation for the public sector Is there a useful typology (classification) of visualisation techniques forpublic sector users? How effective are particular types of visualisation in supporting publicsector research and decision-making? What are the most appropriate visualisation techniques for particularpurposes?A.1.7The primary output from the project will be a web application, to help usersidentify strengths and weaknesses of visualisations for particular purposes,also linking to examples and supporting material.Further informationSee www.ocsi.co.uk/visualisation for project details, or contact the projectleads below.James Geehan, (Project manager)Communities and Local Governmenttel: 0207 944 4857James.Geehan@communities.gsi.gov.ukTom Smith(Project lead)OCSItel: 01273 201345tom.smith@ocsi.co.uk
DataViz: improving data visualisation for the public sector 23Appendix BTopic guide for interviewsB.1.1This topic guide was sent to all interviewees in advance. Improving data visualisation for public sectordecision-makers and researchers: Topic guide forconsultationsAbout the projectB.1.2We are carrying out a review of data visualisation – how data is presentedand brought to life using charts, graphs, maps, timelines, animations etc– for public sector decision-makers and researchers.B.1.3The work will identify good practice and examples in visualising data,particularly for: analysing and presenting small area data (eg, below District level) understanding and communicating trends and dynamics over time benchmarking comparisons (between areas, groups and services).About this guideB.1.4This topic guide covers the areas we would like to discuss. It is NOT aquestionnaire – we will explore these questions in our discussion. e are looking for (short) case studies of visualising information, thatWhave:1. made an impact/helped communicate findings to decision-makers2. helped researchers understand the story behind the dataFor each example Background – what is the issue/how is visualisation intended to help How used: Where in the decision-making process the visualisation wasused? What audiences? And how used to help? Impact: summary of the key ways that the visualisation helped (eg indecision-making etc) Benefits of the particular visualisation(s) used – and any weaknesses withprevious visualisations?
24 DataViz: improving data visualisation for the public sector Details – what was setup? By who? Costs? Technical implementationdetails? Further contactThank you for your help
DataViz: improving data visualisation for the public sector 25Appendix CAcknowledgementsNameOrganisationRoleAlan SmithOffice for National StatisticsData Visualisation UnitAlistair EdwardesCommunities and Local Government(CLG)Lead Spatial AnalystAndrew De’AthNorth East Improvement & EfficiencyPartnershipProgramme ManagerAndrewHudson-SmithCentre for Advanced Spatial Analysis(CASA), University College LondonSenior Research FellowAndy HoskinsCity Vision Networks LtdDirectorChristopher PettitDepartment of Primary Industries,AustraliaResearch Manager – Spatial InformationDan JellinekHeadstarEditor e-Government BulletinDave TufferyBristol City CouncilSustainable City GroupDavid BurdenDaden LtdDirectorDavid RussellFluent Technology LtdDirectorDerrick JohnstoneEduce LtdDirectorEmma CunliffeSouth Tyneside CouncilInformation Support OfficerEmma WilliamsLinden Labs (Second Life)UK Operations Manager, Second LifeJames GeehanCommunities and Local Government(CLG)Senior StatisticianJames LawrenceCoventry City CouncilCorporate Research, Information andConsultationJohn DawsonmarketingQEDDirectorJohn FisherLocal FuturesDirectorJohn MaslenGeowiseLocal Government DirectorJuliet WhitworthLocal Government AssociationHead of Commissioning and ResearchKen FeasterNational Institute on Money in StatePoliticsSystems DesignerKim ReesPeriscopic LtdPartnerLaura EdwardsLocal FuturesLocal Knowledge ManagerLincoln SmithioLabs IncDirector
26 DataViz: improving data visualisation for the public sectorNameOrganisationRoleMichael BattyCentre for Advanced Spatial Analysis(CASA), University College LondonDirectorMike FranksOldham CouncilResearch Analyst (GIS)Neil McSweeneyHalton Borough CouncilPrincipal Research OfficerPaul GuthersonCfBT Education TrustConsultantPaul WilsonScott Wilson LtdDigital Media ManagerRob WilsonNewcastle University Business School(NUBS)Deputy Director of KITE Research CentreRobert RadburnLeicestershire County CouncilSenior Research OfficerRobert RutherfoordCommunities and Local Government(CLG)Head of Neighbourhood IntelligenceSeth FineganInformed SolutionsLocal Government DirectorSimon RogersThe GuardianNews editor, graphics; Editor, GuardianDatablog
1 Our classification based on role/purpose is also used by Stephen Few (2006) in Information Dashboard Design: The effective visual communication of data, O’Reilly. 12 DataViz: improving data visualisation for the public sector Data exploratio