Transcription
OUTCOMES MEASUREMENTFOR DUMMIES ANDSMARTIESTraining in Critical Outcomes ReportAnalysis
Agenda: Outcomes Measurement forDummies and Smarties 8:00 AM– How to do Critical Outcomes Report Analysis (CORA) Basic Factoids and the 7 Rules of Plausibility 9:15 AM– Split into teams and do samples****************************** 9:45 AM– Break 10:00 AM– Option 1: Take CORA test for certification now (in your room or elsewhere)– Option 2: Take CORA test later or another day (recommended not to wait toolong)– Option 3: I will do a sample CORA deconstruction of wellness. You can takethe CORA test later on your own. (Note: this requires sign-up)1
Who Am I? Why Am I Here? Inventor of Disease Management (not really) Founder and first president of Care ContinuumAlliance (DMAA) Provide the field’s only analytic credential(Critical Outcomes Report Analysis) Called “best in the country” at outcomes reportanalysis by 9th Annual Report on the DM andWellness Industries Author of 3 books on DM/wellness, includingWhy Nobody Believes the Numbers2
3
Preliminary #1To paraphrase the immortal words of the greatphilosopher Frank Morgan4
Pay no attention to that man behind the podium(regardless of qualifications)5
“Who are you gonna believe, me or yourown eyes?”Raise your hand if I make a mistake and you get a freebasic membership in DMPC ( 2000 “value”)6
Preliminary #2: Warm-Up Trivia#1 New York Times BestsellerBecause this is a quantitativeSession, let’s look at some ofthe more quantitative facts8
p. 99: “Dunkin Donuts serves112,500 donuts a day”8
p. 103: “Americans consume 10million tons of turkey onThanksgiving Day.”9
p. 111: “The original [1967]Australian fifty-cent piece had 100 of silver in it.”10
Preliminary #3Any Questions? Back to the agenda. If there aren’t anyquestions or comments, we’ll get on withOutcomes Measurement for Dummies andSmarties In the immortal words of the great philosopherIrving Berlin11
Let’s Go On with the Show Back to the agenda. If there aren’t anyquestions we’ll get on with OutcomesMeasurement for Dummies and Smarties12
Here’s Why: All these “facts” are deadwrong Each is off by almost TWO orders of magnitudeAnd yet no reader, no reviewer, no editor noticed and thebook has been in print for 5 years. Everyone assumed thatif experts said it, it had to be right.13
Watch what happens when youCRITICALLY ANALYZEstats that you readp. 99: “Dunkin Donuts serves112,500 donuts a day”14
Watch what happens when youCRITICALLY ANALYZEstats that you readp. 99: “Dunkin Donuts serves112,500 donuts a day”Did you think: “Wait, there must bethousands of Dunkin Donuts stores –that’s only a fewdozen donuts a day/store” ?15
p. 103: “Americans consume 10million tons of turkey onThanksgiving Day.”
p. 103: “Americans consume 10million tons of turkey onThanksgiving Day.”Did you think:“Wait, that’s 20-billion pounds,almost 100 pounds per person” ?17
p. 111: “the original [1967]Australian fifty-cent piece had 100 of silver in it.”Did you think:“Wait, a country would go bankrupt ifit did that”18
What did we just prove in a real-timeexperiment? Most people won’t challenge something that anexpert tells them in a credible setting (example:it’s in a bestselling book) Don’t believe a self-anointed “expert.” Believeyour own eyes.Critical Outcomes Report Analysis is about doingexactly that19
The same thing happens in outcomesmeasurement The following example is from LincolnIndustries, considered the best wellnessprogram in the US as measured by the numberof awards bestowed upon it20
Lincoln Industries –Description and Awards Based in Lincoln NE 500 employees Nation’s leading supplier of products requiring highperformance metal finishing
Lincoln Industries –Description and Awards Based in Lincoln NE 500 employees Nation’s leading supplier of products requiring highperformance metal finishing HR magazine award four years in a row:
Lincoln Industries –Description and Awards Based in Lincoln NE 500 employees Nation’s leading supplier of products requiring highperformance metal finishing HR magazine four years in a row: “Top 25 MediumCompanies to Work for in America”
Lincoln Industries –Description and Awards Based in Lincoln NE 500 employees Nation’s leading supplier of products requiring highperformance metal finishing HR magazine “Top 25 Medium Companies to Work for inAmerica” four years in a row National recognition for wellness: C. Everett Koop National Health Award -2008 US Department of Health and Human Services: “Innovation in Prevention” Award -2007 Great Place to Work Institutes: “Respect” Award for Wellness Focus -2007 American Heart Association: Platinum Award for “Start! Fit-Friendly Workplace” -2007 Partners for Prevention: “Leading by Example” Company -2007 Center for Disease Control: Worksite Wellness “SWAT” Project 2005-2007 Wellness Councils of America (WELCOA): Two Time Platinum Award Winner –2003, 2006
Lincoln Industries – ROI & Health CareCost Trends Cut-and-Pasted fromTheir Website Koop award documentation–100% of employees participate in the program–5.30:1 ROI including health care and productivityrelated savings–9.7% reduction in health care costs from 2006 to 2007 Favorable health care cost trend –Lincolncorporate website:
“[We Achieved a] 9.7% Reduction in Cost from2006 to 2007”-9.7%26
Oh, by the way, they forgot to mention 27
Lincoln Industries – Recent HealthCare Cost Trends
Lincoln Industries – Recent HealthCare Cost Trends
Actual Cost/Covered PersonLincoln vs. BenchmarkSource: Commonwealth Fund30
This Lincoln Mistake IllustratesThe Importance of a Knowledge Base Basic CORA knowledge base– Factoids– The 7 Rules of Plausibility31
Basic CORA factoids:Some health economics trivia questions (all 65) Annual spending per person? (average and bythe top 5 conditions) Cost per day in hospital? Cost per ER visit? Heart attack rates Asthma attack rates MD visit rates Admit rates per 1000
Some factoids (all 65) – real ones this time(rough guesses) Annual spending per person? (average and by thetop 5 conditions)– About 5000; for top five conditions: Asthma 4000, CAD 8000, CHF 20,000 COPD 14,000,diabetes 10,000 Cost per day/stay in hospital? About 3000/ 12,000Cost per ER visit? 600 to 1200Heart attack rates 1 in 1000 claim-generating onesAsthma attack rates 3-4 in 1000 people IP/ERMD visit rates /- 3/year to PCPs; 5-6/year overallto providers Admit rates per 1000 60-70
This Lincoln Mistake IllustratesThe Importance of a Knowledge Base Basic CORA knowledge base– Factoids– The 7 Rules of Plausibility34
The Seven Rules of Plausibility1.2.3.4.5.6.7.The 100% Rule – You can’t reduce a number by more than 100%The Every Metric Can’t Improve Rule – people have to get theircare from somewhereThe 25% Savings Rule – Nothing declines by a quarter or morein a voluntary non-incentivized programThe Nexus Rule—reduction has to be related to interventionThe Quality Dose--Cost Response Rule—costs can’t fall fasteror more than quality indicators improveThe Control Group Equivalency Rule—”trend” and “matchedcontrols” and “pre-post historic” don’t cut itThe Multiple Violations Rule—if one rule is violated, so areothers35
The Seven Rules of Plausibility1.The 100% Rule – You can’t reduce a number by more than 100%no matter how hard you try36
The Seven Rules of Plausibility1.The 100% Rule – You can’t reduce a number by more than 100%no matter how hard you try37
Nice work if you can get it
I Can Get It For You Wholesale39
PCMH Effectiveness: The Proof Is InHI-WIREGeorge MillerJanuary 04, 2010A five-year prospective evaluation of the modelyields a 129% increase in patients receivingoptimal diabetes care and a 48% increase forheart-disease patients. The model also achieved a350% reduction in appointment waiting time, asreported by the Institute for HealthcareImprovement.40
The Seven Rules of Plausibility1.2.The 100% Rule – a number can’t decline 100%The Every Metric Can’t Improve Rule – people have to get theircare from somewhere– Insulating your house saves money on heat, but noton insulationExample from the “poster child” of medical homes, NC41
42
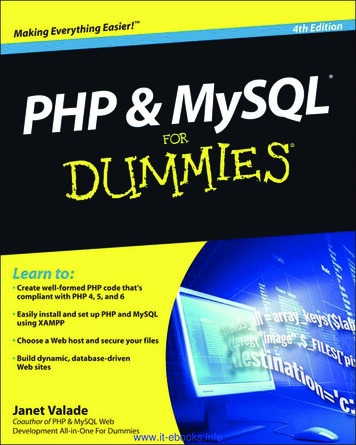
(Cut-and-pasted from the Mercer report)Attachment 5SFY06 SavingsUsing Statewide Benchmark(by Category of Service)PREDICTED ACTUAL43
Predicted vs. Actual PMPM Results for North Carolina(blown up from previous page)Where is the “insulation” expense?44
No, the state’s residents didn’t just get healthierRates of obesity and diabetesrose faster than national averages45
The Seven Rules of Plausibility1.2.3.The 100% Rule – a number can’t decline 100%The Every Metric Can’t Improve Rule – people have to get theircare from somewhereThe 25% Savings Rule – Nothing declines by a quarter or morein a voluntary non-incentivized program– When it looks like that has happened, there is alwaysanother explanation (example: Lincoln)– It is usually due to making a classic mistake in prepost analysis, which is invalid, period46
Figure 8: Changes in Care Gaps for Engaged Members withthe Condition in the Baseline: 37% of Open Gaps ClosedWhile Only 16% of Closed Gaps OpenedOpen GapClosed GapStayed ClosedClosed to OpenStayed OpenOpen to Closed15581864Closed306Open820518302BaselineClosed to Open (16%)Open to Closed (37%)Year One47
Figure 8: Changes in Care Gaps for Engaged Members withthe Condition in the Baseline: 37% of Open Gaps ClosedWhile Only 16% of Closed Gaps OpenedOpen GapClosed GapStayed ClosedClosed to OpenStayed OpenOpen to Closed15581864Closed306Open820518302BaselineClosed to Open (16%)Open to Closed (37%)Year One48
Highlights of Pharos Findings (according totheir website) 79% reduction in admissions 85% reduction in total cost49
Pharos Results not just validated 50
Pharos Results not just validated According to their website, their results are“strongly validated”51
Pharos Results not just validated According to their website, their results are“strongly validated”Regular validation is for sissies52
Alleged Pharos “Results”53
Alleged Pharos “Results”54
**Where “unchanged” isdefined as “declining 25%"55
Highlights of Pharos Findings (according totheir website) 79% reduction in admissions 85% reduction in total cost56
Highlights of Pharos Findings (according totheir website) 79% reduction in admissions 85% reduction in total costWhere is the ‘insulation expense” ?i57
In case anyone still has any doubt aboutPharos results“There were no significant differencesbetween the two groups with respect to thesecondary end points or the time to theprimary end point or its components.”58
The Seven Rules of Plausibility1.2.3.The 100% Rule – a number can’t decline 100%The Every Metric Can’t Improve Rule – people have to get theircare from somewhereThe 25% Savings Rule – Nothing declines by a quarter or morein a voluntary non-incentivized program– When it looks like that has happened, there is alwaysanother explanation– It is usually due to making a classic mistake in prepost analysis, which is invalid, period Examples from disease management and wellness59
The “pre” population in pre-post All Identifiablemembers with thedisease in question (or high risk, ifwellness)60
The whole “pre” population? Really? Could there bepeople with the disease you can’t identify Who might have a condition though they arenot identifiable?– Let’s call these people “tails”– “Tails” have lower cost since they don’t have enoughclaims to be identifiedHow might someone with a condition not be identifiableto the health plan or vendor?61
Why might outcomes measurement not recognize that amember has a condition (“Tails”)?1.2.3.Member is new employeeMember is too mild to have disease-identifiable claimsMember has disease-identifiable claims, but not enough to trigger thealgorithm (for instance, you need two 250.xx MD visits to be classified asdiabetic)4. Member is non-compliant and doesn’t fill scripts5. Member is misdiagnosed6. Member is correctly diagnosed but the physician doesn’t want to entercorrect diagnosis in their file7. Member does not himself or herself know he/she has the condition.8. Maybe they got diagnosed too recently for the claim to have shown up9. Get their drugs from WalMart so don’t generate a claim10. Belong to a culture where acknowledging a diagnosis is discouragedClearly there are a lot of tails and they generate lower claims62
Clearly there are tails as well as heads Identifiable (highercost) membersNon-identifiable membersWith condition (lower-cost)63
Clearly there are tails as well as heads Identifiable (highercost) membersNon-identifiable membersWith condition (lower-cost)64
If you flip the heads, some will flip tolower-cost “tails” on their own Identifiable members Example: Peoplewho had heart attacksin baseline (“heads”),but not this year(“Tails”)65
The effect of Tails on measuring savings vs.predicted results Heads flipping to tails count as savings But no one flips the Tails and offset the savings fromHeads-turning-Tails with the Tails-turning-HeadsExample: Tim Russert (not a “heads” inthe baseline but hada heart attack anyway –would not have beencounted against savings)66
Tim Russert Not in “Pre” Population – had no previousCAD claims and his only health issue was having theworld’s third-widest head#367
Tim Russert Not in “Pre” Population – had no previousclaims and his only health issue was having the world’sthird-widest head#3#268
Tim Russert Not in “Pre” Population – had no previousclaims and his only health issue was having the world’sthird-widest head#3#2#169
Watch what happens when you also flip thetails as well as the heads Identifiable (highercost) membersNon-identifiable membersWith condition (lower-cost)70
So you still have 4 heads and 4 tails in thestudy year but two of the heads were notcounted because they started out as tailsNot counted71
Example of Using Heads-to-Tails to CreateGuaranteed Savings: Wellness This vendor guarantees a 30% shift fromhigh/medium risk to low risk Note in the following slides that only the headsto-tails (risk reduction in high-risk people) iscounted, not the tails to heads (risk increase inlow-risk people)72
Cigna Guarantees that 30% of High and Medium Riskwill decline in risk:73
First question: Isn’t that just guaranteeing that 30% ofheads will flip to tails?74
Second question: What about these people flipping fromtails to heads? Shouldn’t they be counted too?75
Third question: Should Cigna have drawn the 670-personlow-risk segment larger than the 200 and 130?76
Example from Wellness using Cignamethodology: Smoking Cessation77
Smoking hypothetical Suppose everyone in your organization smokesand quits in alternate years, and that smoking isthe only risk factor So the 50% of the workforce smokes every yearbut it’s a different 50% each year78
Smoking hypothetical Suppose everyone in your organization smokes andquits in alternate years, and that smoking is the only riskfactor– Only smokers are high-risk So the 50% of the workforce smokes every year but it’sdifferent 50%This methodology would find a 100% reductionEvery year even though the smoking rate remains unchanged79
80
The Seven Rules of Plausibility1. The 100% Rule – a number can’t decline 100%2. The Every Metric Can’t Improve Rule – people haveto get their care from somewhere3. The 25% Savings Rule – Nothing declines by aquarter or more in a voluntary non-incentivizedprogram4. The Nexus Rule—reduction has to be related tointervention–You can’t just say “it happened so the program did it”81
PREDICTED ACTUAL82
Predicted vs. Actual PMPM Results for NorthCarolina (blown up from previous page)83
How you know this wasn’t caused by theNC Medical Home No Nexus: NC Medical Home focused oncommon chronic disease84
How you know this wasn’t caused by theNC Medical Home No Nexus I: NC Medical Home focused oncommon chronic disease No Nexus 2: Medicaid babies weren’t enrolled inthe medical home program85
Oh, by the way NC Medical Home focused on chronic disease Most Medicaid babies weren’t enrolled in themedical home program It turns out they made the whole thing upanyway – there wasn’t any reduction inutilization among babies (covered in the 10 AMshow)86
The Seven Rules of Plausibility1.2.3.4.5.The 100% Rule – a number can’t decline 100%The Every Metric Can’t Improve Rule – people have to get theircare from somewhereThe 25% Savings Rule – Nothing declines by a quarter or morein a voluntary non-incentivized programThe Nexus Rule—reduction has to be related to interventionThe Quality Dose--Cost Response Rule—costs can’t fall fasteror more than quality indicators improve87
Seinfeld meets Wellness: It’s About Nothing88
Seinfeld meets Wellness89
Average risk reduction:15% (includes all 8)
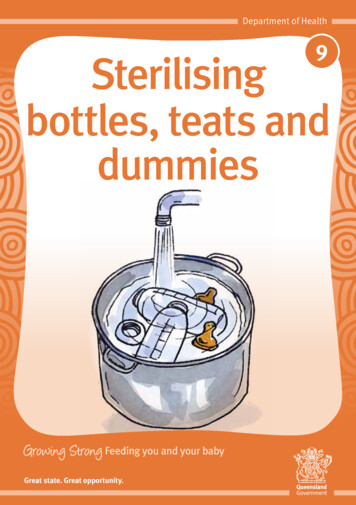
How Risk Reduction Drives Cost ReductionCategoryFactor (in %)Risk Reduction15% -- from previous slideRisk-Sensitive Hospital/ER EventsHospital/ER Events as a % of Total SpendTotal Savings(c) 2013 DMPC www.dismgmt.com91
How Risk Reduction Drives Cost ReductionCategoryFactor (in %)Risk Reduction15%Risk-Sensitive Hospital/ER Events20% of all Hospital Events*Hospital/ER Events as a % of Total SpendTotal Savings*Heart events and diabetes events combined account for about 7%.Let’s assume generously that another 13% just can’t be foundbut are happening(c) 2013 DMPC www.dismgmt.com92
How Risk Reduction Drives Cost ReductionCategoryFactor (in %)Risk Reduction15%Risk-Sensitive Hospital/ER Events20% of all Hospital Events*3%Hospital/ER Events as a % of Total SpendTotal SavingsA 15% reduction in 20% of hospital spending nets a 3%reduction in hospital spending(c) 2013 DMPC www.dismgmt.com93
How Risk Reduction Drives Cost ReductionCategoryFactor (in %)Risk Reduction15% achievedRisk-Sensitive Hospital/ER Events20% estimatedHospital/ER Events as a % of Total Spend50% calculated (approx.)3%Total SavingsIf you save 3% of hospital spending and hospital spending isHalf your total spending, your net savings is (c) 2013 DMPC www.dismgmt.com94
How Risk Reduction Drives Cost ReductionCategoryFactor (in %)A) Risk Reduction15% achievedB) Risk-Sensitive Hospital/ER Events20% estimatedC) Hospital/ER Events as a % of Total Spend50% calculatedTotal Savings (A x B x C)15% x 20% x 50%(c) 2013 DMPC www.dismgmt.com95
How Risk Reduction Drives Cost ReductionCategoryFactor (in %)Risk Reduction15% achievedRisk-Sensitive Hospital/ER Events20% estimatedHospital/ER Events as a % of Total Spend50% calculatedTotal Savings1.5%Simplified biostatistical “mediation analysis” translates15% risk reduction into 1.5% cost reduction -- unless you are (c) 2013 DMPC www.dismgmt.com96
24%
The Seven Rules of Plausibility1.2.3.4.5.6.The 100% Rule – a number can’t decline 100%The Every Metric Can’t Improve Rule – people have to get theircare from somewhereThe 25% Savings Rule – Nothing declines by a quarter or morein a voluntary non-incentivized programThe Nexus Rule—reduction has to be related to interventionThe Quality Dose--Cost Response Rule—costs can’t fall fasteror more than quality indicators improveThe Control Group Equivalency Rule—“matched controls” and“pre-post historic vs. non-disease trend” don’t cut it becauseparticipants will always outperform non-participants98
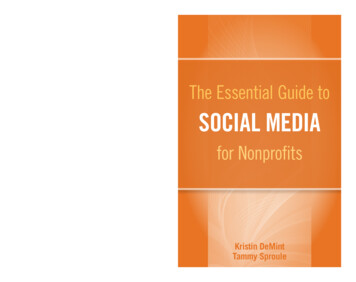
“The participating12010080"In"60member’s claims wentdown 20% over twoperiods vs. a controlgroup4020Period 2Period 1Baseline0BaselineClaims History (Baseline 100)Participation Bias(c) 2003 DMPC LLC. All rightsreserved, used by permissionwww.DisMgmt.com
140120100"In""Out"806040The participating group consists ofmotivated people only!The population has everybody20Period 2Period 1Baseline0BaselineClaims History (Baseline 100)Participation Bias(c) 2003 DMPC LLC. All rightsreserved, used by permissionwww.DisMgmt.com
Example: Paladina Health101
So Trend was 7-8% 50% enrolled and their costs declined 10% 50% didn’t enroll and their costs increased 28%102
So Trend was 7-8% 50% enrolled and their costs declined 10% 50% didn’t enroll and their costs increased 28% Average -10% and 28% 9% trend now103
“Matched controls” don’t control for participants’ motivation
Pre-post vs. the trend of non-disease control, the“official” CCA methodology, is pure fiction onboth levels1. Pre-post is pure fiction, provably false2. “Adjusted for Trend” is pure fiction, provablyfalse.Both are covered at length in my book but here isa short version105
Base Case: Example from AsthmaFirst asthmatic has a 1000 IP claim in201020102011(baseline)(contract)Asthmatic #11000(heads)Asthmatic #20(tails)Cost/asthmatic106
Example from AsthmaSecond asthmatic has an IP claim in 2011 while firstasthmatic goes on drugs (common post-event)Asthmatic #1(heads)Asthmatic ract)10001000What is theCost/asthmaticIn the baseline?107(c)2012
Cost/asthmatic in baseline?Asthmatic #12010(baseline)10002011(contract)100Asthmatic #201000Cost/asthmatic 1000108Vendors don’t count #2in 2010 bec. he can’t befound (“tails”)(c)2012
Cost/asthmatic in contract period?Asthmatic #12010(baseline)10002011(contract)100Asthmatic #201000 1000 550Cost/asthmatic109(c)2012
Base Case: The effect of flipping the headsAsthmatic #12010(baseline)10002011(contract)100Asthmatic #201000 1000 550Cost/asthmaticIn this case, using the official methodologyCost/asthmaticfalls 45%110
The giveaway that this invalidity is takingplaceAsthmatic #12010(baseline)10002011(contract)100Asthmatic #201000Number ofasthmatics inprevalence12111
Next, look at the non-disease population for a“trend’Asthmatic #1(diseasepopulation)Asthmatic #2 (nondisease populationfor trend)2010(baseline)10002011(contract)10001000112
Calculate the trend in the identified diseasepopulationAsthmatic #1 --2010(baseline)1000result2011(contract)100-90%113
90% reduction is great unless the non-disease population declines at agreater rate– Remember, the disease population trend has to beadjusted for what would have happened anyway inthe non-disease population, using the standard CCAmethodology– Person in this room has written an article on thisusing data Before you claim savings in the diseasepopulation, you need to adjust for the nondisease population
Calculate the trend in the identified non-diseasepopulationAsthmatic #1 –disease pop.Asthmatic #2—non-disease popNon-diseasetrend2010(baseline) 10002011(contract) 100 0 1000 115
Hunh? Not-yet-identified people with the condition don’tjust get left out of the disease population. Theyget added to the non-disease population, thusexacerbating the invalidity.116
The Seven Rules of Plausibility1.2.3.4.5.6.7.The 100% Rule – You can’t reduce a number by more than 100%The Every Metric Can’t Improve Rule – people have to get theircare from somewhereThe 25% Savings Rule – Nothing declines by a quarter or morein a voluntary non-incentivized programThe Nexus Rule—reduction has to be related to interventionThe Quality Dose--Cost Response Rule—costs can’t fall fasteror more than quality indicators improveThe Control Group Equivalency Rule—”trend” and “matchedcontrols” and “pre-post historic” don’t cut itThe Multiple Violations Rule—if one rule is violated, so areothers117
Multiple Violations: Check These Examplesagainst the Plausibility RulesRuleMercer/North Vendor ACarolinaPharosEastmanChemical100%Every Metriccan’t Improve25% declinesNexusQuality DoseCostResponseControl GroupEquivalency/Trend118
The Keys to the Kingdom There is no substitute for a careful reading andapplying common sense The “answer” is a combination of the factoids,the 7 Rules, common sense and observationalskills This is the tip of the iceberg: Much more in mybook119
4 ExamplesFind the flaws and (if self-study) write them downShare with group or (if self-study) email them toalewis@dismgmt.com120
Program Year One – Clinical Indicators1. What is wrong with this outcomes slide?Percentage of Continuously Enrolled MembersmprovementBasePost Year 1% of CHD Members with an LDLscreen75.0%77.0%2.0%% of CHD Members with at leastone claim for a Statin69.0%70.5%1.5%% of CHD Members receiving anACE inhibitor or alternative43.5%44.7%1.2%% of CHD Members post-MI withat least one claim for a betablocker0.890.890.0%Hospitalizations/1,000 CHDMembers for a primarydiagnosis of MyocardialInfarction*47.60*measure based on total membership, not just "continuously enrolled" membership24.38-48.8%
Does Castlight Save Money?122
Question 3 Comment on how good a job you think theseguys did and what mistakes they might havemade accidentally or on purpose123
Wellnet and Cumulus MediaKEY FACTSHeadquarters:Atlanta, GeorgiaStart Date:January, 2009Business:National Radio Station OperatorPopulation:1,454 ee’s/2,572 membersExecutive Endorsement:StrongMember Participation:79%Member Communication:OngoingIncentive:Premium ReductionMedical Plan Trend Reduction: 8% to .06%RETURN ON INVESTMENT:18:1INTEGRATED CARE MANAGEMENTHigh Risk Members:Medium Risk Members:55 members2% of population5.5 conditions per member 4mm in undetected claims cost453 members18% of population3 conditions per member 17mm in undetected claims cost
Savings by Category of Utilization per 1000 members permonth (2010 vs. 2009)(note: The difference between the bars is the savings) 2,500 2,000 1,50020092010 1,000 500 0IPEROPMDAdmits Visits Facility VisitsDrug(c) 2010 DMPC www.dismgmt.comOther
#4 – Disease/Case Management Program ResultsCategoryBaseInterventionTotal CommercialMembership605,000611,000Prevalence of selectedcase mgmt conditions24%24%Annual claims cost 952 915Annual admission rate9676Annual Admission cost 259 242Annual MD visit rate per1000 members43354275Annual MD visitcosts/member 139 135Annual ED visitrate/1000431369Annual EDcosts/member 39 33
FOR DUMMIES AND SMARTIES Training in Critical Outcomes Report Analysis. Agenda: Outcomes Measurement for Dummies and Smarties . Asthma 4000, CAD 8000, CHF 20,000 COPD 14,000, diabetes 10,000 Cost per day/stay in hospita