Transcription
Data BookA Report to the Communities
Hispanic CommunityHealth StudyStudy of LatinosData BookA Report to the CommunitiesNIH Publication No. 13-7951September 2013
Table of ContentsI. Preface . . . . . . . . . . . . . . . . . . . . . . . . . . . . . . . . . . . . . . . . . . . . . . . . 5II. Acknowledgments . . . . . . . . . . . . . . . . . . . . . . . . . . . . . . . . . . . . . . . . 6III. Introduction . . . . . . . . . . . . . . . . . . . . . . . . . . . . . . . . . . . . . . . . . . . 8Study Description . . . . . . . . . . . . . . . . . . . . . . . . . . . . . . . . . . . . . . . . . . . . . . . . . . . . 8How To Read This Data Book – A Guide . . . . . . . . . . . . . . . . . . . . . . . . . . . . . . . . . . . . . . 8Definition of Groups . . . . . . . . . . . . . . . . . . . . . . . . . . . . . . . . . . . . . . . . . . . . . . . . . . 9Description of Charts . . . . . . . . . . . . . . . . . . . . . . . . . . . . . . . . . . . . . . . . . . . . . . . . . 9IV. Field Center Descriptions . . . . . . . . . . . . . . . . . . . . . . . . . . . . . . . . . . 10Bronx Field Center . . . . . . . . . . . . . . . . . . . . . . . . . . . . . . . . . . . . . . . . . . . . . . . . . . 10Chicago Field Center . . . . . . . . . . . . . . . . . . . . . . . . . . . . . . . . . . . . . . . . . . . . . . . . . 11Miami Field Center . . . . . . . . . . . . . . . . . . . . . . . . . . . . . . . . . . . . . . . . . . . . . . . . . . 12San Diego Field Center . . . . . . . . . . . . . . . . . . . . . . . . . . . . . . . . . . . . . . . . . . . . . . . . 13V. Description of Participants . . . . . . . . . . . . . . . . . . . . . . . . . . . . . . . . . . .15Participants by Background . . . . . . . . . . . . . . . . . . . . . . . . . . . . . . . . . . . . . . . . . . . . . 15Participants by Age and Sex . . . . . . . . . . . . . . . . . . . . . . . . . . . . . . . . . . . . . . . . . . . . . 16Participants by Education and Income levels . . . . . . . . . . . . . . . . . . . . . . . . . . . . . . . . . . . 17Participants by Preferred Language Use . . . . . . . . . . . . . . . . . . . . . . . . . . . . . . . . . . . . . . 18Participants by Place of Birth and Time Living in the United States . . . . . . . . . . . . . . . . . . . . . 18VI. Disease Conditions . . . . . . . . . . . . . . . . . . . . . . . . . . . . . . . . . . . . . . . 20Coronary Heart Disease and Stroke . . . . . . . . . . . . . . . . . . . . . . . . . . . . . . . . . . . . . . . . 20Pulmonary Disease . . . . . . . . . . . . . . . . . . . . . . . . . . . . . . . . . . . . . . . . . . . . . . . . . . 22Oral Health . . . . . . . . . . . . . . . . . . . . . . . . . . . . . . . . . . . . . . . . . . . . . . . . . . . . . . 25Hearing Loss . . . . . . . . . . . . . . . . . . . . . . . . . . . . . . . . . . . . . . . . . . . . . . . . . . . . . 27
VII. Risk Factors for Cardiovascular Disease . . . . . . . . . . . . . . . . . . . . . . . . 28Hypertension . . . . . . . . . . . . . . . . . . . . . . . . . . . . . . . . . . . . . . . . . . . . . . . . . . . . . 28Cholesterol . . . . . . . . . . . . . . . . . . . . . . . . . . . . . . . . . . . . . . . . . . . . . . . . . . . . . . . 29Prediabetes and Diabetes . . . . . . . . . . . . . . . . . . . . . . . . . . . . . . . . . . . . . . . . . . . . . . . 31Obesity . . . . . . . . . . . . . . . . . . . . . . . . . . . . . . . . . . . . . . . . . . . . . . . . . . . . . . . . . 34Smoking . . . . . . . . . . . . . . . . . . . . . . . . . . . . . . . . . . . . . . . . . . . . . . . . . . . . . . . . 35Symptoms of Depression . . . . . . . . . . . . . . . . . . . . . . . . . . . . . . . . . . . . . . . . . . . . . . . 37Anxiety Symptoms . . . . . . . . . . . . . . . . . . . . . . . . . . . . . . . . . . . . . . . . . . . . . . . . . . 38Sleep Problems . . . . . . . . . . . . . . . . . . . . . . . . . . . . . . . . . . . . . . . . . . . . . . . . . . . . 39Multiple Risk Factors for Cardiovascular Disease . . . . . . . . . . . . . . . . . . . . . . . . . . . . . . . .41VIII. Lifestyle . . . . . . . . . . . . . . . . . . . . . . . . . . . . . . . . . . . . . . . . . . . . 42Diet . . . . . . . . . . . . . . . . . . . . . . . . . . . . . . . . . . . . . . . . . . . . . . . . . . . . . . . . . . . 42Physical Activity . . . . . . . . . . . . . . . . . . . . . . . . . . . . . . . . . . . . . . . . . . . . . . . . . . . 45IX. Awareness, Treatment, and Control . . . . . . . . . . . . . . . . . . . . . . . . . . . . 48Awareness, Treatment, and Control of Hypertension . . . . . . . . . . . . . . . . . . . . . . . . . . . . . 48Awareness, Treatment, and Control of Diabetes . . . . . . . . . . . . . . . . . . . . . . . . . . . . . . . . . 51X. Health Insurance . . . . . . . . . . . . . . . . . . . . . . . . . . . . . . . . . . . . . . . . 54Health Insurance Coverage . . . . . . . . . . . . . . . . . . . . . . . . . . . . . . . . . . . . . . . . . . . . . 54Types of Health Insurance . . . . . . . . . . . . . . . . . . . . . . . . . . . . . . . . . . . . . . . . . . . . . 54XI. Summary . . . . . . . . . . . . . . . . . . . . . . . . . . . . . . . . . . . . . . . . . . . . . 56XII. References . . . . . . . . . . . . . . . . . . . . . . . . . . . . . . . . . . . . . . . . . . . 57
4 hchs/sol data book: a report to the communities
I. PrefaceWe are pleased to present a summary of medical research results of the Hispanic Community Health Study/Study of Latinosto the communities and participants from the largest health study of Hispanic/Latino populations in the United States. Thisstudy seeks to understand the health issues affecting Hispanic/Latino groups in the United States and includes research onmany diseases and conditions of particular importance to the Hispanic/Latino communities.The participants in this study have understood the value of research on the causes of health conditions to improve thelives of Hispanics/Latinos in particular and all Americans in general. They have contributed many hours participating in aclinical evaluation, responding to many questions about their health status and engaging in other measures after they leftthe field center. The success of this study is due to their dedication and contribution of time and effort. The sponsoringorganizations at the National Institutes of Health, the universities and researchers involved in this study, and all who willbenefit from this research thank the participants for their commitment.This report provides data from the first examination of participants who attended the Hispanic Community Health Study/Study of Latinos. It highlights health areas that are having a positive impact in these communities and those that needgreater attention to improve lives. All who have made this study possible deserve the Nation’s thanks.Gary H. Gibbons, M.D.DirectorNational Heart, Lung, and Blood InstituteNational Institutes of Healthsection i: preface 5
II. AcknowledgmentsSpecial appreciation is extended to the participants who contributed their time and effort and to the extraordinary staffwho conducted the study. A list of staff can be seen at http://www.cscc.unc.edu/hchs/Investigators contributing to this report:Abreu, Maria de los Angeles, MPA, CCPRGiachello, Aida, PhDUniversity of North Carolina at Chapel HillNorthwestern UniversityArredondo, Elva, PhDGonzález, Sara, PhDSan Diego State UniversityAlbert Einstein College of MedicineAvilés–Santa, Larissa, MD, MPHHeiss, Gerardo, MD, PhDNational Heart, Lung, and Blood Institute, NIHUniversity of North Carolina at Chapel HillBarr, R. Graham, MD, DrPHIsasi, Carmen, MD, PhDColumbia UniversityAlbert Einstein College of MedicineBeck, James, PhDKaplan, Robert, PhDUniversity of North Carolina at Chapel HillAlbert Einstein College of MedicineBirnbaum–Weitzman, Orit, PhDRedline, Susan, MD, MPHUniversity of MiamiThe Brigham & Women's HospitalBuelna, Christina, MARodríguez, Bárbara, MS(c)San Diego State UniversitySan Diego State UniversityCai, Jianwen, PhDSanchez, Carlos, MDUniversity of North Carolina at Chapel HillUniversity of Illinois, ChicagoCastañeda, Sheila F., PhDSchneiderman, Neil, PhDSan Diego State UniversityUniversity of MiamiCruickshanks, Karen J., PhDSiega–Riz, Anna Maria, PhD, RD, LDNUniversity of WisconsinUniversity of North Carolina at Chapel HillDaviglus, Martha, L., MD, PhDSilsbee, Lorraine, MHSUniversity of Illinois, Chicago; Northwestern UniversityNational Heart, Lung, and Blood Institute, NIH6 hchs/sol data book: a report to the communities
Smoller, Sylvia, PhDTalavera, Gregory A., MD, MPHAlbert Einstein College of MedicineSan Diego State UniversitySorlie, Paul, PhDWilkins, Tania M., MSNational Heart, Lung, and Blood Institute, NIHUniversity of North Carolina at Chapel HillSotres, Daniela, DrPHYoungblood, Marston, MA, MPHUniversity of North Carolina at Chapel HillUniversity of North Carolina at Chapel HillTalavera, Ana, MPHSan Diego State Universityfunding acknowledgmentThe Hispanic Community Health Study/Study of Latinos (HCHS/SOL) is a collaborative study supported by contractsfrom the National Heart, Lung, and Blood Institute (NHLBI) to the University of North Carolina (N01–HC65233),University of Miami (N01–HC65234), Albert Einstein College of Medicine (N01–HC65235), Northwestern University(N01–HC65236), and San Diego State University (N01–HC65237). The following Institutes/Centers/Offices contributedto the HCHS/SOL through a transfer of funds to the NHLBI: National Institute on Deafness and Other CommunicationDisorders, National Institute of Dental and Craniofacial Research, National Institute of Diabetes and Digestive and KidneyDiseases, National Institute on Minority Health and Health Disparities, National Institute of Neurological Disorders andStroke, NIH Office of Dietary Supplements.editorial acknowledgmentWith thanks to Nancy Eng, NHLBIsection ii: acknowledgments 7
III. Introductionphoto by larissa avilés-santastudy descriptionThe Hispanic Community Health Study/Study of Latinos(HCHS/SOL), which began in 2006, is a comprehensivelongitudinal multicenter community–based cohort study ofHispanic/Latino populations in the United States. Between2008 and 2011, 16,415 U.S. Hispanic/Latino adults wererecruited from a random sample of households in fourcommunities located in the Bronx, Chicago, Miami, andSan Diego, and they underwent a baseline clinicexamination. Each community had more than 4,000above: Study recruiter, San Diegoparticipants from diverse Hispanic/Latino backgroundswho self–identified as Cuban, Dominican, Puerto Rican,underwent an extensive clinic examination to determineMexican, Central American, or South American and werebaseline cardiovascular prevalence and to identify potentialof diverse socioeconomic groups. They were selected to berisk and protective factors. The baseline examination wasrepresentative of the target population in each communityadministered in English or Spanish based on the participant’srather than the entire U.S. population. Study participantspreference. Baseline questionnaires included informationwere selected to obtain approximately one–third betweenon personal and family health, acculturation (including18–44 years of age and two–thirds between 45–74 years oflanguage and cultural food preferences), physical activity,age (Lavange et al., 2010; Sorlie et al., 2010).diet, sleep, occupation, and other personal characteristics.Clinical assessments included hearing, vision, and dentalThe goals of the study are to identify risk factors thatexams, and many types of blood tests. Physical activity andmay have a protective or harmful role in the developmentsleep were assessed by use of measurement devices thatof cardiovascular disease in Hispanics/Latinos and toparticipants took home with them. After the clinic visit,evaluate the role of acculturation in the prevalence andparticipants were followed regularly by telephone calls todevelopment of risk factors and disease. Study participantstrack important health events (Sorlie et al., 2010).how to read this data book – a guideThis page is a guide on how to understand the numbersoutcomes were calculated for sex, age, and backgroundand charts included in this book. Questions about healthgroups. All percentages and averages are “weighted” tostatus were asked of all participants. The percentage ofaccount for how households and people were sampledpersons who responded that they had a disease, condition,to be comparable to the 2010 U.S. Census population.or behavior relevant to this research is presented in chartsAll percentages and averages were also age–adjusted sofor different groups by age, sex, background, or community.that comparisons between sexes and among backgroundgroups could be compared equally. Age–adjustment wasIn this Data Book, percentages and averages for healthdone because substantial differences exist in age among8 hchs/sol data book: a report to the communities
backgrounds. For example, Cubans are, on average, olderParticipants), where numbers of participants representand Mexicans are, on average, younger. The only un–the actual counts of participants in each group.weighted estimates appear in Section V (Description ofdefinition of groupsAge: 18 to 44 years, 45 to 64 years, and 65 to 74 years.Hispanic/Latino background group: Central American,Cuban, Dominican, Mexican, Puerto Rican, and SouthSex: men and women.American.Community: Bronx, Chicago, Miami, and San Diego.description of chartsChart 1: Percent of Participants by Level of Education (Pie Chart Example)The title describes the chart as the percentage ofparticipants with different levels of education in16%different colors.33%These numbers show the percentage of participants23%in each education group. For example, in this chart, 33percent of the participants (orange area) had less than27%Less ThanHigh SchoolHigh School Grada high school education.Some CollegeCollege DegreeThe legend shows different colors for different groups.In this chart, these colors are levels of education.Chart 2: Number of Participants by Background – Chicago (Bar Chart Example)This title describes the chart as the number of3000participants by background in Chicago.25002,4092000This number shows the number of participants by1500background. In Chicago, 2,409 participants were ofMexican 27DominicanMexicanPuertoRicanSouthAmericanThe legend shows different groups by age, sex,background or community. In this chart, thebackground groups are shown.section iii: introduction 9
IV. Field CenterDescriptionsbronx field centerThe Bronx Field Center is located in Bronx, New York,which is one of five boroughs of New York City. New YorkCity's Hispanic/Latino population grew by 8.1 percent inthe past decade, reaching 2,336,076 in 2010. Hispanics/Latinos now account for 28.6 percent of the overall NewYork City population (New York City Department of CityPlanning [NYCDCP], 2011). The Bronx has one of thehighest concentrations of Hispanic/Latino persons in anyU.S. urban area—over half of the 1.4 million residents ofthe Bronx are of Hispanic/Latino background (NYCDCP,2011).Puerto Ricans are the largest Hispanic/Latino backgroundgroup in the Bronx, followed by Dominicans, Mexicans, andCentral and South Americans. While the Bronx Hispanicpopulation has tended to concentrate in the southern andwestern portions of the borough, the greatest populationgains over recent years in the Hispanic/Latino populationwere in neighborhoods outside these areas (NYCDCP,2011).The Bronx has played an important role in shapingHispanic/Latino history in the United States. SoniaSotomayor, who in 2009 became the first person ofHispanic/Latino heritage to serve on the U.S. SupremeCourt, was born and raised in the Bronx. Dr. HelenRodriguez–Trias, a public health and human rights activistwho was the first Latina to head the American PublicHealth Association, was on the faculty of Albert EinsteinCollege of Medicine in the Bronx. The Bronx alsotop to bottom: Fordham Road; Bronx-Manhattanpopularized both salsa and hip–hop music.skyline; Fordham Plaza10 hchs/sol data book: a report to the communities
A Bronx Participant“I started this program in 2008, I am participating until now, 2013. I believe thisstudy is very important so that they could find solutions for the sickness of theSpanish people, and at the same time they can prevent all the sickness such asdiabetes, high blood pressure, obesity, and more. I congratulate the people thatcreated the program, it's very important. Thank you very much!”photos by larissa avilés-santaphotos by larissa avilés-santachicago field centerleft to right: Mural on a private residence; Chicago skyline; East end of Paseo Boricua, Humboldt ParkIn 2010, nearly 2.7 million people were living in Chicagoand immigration status. These are vibrant communitiesand 29 percent were of Hispanic/Latino backgroundwith high concentrations of businesses (e.g., ethnic food(U.S. Census Bureau, 2010). Chicago has the third largestrestaurants and bodegas/tiendas de abarrotes), botánicasconcentration of Mexicans/Mexican-Americans in the(folk medicine pharmacies), and a diversity of otherUnited States and the second largest concentration ofestablishments. Devotion to religious practices and anPuerto Ricans. Although the vast majority of Hispanics/emphasis on family ties are prevalent, with individualsLatinos (74 percent) living in Chicago are Mexicans/frequently living in an extended family system whereMexican-Americans, many other ethnic groups, includingmany generations (grandparents, parents, and siblings)individuals from Central and South America and thelive together on different levels of a multi–unit building.Caribbean (Ready & Brown–Gort, 2005), also reside here.The Hispanic/Latino communities of Chicago are wellParticipants were recruited from six Chicago communitiesorganized and have a tradition of caring and problem–(Albany Park, Belmont–Cragin, Hermosa, Humboldt Park,solving leaders who have established health, humanIrving Park, and Logan Square) located on the north/services, and educational organizations and communitynorthwest side of the city. These communities reflect thecoalitions to respond to community needs. In addition, thediversity of Hispanics/Latinos in terms of socioeconomicHispanic/Latino communities in Chicago are rich instatus, national origins and backgrounds, language use,culture and arts. Ethnic pride and nationalism aresection iv: field center descriptions 11
expressed through public murals at almost every corner ofstruggles, or religious beliefs and practices and serve tothe Hispanic/Latino neighborhoods in the city. Theseinspire all members of the diverse communities frommurals tell stories of social justice (or injustice), politicalwhich Chicago HCHS/SOL participants were recruited.A Chicago Participant“The study is superb and I enjoyed my visit to the clinic.”photo by larissa avilés-santamiami field centerclockwise from top left: Mosaic tiles inMaximo Gomez/Domino Park; City of Hialeahentrance; Miami Freedom Tower BuildingIn 2010, more than 2.5 million people were living in Miami–Dade County, located in southeastern Florida. Within thecounty, 51 percent of the residents are foreign born and64 percent report speaking Spanish at home (U.S. CensusBureau, 2010). The percent of persons of Hispanic/Latinobackground has continued to increase over the past decadeand today accounts for 65 percent of the population (U.S.Census Bureau, 2010).Participants in the Miami Field Center were recruited fromof Coral Gables has 47,000 residents with 54 percentMiami, Hialeah, and Coral Gables. Miami is the largestHispanic/Latino (U.S. Census Bureau, 2010). In each ofcommunity with almost 400,000 residents of which 70these areas, the majority background group is Cuban, withpercent are of Hispanic/Latino background (U.S. Censusthe next being Central American. These communitiesBureau, 2010). The city of Hialeah has 225,000 residentsrepresent a diversity of education and income.with 95 percent of them Hispanic/Latino, and the city12 hchs/sol data book: a report to the communities
Miami has played a unique role in the history ofIsland” of Florida and stands today as a memory of theimmigration in the United States. In the 1960s, substantialwaves of immigration. The Spanish language is spokenimmigration occurred from Cuba to the Miami area inby more persons in Miami than in any other U.S. city. Littlethree waves and included many persons who were wellHavana, a neighborhood in Miami, once almost exclusivelyeducated or who had high skill levels. In 1980, anotherthe residence of Cubans, now has immigrants from otherwave of Cuban immigration occurred followed moreLatin American countries. It is still the center of social,recently by immigration from Central and Southcultural and political activity for Cubans (Wikipedia,America. The Freedom Tower in Miami was the “EllisMiami).A Miami Participant“This is an excellent study because many people need to knowabout our health, and this was a good opportunity given to us.”san diego field centerphoto by larissa avilés-santaclockwise from top left: Third Avenue, Chula Vista; San Diego trolley; Murals in Chicano ParkSan Diego is California’s most southern city and is locatedof Hispanic/Latino residents than other regions in Sannext to the northern border of Mexico. San Diego is theDiego. San Diego is locally known as “the South Bay”birthplace of California and home to a rich multiculturaland includes the communities of San Ysidro, Chula Vista,heritage. The San Diego–Tijuana bordercrossing is theNational City, Imperial Beach, and Bonita.busiest in the world (Becker & Armendariz, 2012), whichmakes it a unique and vibrant bi–national community.Mexico’s influence on San Diego County is cultural,According to the 2010 Census, around one–fourth of Sanpolitical, spiritual, and economic. Culturally, MexicanDiegans are Mexican or Mexican American (U.S. Censusinfluences can be found in local artwork in murals atBureau, 2010).college campuses and Chicano Park. Politically, communityproperty and water rights were based on Spanish andRecruitment of the San Diego HCHS/SOL participantsMexican traditions that considered water a communityfocused on communities that have higher concentrationsresource to be divided as the community decided.section iv: field center descriptions 13
Spiritually, the Mexican religious traditions are evident inmajor role in the development and maintenance of SanSan Diego churches that celebrate Día de Guadalupe andDiego’s agricultural economy. The influence of MexicanLa Posada. San Diego is home to the first Church inculture is undeniable and continues to shape theCalifornia, the Mission Basilica San Diego de Alcala, whichdevelopment of San Diego (Kucher, 2010).was founded in 1769. Economically, Mexican labor plays aA San Diego Participant“The program was very good and I feel that what I did will bevery useful for future generations. Thank you very much.”Field Center LocationsBronxChicagoSan DiegoMiami14 hchs/sol data book: a report to the communities
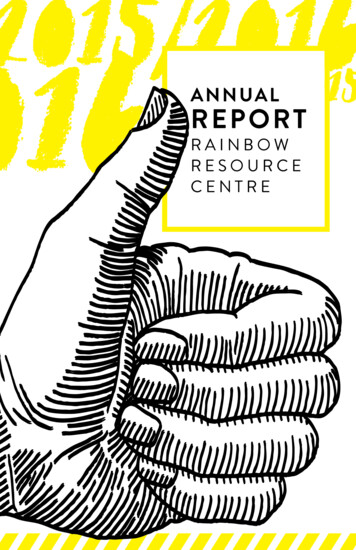
V. Description ofParticipantsparticipants by backgroundBackground was determined by participants’ self–report of heritage or descent. The very few participants who describedtheir background as mixed/other or who didn’t describe a specific background are not shown.Chart 3: Number of Participants by Background – BronxIn the Bronx Field Center, most2000participants are of Puerto Rican1,837background, followed by those of1500Dominican background.1,3801000500021945Central AmericanCuban208DominicanMexican187Puerto RicanSouth AmericanChart 4: Number of Participants by Background – ChicagoIn the Chicago Field Center,3000most participants are of Mexicanbackground, followed by those of2,4092250Puerto Rican, Central American andSouth American background.15007507704180Central American2527CubanDominican374MexicanPuerto RicanSouth Americansection v: description of participants 15
Chart 5: Number of Participants by Background – MiamiIn the Miami Field Center,3000most participants are of Cubanbackground, followed by those22502,269of Central American and SouthAmerican background.15001,0347500Central AmericanCuban468643882DominicanMexicanPuerto RicanSouth AmericanChart 6: Number of Participants by Background – San DiegoIn the San Diego Field Center, the4000vast majority of participants are of3,817Mexican background.30002000100006192Central AmericanCubanDominicanMexican3943Puerto RicanSouth AmericanChart 7: Number of Participants by Age and SexIn the study, 6,701 participants are6000in the 18 to 44 age group, 8,382 are5,203in the 45 to 64 age group, and 1,3324500are in the 65 to 74 age group.3,80130002,9003,179Sixty percent of the participants are1500women and 40 percent are men.5010Age 18-44Age 45-64Men831Age 65–74Women16 hchs/sol data book: a report to the communities
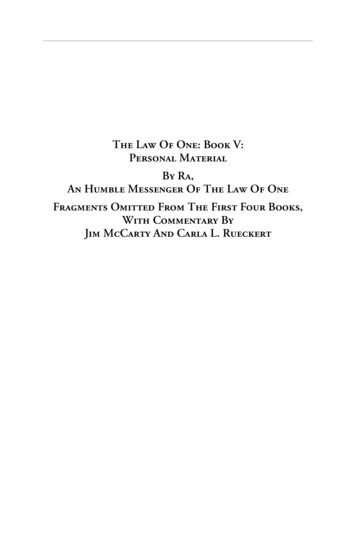
participants by education and income levelsParticipants reported their highest level of education. Education levels were grouped into four categories: less than highschool, high school graduate, some college, and college degree or more.Participants reported their annual household income. They were grouped into four categories: 20,000 or less, 20,001to 50,000, 50,001 or more, and unknown. A small number of participants did not provide information on annualincome and are included in the unknown group.Chart 8: Percent of Participants by Level of EducationMost participants completedsome high school or graduated16%from high school. Sixteen percentgraduated from college with a33%degree, and another 23 percent23%attended at least some college.Thirty–three percent have less27%Less ThanHigh SchoolHigh School Gradthan a high school education.Some CollegeCollege DegreeChart 9: Percent of Participants by Yearly Household IncomeForty–two percent of theparticipants have a yearly household10%12%income of 20,000 or less.42%36% 20,000or Less 20,001– 50,000 50,001or MoreUnknownsection v: description of participants 17
participants by preferred language useAt the examination visit, each participant was asked which language he or she preferred to use during the visit.Chart 10: Percent of Participants by Language PreferenceThe majority, about 3 of every 4persons, requested the use ofSpanish instead of English.24%76%SpanishEnglishparticipants by place of birth and time living in theunited statesParticipants reported their place of birth. They also reported the number of years they lived in the 50 States or District ofColumbia. Responses were grouped into three categories: less than 10 years, 10 to 19 years, and 20 or more years.Chart 11: Percent of Participants by Place of BirthApproximately three–fourths of theparticipants were not born in the 50States or District of Columbia.21%In this chart, participants from79%Puerto Rico are reported amongthose born outside the 50 States orDistrict of Columbia.Not Bornin the U.S.Bornin U.S.18 hchs/sol data book: a report to the communities
Chart 12: Percent of Participants by Number of Years Living in the United StatesAlmost half of all participants livedat least 20 years in the 50 States orDistrict of Columbia. One-fourth25%lived in the United States less than 1048%years and approximately one-fourthlived in the United States 10-19 years.27%Less Than10 Years10–19Years20 Yearsphoto by larissa avilés-santaphoto by larissa avilés-santaclockwise from top left: Dietary interview; Height measurement; Lung function test; Measurement of ankleblood pressuresection v: description of participants 19
VI. Disease Conditionscoronary heart disease and strokeCoronary Heart Disease (CHD) is a broad term used todescribe certain conditions that affect the heart. Theseconditions produce narrowed or blocked arteries thatlead to a lack of blood flow to the heart muscle which canlead to damage to the heart. This is called a heart attack(Mayo Clinic, Heart disease). A stroke occurs when bloodflow to a part of the brain is partially or totally blocked.This blockage of blood to the brain can lead
8 hchs/sol data book: a report to the communities III. Introduction study description The Hispanic Community Health Study/Study of Latinos (HCHS/SOL), which began in 2006, is a comprehensive longitudinal multicenter community–based cohort study of