Transcription
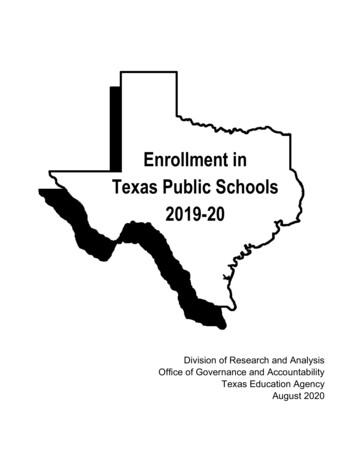
Enrollment inTexas Public Schools2019-20Division of Research and AnalysisOffice of Governance and AccountabilityTexas Education AgencyAugust 2020
Enrollmentin Texas Public Schools2019-20Project StaffJohn DuDaniel MurphyHolly RyonBrittany WrightEditorial StaffShannon NagyChristine WhalenRichard KallusDivision of Research and AnalysisOffice of Governance and AccountabilityTexas Education AgencyAugust 2020
Texas Education AgencyMike Morath, Commissioner of EducationOffice of Governance and AccountabilityJeff Cottrill, Deputy CommissionerDivision of Research and AnalysisLinda Roska, Executive DirectorAccountability Research UnitJennifer Broussard, DirectorCitation. Texas Education Agency. (2020). Enrollment in Texas public schools, 2019-20. (DocumentNo. GE20 601 12). Austin TX: Author.Abstract. This report provides information on enrollment in the Texas public school system from the2009-10 through 2019-20 school years, based on data collected through the Texas Student Data System.Enrollment data are provided by grade, race/ethnicity, gender, and economically disadvantaged status,and for instructional programs, nontraditional school models, and special populations. Data also are reported by education service center region and for open-enrollment charter schools.Additional copies of this document may be purchased using the order form in the back of thispublication. Also, the report is available in PDF format on the agency website at ormance/accountability-research/enrollment-trends. Additional informationabout this report may be obtained by contacting the Texas Education Agency Division of Research andAnalysis by phone at (512) 475-3523 or by e-mail at Research@tea.texas.gov.Copyright Notice. The materials are copyrighted and trademarked as the property of the Texas Education Agency (TEA) and may notbe reproduced without the express written permission of TEA, except under the following conditions: (1) Texas public school districts, charterschools, and Education Service Centers may reproduce and use copies of the Materials and Related Materials for the districts' and schools' educational use without obtaining permission from TEA; (2) residents of the state of Texas may reproduce and use copies of the Materials and RelatedMaterials for individual personal use only without obtaining written permission of TEA; (3) any portion reproduced must be reproduced in itsentirety and remain unedited, unaltered and unchanged in any way; and (4) no monetary charge can be made for the reproduced materials or anydocument containing them; however, a reasonable charge to cover only the cost of reproduction and distribution may be charged. Private entitiesor persons located in Texas that are not Texas public school districts, Texas Education Service Centers, or Texas charter schools or any entity,whether public or private, educational or non-educational, located outside the state of Texas MUST obtain written approval from TEA and willbe required to enter into a license agreement that may involve the payment of a licensing fee or a royalty. For information contact: CopyrightsOffice, Texas Education Agency, 1701 N. Congress Ave., Austin, TX 78701-1494; phone 512-463-9041; email: Copyrights@tea.texas.gov.iiEnrollment in Texas Public Schools, 2019-20
ContentsOverview . viiHighlights . ixEnrollment in Texas . 1Statewide Enrollment . 5Enrollment by Race/Ethnicity . 7Enrollment by Economically Disadvantaged Status . 10Enrollment by Economically Disadvantaged Status and Race/Ethnicity . 11Enrollment by Gender . 13Enrollment by Grade . 14Enrollment by Grade and Age . 16Enrollment by Grade and Race/Ethnicity . 17Enrollment by Grade and Economically Disadvantaged Status . 20Enrollment for Instructional Programs, Nontraditional School Models, and Special Populations . 22Enrollment for Instructional Programs and Special Populations by Race/Ethnicity . 29Enrollment for Instructional Programs and Special Populations by Economically DisadvantagedStatus . 32Enrollment for Instructional Programs and Special Populations by Gender . 34Enrollment by Education Service Center . 36Enrollment by Education Service Center and Race/Ethnicity . 40Enrollment by Education Service Center and Economically Disadvantaged Status . 45Enrollment in Open-Enrollment Charter Schools . 47Enrollment in Open-Enrollment Charter Schools by Race/Ethnicity . 49Enrollment in Open-Enrollment Charter Schools by Economically Disadvantaged Status . 51Enrollment in Open-Enrollment Charter Schools by Grade . 52Enrollment in Open-Enrollment Charter Schools for Instructional Programs and SpecialPopulations. 53National Enrollment Trends . 56References . 61List of TablesTable 1.Enrollment Summary, Texas Public Schools, 2018-19 and 2019-20 . 4Table 2.Statewide Enrollment, Texas Public Schools, 1987-88 Through 2019-20 . 6Table 3.Change in Statewide Enrollment, Texas Public Schools . 6Enrollment in Texas Public Schools, 2019-20iii
Table 4.Enrollment by Race/Ethnicity, Texas Public Schools, 2009-10 Through 2019-20 . 8Table 5.Hispanic Students by Race, Texas Public Schools, 2018-19 and 2019-20. 9Table 6.Non-Hispanic Multiracial Students by Most Common Racial Combinations, Texas PublicSchools, 2018-19 and 2019-20 . 9Table 7.Enrollment of Economically Disadvantaged Students, Texas Public Schools, 2009-10Through 2019-20 . 10Table 8.Enrollment of Economically Disadvantaged Students Within Racial/Ethnic Groups,Texas Public Schools, 2009-10 Through 2019-20 . 12Table 9.Enrollment by Gender, Texas Public Schools, 2009-10 Through 2019-20 . 13Table 10. Enrollment by Grade, Texas Public Schools, 2018-19 and 2019-20 . 15Table 11. Enrollment of Students in Grades 9-12 by Age, Texas Public Schools, 2019-20 . 16Table 12. Enrollment by Grade and Race/Ethnicity, Texas Public Schools, 2018-19 and 2019-20 . 18Table 13. Enrollment of Economically Disadvantaged Students Within Grades, Texas PublicSchools, 2018-19 and 2019-20 . 21Table 14. Enrollment for Instructional Programs and Special Populations, Texas Public Schools,2009-10 Through 2019-20 . 25Table 15. Enrollment of English Learners, by Special Language Program Instructional Model,Texas Public Schools, 2009-10 Through 2019-20 . 27Table 16. Enrollment for Nontraditional School Models, Texas Public Schools, 2018-19 and2019-20 . 28Table 17. Enrollment for Instructional Programs and Special Populations by Race/Ethnicity, TexasPublic Schools, 2018-19 and 2019-20 . 30Table 18. Enrollment of Economically Disadvantaged Students Within Instructional Programs andSpecial Populations, Texas Public Schools, 2009-10 and 2019-20 . 33Table 19. Enrollment for Instructional Programs and Special Populations by Gender, Texas PublicSchools, 2009-10 and 2019-20 . 35Table 20. Enrollment by Education Service Center, Texas Public Schools, 2009-10 Through2019-20 . 38Table 21. Enrollment by Education Service Center and Race/Ethnicity, Texas Public Schools,2018-19 and 2019-20. 41Table 22. Enrollment of Economically Disadvantaged Students Within Education Service Centers,Texas Public Schools, 2009-10 and 2019-20 . 46Table 23. Statewide Enrollment, Texas Open-Enrollment Charter Schools, 1996-97 Through2019-20 . 48Table 24. Enrollment by Race/Ethnicity, Texas Open-Enrollment Charter Schools, 2009-10Through 2019-20 . 50Table 25. Enrollment of Economically Disadvantaged Students, Texas Open-Enrollment CharterSchools, 2009-10 Through 2019-20 . 51Table 26. Enrollment by Grade, Texas Open-Enrollment Charter Schools, 2018-19 and 2019-20 . 52ivEnrollment in Texas Public Schools, 2019-20
Table 27. Enrollment for Instructional Programs and Special Populations, Texas Open-EnrollmentCharter Schools, 2009-10 Through 2019-20 . 54Table 28. Public School Enrollment, Four Most Populous States and the United States, Fall 2007and Fall 2017 . 57Table 29. Public School Enrollment (%) by Race/Ethnicity, Four Most Populous States and theUnited States, Fall 2007 and Fall 2017 . 58Table 30. Public School Enrollment (%) of Students Eligible for the National School Lunch andChild Nutrition Program, Four Most Populous States and the United States, 2006-07and 2016-17 . 59Table 31. Public School Enrollment (%) of Students Participating in Special Education Programs,Four Most Populous States and the United States, 2007-08 and 2017-18. 59Table 32. Public School Enrollment (%) of Students Participating in Programs for StudentsIdentified as English Learners, Four Most Populous States and the United States,Fall 2005 and Fall 2017 . 60List of FiguresFigure 1. Enrollment by Race/Ethnicity, Texas Public Schools, 2009-10 Through 2019-20 . 7Figure 2. Enrollment of Economically Disadvantaged Students, Texas Public Schools, 2009-10Through 2019-20 . 10Figure 3. Enrollment of Economically Disadvantaged Students Within Racial/Ethnic Groups,Texas Public Schools, 2009-10 Through 2019-20 . 11Figure 4. Enrollment by Grade, Texas Public Schools, 2018-19 and 2019-20 . 15Figure 5. Enrollment of Students in Grades 9-12 by Age, Texas Public Schools, 2019-20 . 16Figure 6. Enrollment by Grade and Race/Ethnicity, Texas Public Schools, 2019-20 . 17Figure 7. Enrollment of Economically Disadvantaged Students Within Grades, Texas PublicSchools, 2019-20 . 20Figure 8. Enrollment in Instructional Programs, Texas Public Schools, 2009-10 Through 2019-20 . 24Figure 9. Enrollment for Instructional Programs by Race/Ethnicity, Texas Public Schools, 2019-20 . 29Figure 10. Enrollment of Economically Disadvantaged Students Within Instructional Programs,Texas Public Schools, 2019-20 . 32Figure 11. Enrollment for Instructional Programs by Gender, Texas Public Schools, 2019-20 . 34Figure 12. Change in Enrollment Within Education Service Centers, Texas Public Schools,2009-10 to 2019-20 . 37Figure 13. Enrollment by Education Service Center and Race/Ethnicity, Texas Public Schools,2019-20. 40Figure 14. Change in Enrollment of Economically Disadvantaged Students Within EducationService Centers, Texas Public Schools, 2009-10 to 2019-20 . 45Figure 15. Enrollment by Race/Ethnicity, Texas Open-Enrollment Charter Schools, 2009-10Through 2019-20 . 49Enrollment in Texas Public Schools, 2019-20v
Figure 16. Enrollment of Economically Disadvantaged Students, Texas Open-Enrollment CharterSchools, 2009-10 Through 2019-20 . 51Figure 17. Enrollment by Grade, Texas Open-Enrollment Charter Schools, 2018-19 and 2019-20 . 52Figure 18. Enrollment in Instructional Programs, Texas Open-Enrollment Charter Schools, 2009-10Through 2019-20 . 53viEnrollment in Texas Public Schools, 2019-20
OverviewThis report provides enrollment data for students attending Texas public schools in the 2019-20school year and updates 10-year trends in state enrollment. Enrollment data are provided by the followingstudent characteristics: race/ethnicity, economic status, gender, and grade level. Data are also providedby student participation in the following special instructional programs: bilingual or English as a secondlanguage (ESL), career and technical education, gifted and talented, Section 504, special education, andTitle I. In addition, data are provided for the following special populations: students identified as at risk ofdropping out of school, as having dyslexia, as English learners, as in foster care, as homeless, as immigrants, as migrants, and as military-connected. Data are also provided for students identified as Englishlearners by special language program instructional model. Additionally, data are provided for students enrolled in nontraditional school models such as Early College High Schools (ECHS), Pathways in Technology Early College High Schools (P-TECH), and Texas Science, Technology, Engineering, andMathematics (T-STEM) Academies.Enrollment data for the 20 regional education service centers (ESCs) throughout the state are presented, as are data for open-enrollment charter schools. In addition, national enrollment trends are examined, and enrollment data for the four most populous states in the United States (California, Florida, NewYork, and Texas) are compared.Enrollment in Texas Public Schools, 2019-20vii
viiiEnrollment in Texas Public Schools, 2019-20
Highlights In the 2009-10 school year, 4,847,844 students were enrolled in Texas public schools. By 2019-20,enrollment had risen to 5,493,940 students. Over the 10-year period, total enrollment increased by646,096 students, or by 13.3 percent. In 2019-20, statewide enrollment increased from the previous year by 1.1 percent. Across the five largest racial/ethnic groups in 2019-20, enrollment increased from the previous yearfor African American, Asian, Hispanic, and multiracial students and decreased slightly for Whitestudents. Across the same groups, Hispanic students accounted for the largest percentage of total enrollment inTexas public schools in 2019-20 (52.8%), followed by White (27.0%), African American (12.6%),Asian (4.6%), and multiracial (2.5%) students. The percentage of students identified as economically disadvantaged in 2019-20 (60.2%) was higherthan the percentage identified in 2009-10 (58.9%). Between 2009-10 and 2019-20, the percentage increase in the number of students identified as economically disadvantaged (16.0%) was greater than the percentage increase in the student populationoverall (13.3%). In 2019-20, Grade 9 had the highest enrollment, at 449,122 students, followed by Grade 7, at423,545 students. The percentage of students identified as English learners grew from 16.9 percent in 2009-10 to20.3 percent in 2019-20. Between 2018-19 and 2019-20, the number of students identified as homeless increased by 7.6 percent, or by 5,514 students. The number of students in Grades 9-12 participating in career and technical education programs increased by 81.4 percent between 2009-10 and 2019-20. The percentage of students served in special education programs increased from 9.8 percent in2018-19 to 10.7 percent in 2019-20. Across regional education service centers in 2009-10, Region 4 (Houston) served the largest studentpopulation, accounting for 22.2 percent of total state public school enrollment. In 2019-20, Region 4continued to serve the largest proportion of total enrollment (22.7%). In the 2019-20 school year, there were 180 open-enrollment charter schools and 787 open-enrollmentcharter school campuses that served 336,900 students. Students enrolled in open-enrollment charterschools accounted for 6.1 percent of the total Texas public school population. Across the five largest racial/ethnic groups in 2019-20, Hispanic students accounted for the largestpercentage of total enrollment in open-enrollment charter schools (62.3%) followed by African American (17.7%), White (13.0%), Asian (4.6%), and multiracial (2.0%) students. In the 2019-20 school year, 70.8 percent of Texas open-enrollment charter school students were identified as economically disadvantaged.Enrollment in Texas Public Schools, 2019-20ix
According to national figures, public school enrollment in Texas increased by 15.5 percent between2007 and 2017, more than five times the increase in the United States (2.8%) over the same time period. This was the third-highest percentage increase in statewide public school enrollment in the nation, behind North Dakota (17.7%) and Utah (16.0%). According to national figures, from 2007 to 2017, the proportion of public school enrollment accounted for by Hispanic students increased from 47.2 percent to 52.4 percent in Texas and from21.1 percent to 26.7 percent nationwide. During the same period, the proportion of enrollment accounted for by White students decreased from 34.8 percent to 27.9 percent in Texas and from55.8 percent to 47.6 percent nationwide. National figures indicate the majority of students in Texas (59.0%) were eligible for free orreduced-price meals in the 2016-17 school year, 6.7 percentage points higher than the nationalaverage (52.3%). Between 2006-07 and 2016-17, the percentage of eligible students increased by11.4 percentage points in Texas and by 9.9 percentage points nationwide.xEnrollment in Texas Public Schools, 2019-20
Enrollment in TexasReporting of Enrollment DataEnrollment is typically defined as the number of students registered in a school at a designated timein the school year. In this report, enrollment refers to the number of students enrolled in early educationthrough Grade 12 in the Texas public school system as of the last Friday in October. This designated dayis called the "snapshot date" in the Public Education Information Management System (PEIMS). Enrollment counts are available for all campuses, school districts, charter schools, counties, education servicecenter regions, and the state.Enrollment data in Texas include student demographic information, such as race/ethnicity, gender,and economically disadvantaged status, and information on student participation in special programs.Data on student characteristics and program participation are essential for monitoring educational progress and planning educational programs at all levels of the education system.Financial planners and civic leaders use enrollment data to monitor the educational needs of a community. For example, a growing community will consider current enrollment data when making decisionsto add teachers or adjust school programs in the short term. For long-term planning purposes, districts useenrollment trend data to predict and respond to changing needs in areas such as school facilities.Texas public school enrollment data are used at the regional and state levels for education policyplanning, administration, and research. Because enrollment trends reflect changes in society as a whole,the Texas Education Agency (TEA), state legislature, and research organizations use enrollment data toprepare for the future educational needs of Texas. Enrollment data allow the computation of many vitalstatistics about the Texas public education system, such as student/teacher ratios.Since 1994, accountability ratings for Texas public schools and districts have been based on legislatively mandated indicators that draw from enrollment data collected by TEA. Texas law provides that"Performance on the achievement indicators adopted . must be based on information that is disaggregated by race, ethnicity, and socioeconomic status ." (Texas Education Code [TEC] §39.053, 2019).As a result, performance is reported by total student population and by student group categories, such asrace/ethnicity and economically disadvantaged status.Enrollment data also are required by federal education legislation. For example, the Every StudentSucceeds Act (ESSA, 2015) obliges states to submit data for all students by the following categories:economically disadvantaged students; students from major racial and ethnic groups; students with disabilities; and students identified as English learners. Likewise, ESSA requires state report cards to be submitted annually with information on student achievement disaggregated by race, ethnicity, gender, disabilitystatus, migrant status, English language proficiency, status as economically disadvantaged, homeless status, foster care status, and status as a student with a parent who is a member of the U.S. armed forces onactive duty.In the 2019-20 school year, a broad range of information, such as student characteristics and programparticipation, was collected through the Texas Student Data System on more than 1,200 school districtsand open-enrollment charters; more than 9,000 schools; more than 363,000 teachers; and over 5.4 millionstudents. Texas public school students are served in markedly diverse school settings. Districts ranged insize from less than one square mile to nearly five thousand square miles. The district with the smallest enrollment in the state, San Vicente Independent School District (ISD), had a total enrollment of 14 students. In contrast, more than 210,000 students received instruction at 280 school sites in Houston ISD.Enrollment in Texas Public Schools, 2019-201
Data for state-administered school districts are not included in this report. State-administered districtsare created by legislative act and funded and administered by state government agencies, such as theTexas Juvenile Justice Department and the Texas Department of Aging and Disability Services.This report provides an overview of Texas enrollment trends, including diversity of the student population by grade, by education service center region, and within open-enrollment charter schools (Table 1on page 4). Historical data on Texas public school enrollment are included with discussion of changesover time.Reporting of Race/EthnicityIn 2009-10, TEA began collecting data on race and ethnicity in compliance with a new federal standard(TEA, 2009). For that year only, as a transitional measure, the data also were collected using the oldstandard. The current standard requires that race and ethnicity be collected separately using a specifictwo-part question, presented in a specific order, and that both parts of the question be answered (TEA,2019).Part 1. Ethnicity: Is the person Hispanic/Latino? Choose only one. Hispanic/Latino Not Hispanic/LatinoPart 2. Race: What is the person's race? Choose one or more, regardless of ethnicity. American Indian or Alaska Native Asian Black or African American Native Hawaiian/Other Pacific Islander WhiteThe racial/ethnic categories are defined as follows. Hispanic/Latino includes students of Cuban,Mexican, Puerto Rican, South or Central American, or other Spanish culture or origin, regardless of race.American Indian or Alaska Native includes students having origins in any of the original peoples of Northand South America (including Central America), and who maintain a tribal affiliation or community attachment. Asian includes students having origins in any of the original peoples of the Far East, SoutheastAsia, or the Indian subcontinent. Black or African American includes students having origins in any ofthe black racial groups of Africa. Native Hawaiian/Other Pacific Islander includes students having originsin any of the original peoples of Hawaii, Guam, Samoa, or other Pacific Islands. White includes studentshaving origins in any of the original peoples of Europe, the Middle East, or North Africa.Adoption of the current standard results in several important changes: (a) the combined racial category Asian/Pacific Islander is now separated into two categories; (b) students once identified exclusivelyas "Hispanic/Latino" must now report their race; (c) students may report more than one race; and (d) thedefinition for one of the racial categories—American Indian or Alaska Native—differs from that usedin years past. Prior to 2009-10, American Indian or Alaska Native included students having origins inany of the original peoples of North America only.Throughout the rest of this report, students classified in PEIMS as Hispanic/Latino are referred to asHispanic; students classified as American Indian or Alaska Native are referred to as American Indian; students classified as Black or African American are referred to as African American; students classified asNative Hawaiian/Other Pacific Islander are referred to as Pacific Islander; and students classified as having two or more races are referred to as multiracial.2Enrollment in Texas Public Schools, 2019-20
For purposes of reporting Texas public school enrollment data, TEA combines the answers to thetwo-part question to create seven mutually exclusive racial/ethnic categories. A student identified asHispanic is included only in the count for Hispanics. A student not identified as Hispanic is included inthe count for only one of the following six racial categories: African American, American Indian, Asian,Pacific Islander, White, or multiracial. A student identified as having two or more races is included onlyin the count for multiracial students, not in the count for any single racial category.In the section "National Enrollment Trends" on page 56, national
language (ESL), career and technical education, gifted and talented, Section 504, special education, and Title I. In addition, data are provided for the following special populations: students identified as at risk of dropping out of school, as having dyslexia, as E
