Transcription
KENYATTA UNIVERSITY – INSTITUTE OF OPENING LEARNINGDEPARTMENT OF GEOGRAPHY IIIAGE 301: PHYSICAL GEOGRAPHYDR. JOY APIYO OBANDO&DR. GEORGE LUKOYE MAKOKHA 2005
FOREWORDPhysical Geography III is a course that builds on the knowledge gained from the study ofPhysical Geography I and II. It builds on the knowledge of the atmosphere introduced inPhysical Geography I and introduces the basic concepts of Biogeography, mainly concernedwith the factors that determine the distribution of living organisms and their impact on theenvironment. The course also examines the scope and growth of Biogeography, vegetationand soils. Aspects of the atmosphere such as climatic elements and their distribution, climaticfactors, climatic classification schemes and climatic change are adequately covered.The overall objective of this course is to enable the learner to be able to explain the concepts,linkages and processes in the Atmosphere and Biosphere. Learners are expected after studyingthis course to explain the patterns and controls of global climates, vegetation and soils andtheir influence on the Biosphere. They should also be able to explain the effect of biotic andabiotic factors on the distribution of living organisms. Lessons 1 to 4 discuss the aspects ofthe atmosphere, while the biosphere is covered in Lessons 5 to 10.
TABLE OF CONTENTSPAGEFOREWORD.ILESSON 1.CLIMATIC ELEMENTS AND THEIR GLOBAL DISTRIBUTION . 11.1.Introduction . 11.2.Objectives. 11.3.Temperature . 11.4.Evaporation . 61.5.Precipitation . 81.6.Summary . 101.7.Definitions of Key Words . 111.8.Revision Questions. 121.9.Further Reading. 12LESSON 2.CLIMATIC CONTROLS AND FACTORS. 132.1.Introduction . 132.2.Objectives. 132.3.Air Masses. 132.4.Convergence of air masses and fronts. 162.5.Frontal systems. 162.6.Latitude. 192.7.Altitude. 202.8.Land and water masses. 212.9.Relief features . 212.10.Summary . 212.11.Definition of Key Words. 212.12.Revision Questions. 222.13.Further Reading. 22LESSON 3. CLIMATIC CLASSIFICATION, MICRO AND MAN-MADECLIMATES 233.1.Introduction . 233.2.Objectives. 233.3.Purpose and problems of climatic classification . 233.4.Approaches to climatic classification. 24ii
3.5.Genetic classification schemes. 253.6.Generic/Empirical Classification Schemes . 273.7.Climatic regions of the world. 293.8.Micro-Climates or Local Climates. 303.9.Man made climates. 313.10.Cloud seeding. 323.11.Summary . 323.12.Definitions of Key Words . 333.13.Revision Questions. 333.14.Further Reading. 33LESSON 4.CLIMATE CHANGE AND FLUCTUATIONS. 354.1.Introduction . 354.2.Objectives. 354.3.Natural climate change. 354.4.Man-made climatic change . 374.5.Global warming and climate changes . 384.6.Summary . 394.7.Definitions of Key Words . 394.8.Revision Questions. 394.9.Further Reading. 39LESSON 5.SCIENCE OF BIOGEOGRAPHY . 415.1.Introduction . 415.2.The objectives . 415.3.Definitions and concepts . 415.4.The scope and growth of Biogeography . 425.5.The biosphere and role of humankind. 435.6.Summary . 435.7.Definition of key words. 445.8.Revision Questions. 445.9.Further Reading. 44LESSON 6.ECOSYSTEM CONCEPT . 456.1.Introduction . 456.2.The objectives . 45iii
6.3.The Ecosystem . 456.4.Ecosystem structure and function . 466.5.Energy flow in ecosystems. 476.6.Nutrient cycling in the ecosystem . 496.7.Summary . 526.8.Definition of key words. 526.9.Revision Questions. 526.10.Further Reading. 53LESSON 7. PATTERNS AND TYPES OF DISTRIBUTION OF LIVINGORGANISMS . 547.1.Introduction . 547.2.The objectives . 547.3.Patterns and Distribution of Living Organisms. 547.4.Spatial and temporal patterns . 557.5.Abiotic Factors and Distribution of Living Organisms. 597.6.Biotic Factors and Distribution of Living Organisms. 657.7.Fire . 707.8.Anthropogenic. 717.9.Time and Ecosystems. 717.10.Summary . 717.11.Definition of key words. 717.12.Revision Questions. 727.13.Further Reading. 72LESSON 8.VEGETATION PROCESSES . 738.1.Introduction . 738.2.Objectives. 738.3.Ecological Succession . 738.4.Dominance at Climax. 758.5.Dispersal Mechanisms. 758.6.Adaptation . 768.7.Summary . 768.8.Definition of key words. 768.9.Revision Questions. 778.10.Further Reading. 77iv
LESSON 9.WORLD VEGETATION ITS DISTRIBUTION AND CLASSIFICATION789.1.Introduction . 789.2.Objectives. 789.3.Vegetation regions of the world . 789.4.Forests . 799.5.Grasslands . 839.6.Biological Deserts . 849.7.Aquatic Ecosystems . 879.8.Summary . 889.9.Definition of key words. 889.10.Revision Questions. 889.11.Further Reading. 88LESSON 10.SOILS . 9010.1.Introduction . 9010.2.The objectives . 9010.3.Formation of Soils. 9010.4.Physical and chemical properties of soil . 9110.5.Types and classification of soils. 9210.6.The soil catena. 9510.7.Soil Conservation and Management . 9510.8.Climate, Vegetation and Soils. 9510.9.Summary . 9710.10.Definition of key words. 9710.11.Revision Questions. 9710.12.Further Reading. 97v
LIST OF FIGURESPAGEFigure 1. Temperature inversion where warm air is above cooler air at the surface ----- 2Figure 2. A warm front system --------------------17Figure 3. A cold front system ----------------------17Figure 4: Cold Front Type of Occlusion ---------18Figure 5: Warm front type of occlusion ----------19Figure 6: The geosystem -----------------------------45Figure 7: A simple food chain ----------------------48Figure 8: Simple Biogeochemical cycle -----------49Figure 9: The equatorial rainforest ---------------80Figure 10: Idealised Soil ---------------------------92vi
LIST OF TABLESPAGETable 1. Thermal properties of air and various surfaces ---------------------------------------- 4Table 2: Theoretical Planetary Temperature at sea level --------------------------------------- 6Table 3: Flohn Classification -------------------25Table 4: Budyko Climatic Classification ---------26Table 5: Ecosystems and human induced ----51vii
LESSON 1.CLIMATIC ELEMENTS AND THEIR GLOBALDISTRIBUTION1.1. IntroductionIn this lesson, the characteristics and global distribution of three fundamental climaticelements, namely temperature, evaporation and precipitation will be discussed. In PhysicalGeography II, climate was defined as the average conditions of the atmosphere near theearth’s surface over a period of years. It was generally described in meteorological conditionssuch as temperature, humidity, precipitation, wind, radiation, sunshine and cloudiness. Theclimate of a region has profound influences its on soil, vegetation and landforms. Itdetermines the suitability of a region for agriculture and it influences the processes that shapethe landscape. Therefore, understanding the global distribution of the earth’s climatic regionsis the key to understanding many of the characteristics of those regions. Before understandingthe overall global distribution of climate it is important to understand the characteristics anddistribution of specific climatic elements.1.2. ObjectivesBy the end of this lesson the learner should be able to:1. Explain the importance of three main climatic elements, namelytemperature, evaporation and precipitation.2. Explain the characteristics of the three main climatic elements oftemperature, evaporation and precipitation.3. Describe the global distribution patterns of the three climatic elements andexplain the factors the cause these patterns.1.3. TemperatureTemperature provides a measure of the intensity or degree of hotness of a given object orbody. It is therefore the condition that determines the flow of heat energy from one substanceto another with the flow always being from high to low temperature. Thus by studying thetemperature characteristics of the earth- atmosphere system, one is in fact studying the heatenergy of the system and how it is distributed over the earth’s surface.1
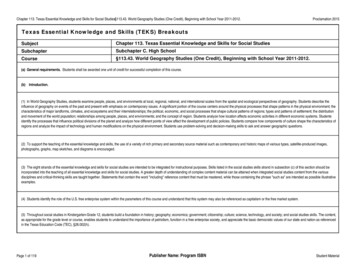
1.3.1. Vertical distribution of temperatureIn the troposphere, temperature decreases with increase in elevation, what is commonlyreferred to as Environmental Lapse Rate (ELR). This has been calculated for many worldareas to average 6.50C/km. The vertical distribution of temperature is influenced by the natureof the underlying surface. For example, temperature decreases most rapidly with altitude overcontinental areas than water masses in summer.Another effect of altitude on temperature is the difference it causes on diurnal range oftemperature, such that this range is greater at a higher elevation than at an equivalent climateat sea level. The main difference occurs during the night when the escape of terrestrial energytakes place readily because of the lower density of gases at higher elevation. The decrease ofpressure with altitude also modifies the meaning of given values on temperature scales. Thereduced pressure, for example, means that molecules of water vapour escape more easily froma water surface. Thus at sea level, water boils at a temperature of 1000C, at an elevation ofabout 3000m, water will boil at 900C, at 6000m water boils at about 700C.The decrease of temperature with increasing elevation is periodically interrupted, andtemperature increase with altitude may occur. This is referred to as temperature inversion.Inversion can occur at ground level when associated with radiation cooling or above theground level because of subsidence.AltitudeInversionTemperatureFigure 1. Temperature inversion where warm air is above cooler air at the surface1.3.2. Horizontal distribution of temperatureThe horizontal distribution of global temperature is influenced by two main factors:2
(a) Location factors(b) Dynamic factors1.3.2.1.Locational factorsThese includes(i)Latitude of a place(ii)Surface properties(iii)Aspect and topographyLatitude:This is of prime importance in determining solar energy receipt. The earth-sunrelationship show that both the angle of the sun in the sky and length of day determine solarenergy receipts. These two factors are determined by latitude. More insulation reaches theearth’s surface when the angle of the sun’s rays is 900 than when it is less than 900. The sun’srays pass through a greater thickness of atmosphere to reach the higher latitudes than to reachthe lower latitudes.The highest temperatures on earth are not found at the equator but near the tropic of cancerand Capricorn. This occurrence is explained by the apparent migration of the sun between23.50 N and S. In its passage, the sun seems to move relatively quickly over the equator, butslows down as it progresses north and south. Thus between 60N, and 60S, the sun’s rays arevertical for 30 days, during the time of the equinoxes. Between 17.50 and 23.50 and S, thevertical rays occur for 86 days near the solstice. The longer period of the high sun and theconcurrent longer days allow time for surface heat accumulation and thus give rise to the zoneof maximum heating near the tropics. The heating is further enhanced by the clear skies nearthe tropics compared to the very cloudy equatorial belt.Temperature regimes, especially the seasonal cycles, are also related to earth’s sun motions.The temperature regime at equatorial stations shows few variations, with two maximums atthe period of equinoxes. Stations further north show a distant summer-winter maximum andminimum, with the range generally increasing with latitude.1.3.2.2.Surface propertiesThe solar energy received on the earth surface depends on the type of surface the energy isstriking. Of particular note is the surface reflectivity or albedo. Surfaces with high albedoabsorb less incident radiation, with the result that the total energy available is diminished.3
Thus the polar ice caps are maintained because as much as 80% of the solar radiation fallingon them is reflected.As shown in Table 1, different surfaces have different specific heat capacity. Specific heatcapacity is defined as the amount of heat in calories required to raise the temperature of 1g ofa substance through 10C. For example the specific heat capacity of water is five times greaterthan that of rock and the land surface in general. This means that the amount of heat requiredto raise the temperature of water through 10C is five times greater than that required for thesame temperature increase on land. The same amount of energy applied to land surface wouldresult in the lands becoming much hotter than the water.The difference is also heightened by the difference in heat conductivity of the two materials(Table 1). Loose dry soil is a very poor conductor of heat and only a superficial layer willexperience a rise in temperature following energy input. Water has only affair conductivitybut its general mobility and transparency permit heat to circulate below surface layers. Anatural undisturbed soil with a vegetation cover may have daily temperature changes recordedto 1 metre, while a quiet stand or pool of water has daily temperature variations that can bemeasured to a depth of about 6 metres. When such differences are applied to the global scaleit is evident that land surfaces are rapidly and intensely heated by the sun’s rays whereaswater surfaces are only slowly and moderately heated. Again land surfaces cool off morerapidly and reach much lower temperatures than water surfaces when solar radiation is cut off.Table 1. Thermal properties of air and various surfacesSubstanceHeat capacity(PC Jm 3k 1)Thermal conductivity(K Wm 1k 1Ice1.89 x1062.272Dry sand1.26 x1060.164Wet soil1.68 x1061.681Still water4.2 x1060.63Stirred water4.2 x1062.1x10 4Still air1.26 x103205 x10 2Stirred air1.26 x1031.3 x10 4)4
Temperature contrasts are therefore greater over land areas, but only moderate over waterareas. It is further true that the larger the mass of land, the greater is the seasonal temperaturecontrasts. Because the heating of ground and water surfaces controls heating of theatmosphere above, the same observations apply to air temperature as to surface temperature.1.3.2.3.Aspect and TopographyThe combined influences of steepness and direction faced by a slope determine its aspect. Theimportance of aspect is best seen in differences that occur on north-facing and south- facingslopes in the northern hemisphere. A north-facing slope may still have snow lying on it whilea south-facing slope is quite clear. The north-facing slope gets less intense radiation and, asthe sun gets lower in the sky, it will be in shadow long before the south-facing slope. Theinfluence of aspect is seen in many ways; for example, the height of the level of permanentsnow and ice on mountains will vary from one slope to another, while vegetation levels (e.g.the tree line) will also be affected. Similarly the depth of snow and frost are found to differ onnorth-facing and south-facing slopes.Topography also plays an important role in the nature of climates of neighbouring lowlands.On a continental scale, mountain ranges that run north-south have a different effect from thosethat run east- west. Thus the lack of any extensive east-west barrier in the United Statespermits polar and tropical air to penetrate great distances into the continent. One result of thisunobstructed flow of air is the high incidences of tornadoes in the United States. The reliefalignment of continents also affects the flow of air masses into the interior.1.3.3. Dynamic factorsThe imbalance of energy between the tropics and poles means that an exchange of air mustoccur through a dynamic process. The mechanisms for the exchange involve the transfers oflatent heat (LE), sensible heat (H), and the heat that is stored within the water of the ocean(S).Table 2 provides the theoretical planetary temperature for sea level, assuming the atmosphereis at rest and the observed mean annual temperature for every 100 C of latitude. The greatestdifferences are at the equator and for those latitudes above 600. Tropical latitudes are coolerthan the theoretical value, while high latitudes are warmer. The differences between the actualand theoretical values result from the transport of energy over the globe by air masses andocean currents. Every storm system, circulation pattern and evaporation/precipitation event5
contributes towards the redistribution of temperature regimes that prevail over the earth’ssurface.Table 2: Theoretical Planetary Temperature at sea levelTemperature 00C0 100200300400500600700800Planetary Temperatures33322822143-11-24-32Actual Temperatures26262520145-1-10-18Difference-7-6-3-20 210 14 14Planetary Temperatures33322822143-11-24-32Actual 3 2 8 11 5Northern hemisphereSouthern Hemisphere1.3.4. Global pattern of mean sea-land temperatureThe global distribution of temperature near the earth’s surface shows that in the northernhemisphere winter and southern hemisphere summer, the highest temperatures lie in a beltclose to the equator over the oceans and somewhat south of it over the land masses.Maximum temperatures exceed 300C over portions of these land areas. Minimumtemperatures occur over Polar Regions, with the lowest values below –300C in north centralAsia. There are sharp temperature contrasts between land and sea, particularly on the westernsides of continents where at a given latitude the northern hemisphere land is colder and thesouthern hemisphere land warmer than the adjacent ocean. A similar phenomenon, with thehemispheres reversed occurs in the northern hemisphere summer and southern hemispherewinter. In this season Antarctica is the coldest region and the warmest areas are thosecontinental areas just north of the equator. A close comparison of the conditions in the twoseasons clearly indicates that seasonal changes in ocean surface temperature are relativelyminor, but that mid- latitude continental interiors suffer a much greater range.1.4. EvaporationWater is brought into the air as vapour by evaporation. It is a physical process by whichvapour escapes from any free liquid water surface or wet surface at a temperature below theboiling point of water. In addition to loss by evaporation from soil, water is also lost by6
transpiration from vegetation covering the soil or water surface. This combined loss is knownas evapotranspiration.Water vapour is the principle participant in the many energy exchanges taking place in theatmosphere. The energy exchanges are respon
Physical Geography III is a course that builds on the knowledge gained from the study of Physical Geography I and II. It builds on the knowledge of the atmosphere introduced in Physical Geography I and introd