Transcription
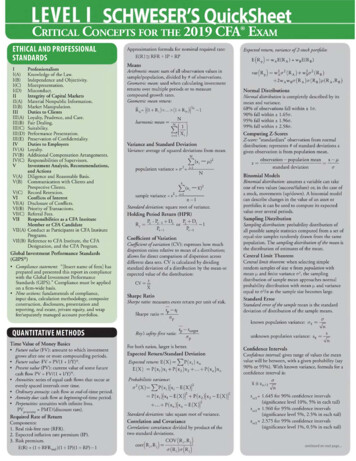
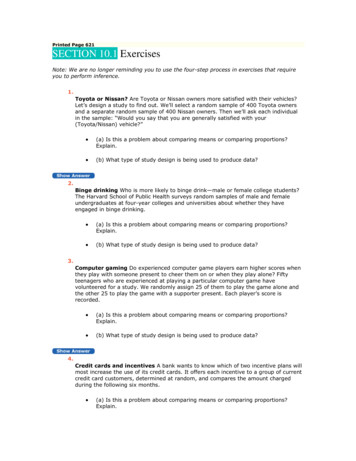
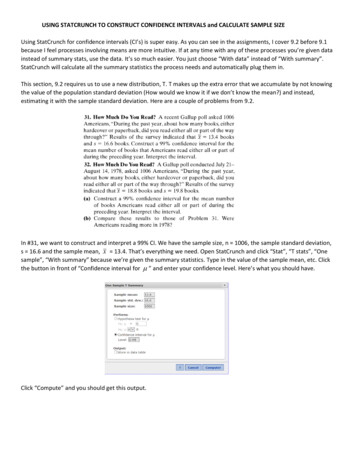
USING STATCRUNCH TO CONSTRUCT CONFIDENCE INTERVALS and CALCULATE SAMPLE SIZEUsing StatCrunch for confidence intervals (CI’s) is super easy. As you can see in the assignments, I cover 9.2 before 9.1because I feel processes involving means are more intuitive. If at any time with any of these processes you’re given datainstead of summary stats, use the data. It’s so much easier. You just choose “With data” instead of “With summary”.StatCrunch will calculate all the summary statistics the process needs and automatically plug them in.This section, 9.2 requires us to use a new distribution, T. T makes up the extra error that we accumulate by not knowingthe value of the population standard deviation (How would we know it if we don’t know the mean?) and instead,estimating it with the sample standard deviation. Here are a couple of problems from 9.2.In #31, we want to construct and interpret a 99% CI. We have the sample size, n 1006, the sample standard deviation,s 16.6 and the sample mean, x 13.4. That’s everything we need. Open StatCrunch and click “Stat”, “T stats”, “Onesample”, “With summary” because we’re given the summary statistics. Type in the value of the sample mean, etc. Clickthe button in front of “Confidence interval for ” and enter your confidence level. Here’s what you should have.Click “Compute” and you should get this output.
The lower and upper bounds of the CI are always on the right side of the output under “L. Limit” and “U. Limit”.Rounding to one decimal place, we have 12.0 to 14.8. To interpret, we say that “We are 99% confident that thepopulation mean ( !) number of books Americans read either all or part of the preceding year is between 12.0 and14.8.” Note that I got this interpretation straight from the problem.Number 32 is the same thing, but the data is from 1978. Note that you’re being asked to find A CI FOR A MEAN.Therefore, T interval. You try, then compare with my answer.This means that “We are (or I am) 99% confident that the population mean number of books Americans read either all orpart of in 1978 is between 17.2 and 20.4.”Part b wants us to compare the two intervals and asks if Americans were reading more books in 1978. If you either graphboth intervals on a number line or position them relative to one another, note that there is no overlap of the two andthe entire interval from 1978 is larger than the entire interval from last year. Therefore, we can conclude that it appearsthat Americans were reading more books in 1978.Also from 9.2, finding sample sizes. StatCrunch has added a feature that makes this a lot easier than it used to be. Ifyou’re following my class notes, that process will work but this is easier.Before a study is done, we would generally set a goal in terms of confidence level and margin of error we’d be willing toaccept, and calculate what sample size will allow us to meet that goal.First of all, note how the problem is worded. “HOW MANY PEOPLE ARE NEEDED ” so they want sample size. The “within2 hours” here is the margin of error (ME or just E) which is half the length of the CI. It indicates that we want our entireinterval to be within 4 total units wide. The ME in the problem will always be given as “within x units ”. Ok, so we have
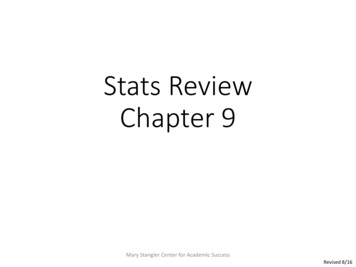
s 7.5, ME 2 and we want 95% confidence. Note that this is a Z procedure because each T distribution is defined by itsdegrees of freedom, which is the sample size minus one and sample size is what we’re looking for! In StatCrunch, click“Stat”, “Z stats”, “One sample”, “Width/sample size”, type in all the relevant stuff and “Compute”. It’s really importanthere to remember that StatCrunch wants the ENTIRE LENGTH of the interval, not just the ME so you must DOUBLE theME.Here’s what the output looks like.Note that you can drag the red dot on the graph and see how the width of the CI affects the sample size. Kind of fun! Seehow the width you entered (4) is now 3.964 ? It means that at n 55, you will get an interval under 4 total units wide.Go back to StatCrunch and change the sample size from 55 to 54. It’ll show that you will be over your 4 unit goal if youreduce the sample size.In part b, check out what happens when you halve the ME, thus halving the entire interval length.It approximately quadruples the sample size needed! In part d, what happens if we leave our ME at 2 but decrease theconfidence level to 90%?
We would only need to sample 39 people. Less confidence, smaller sample size needed. There’s only one thing a personcan do to both have a high level of confidence AND a small-ish margin of error and that’s increase the sample size.Section 9.1. Note that you don’t see anything about means, averages, standard deviations in these problems. What youdo see is either a percent or n people/items sampled with x people/items in the sample meeting a criteria.Here, we have 3611 adult Americans sampled and 542 have used their smartphone to make a purchase (the criteria).Therefore, x 542 and n 3611.In part a, we want a point estimate. In this case, the point estimate is the value of p̂ which is x/n 542/3611, about0.15.I’m not going to do part b, but all it wants is for us to verify that the assumptions, or criteria for the process are met.That would be that np(1-p) is at least 10 and that the sample size, n is less than 5% of the population size, N. These twoassumptions ensure that our sample is random and independent.Part c is asking for a confidence interval. This is ridiculously easy. “Stat”, “Proportion stats”, “One sample”, “Withsummary”. All you have to do is type in the x and n, click in front of “Confidence interval for p”, be sure to include thecorrect confidence level and “Compute” like this.
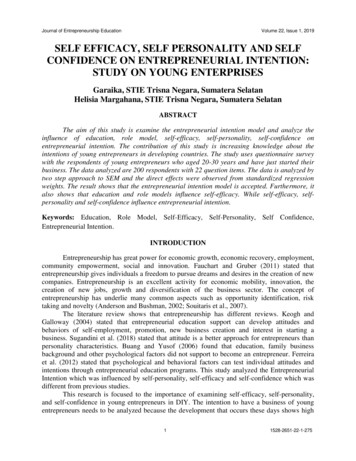
Your output should look like this.Again, the limits of the CI are on the right in the output and in this case, 0.14 to 0.16. You should get decimals, sinceproportions/percentages are numbers between 0 and 1. Interpret: “We are 90% confident that the populationproportion of adult Americans 18 and older who have used their smartphone to make a purchase is between 0.14 and0.16”. Or you can say “ between 14% and 16%”. Same thing.Again in 9.1, we want to find the sample size needed to estimate a proportion. Note the problem reads “ estimate theproportion ” and “What sample size should be obtained ”. Thus, sample size to estimate a proportion. There are twopossibilities. From the CI formula, if you set the margin of error part equal to E and solve it for n, the formula includes p̂which we’d need the sample size, n to calculate! And n is the thing we’re looking to find! There are two ways of dealingwith this. First, there are many times when estimations are updated to reflect the current population. When thishappens, it’s okay to use the p̂ from that prior study. In part a below, there was a study in 2010 that found p̂ to be0.53 which we can use. In StatCrunch, it’s called the “Target proportion”. Note that the ME is “3 percentage points” or3% or 0.03. Again, you’ll need to double that for StatCrunch to a width of 0.06.Go to “Stat”, “Proportion stats”, “One sample”, “Width/Sample size”. After typing in the confidence level of 95%, thewidth and p̂ estimate, you should have this.
And the sample size needed to meet the criteria in the problem is 1064 Americans.Part b is similar, except we assume we have no prior estimate of p̂ . When this happens, we have to assume the worstcase scenario and max out the value of p̂ , which happens to be 0.5. Therefore, the target proportion when we have noprior estimate of p̂ is 0.5. You use the same tool in StatCrunch that you did for part a. Here’s what you should get. Notethat the sample size, at 1068 is only four more than if you have a prior estimate. That’s because the prior estimate, 0.53is so close to the max of 0.5 which is the answer to part c.The last example I have for you is from 9.3, estimating a population standard deviation. This is a little tricky. You need toremember that the variance and the standard deviation are both measures of variability and that the variance is thesquare of the standard deviation. The standard deviation then, is the principle square root of the variance. The tool forthis process in StatCrunch is inference for a VARIANCE, not standard deviation (which is common) so if the question asksyou for a CI for a variance, what you get from StatCrunch is exactly what you need. If you’re asked to find a CI for astandard deviation, you’ll need to take the square root of the lower and upper bounds. Here’s an example.
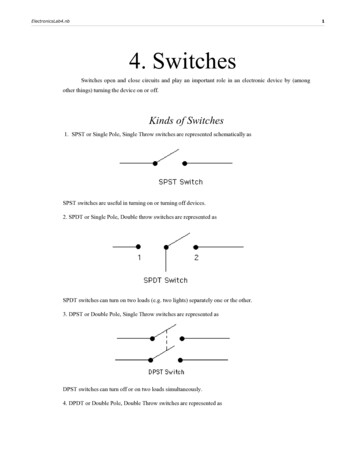
I think all the problems in this section of the textbook give data, not summary stats. But we’ll work off of the summarystats here. As usual, if you’re given data in your problem, it’s much easier to just use the data.Note that the sample size is n 10, the sample standard deviation is s 2.343 and the confidence level is 95%. Becausewe’ll use inference for a variance, we first square the standard deviation, so the sample variance is s2 5.489649. I’musing all of the decimal places because you don’t want to keep rounding and using rounded numbers over and over.Your answer will be off. Go to “Stat”, “Variance stats”, “One sample”, “With summary”. Type in your sample statistics,click the button in front of “Confidence interval for 2 ” and be sure to include the correct confidence level. You shouldhave this.When you “Compute”, you get this. Note that it says right on the output, “ 2 : Variance of population”. That means that“We are 95% confident that the population variance price of a 4 GB flash memory card is between 2.60 and 18.30”.But that’s not what we’re asked to find.To get the CI for a population standard deviation, we take the square root of both the upper and lower bounds. Again,be careful not to round too much yet. 2.59724 1.61159. and18.29619 4.27740. NOW we round and can say
that “We are 95% confident that the population standard deviation price of a 4 GB flash memory card is between 1.61and 4.28”.
I think all the problems in this section of the textbook give data, not summary stats. But we’ll work off of the summary stats here. As usual, if you’re given data in your problem, it’s much easier to just use the data. Note that the sample size is n 10, the sample standard deviat