Transcription
The Pharma Innovation Journal 2017; 6(7): 380-386ISSN (E): 2277- 7695ISSN (P): 2349-8242NAAS Rating 2017: 5.03TPI 2017; 6(7): 380-386 2017 TPIwww.thepharmajournal.comReceived: 13-05-2017Accepted: 14-06-2017Sadaf AleemWarner School of Food andDairy Technology SamHigginbottom University ofAgriculture Technology andScience, Allahabad, IndiaPW RamtekeWarner School of Food andDairy Technology SamHigginbottom University ofAgriculture Technology andScience, Allahabad, IndiaSensory and Nutritional study of locally available freshand processed Fruit and Vegetable juices in AllahabadCitySadaf Aleem and PW RamtekeAbstractFresh fruit and vegetable juice samples (169) and processed fruit juices (11), viz, (71 samples of sweetlime, 40 samples of sugarcane juice, 25 mango juice samples, 22 mixed vegetable juices and 11pineapple juice samples) were collected during the practical analysis from different carts and shops indifferent areas of Allahabad city. Under processed fruit juices, readily available packed samples soldunder different brand names were also analysed for their sensory attributes physiochemical propertiesand microbial load. The juices were extracted either by manual juicer or electric juicer with minimalhygienic precautions. On analyzing the sensory evaluation of fruit juices it was found that Sweet lime,Sugar cane and Mango has the highest overall acceptability (8.00) whereas mixed vegetable juice showedthe lowest value (6.33) overall acceptability in processed fruit juice sample showed that apple juice(9.00) scored highest and orange juice scored lowest value for two different brands (7.00). on analyzingthe physico chemical properties of fruit juices it was observed that the highest mean percentage ofmoisture recorded for sugarcane juice was(90.53) which was closely followed by mixed vegetable juice(90.37). Mean TSS observed was highest in sugarcane juice (19.83) which was followed by pineapplejuice (13.94) and mango juice (3.80). Titrable acidity recorded was highest in pineapple juice (1.39) andlowest in sweet lime (0.47). Mean pH recorded was highest in mixed vegetable (6.03) and the lowest inmango juice (3.84). Total sugar observed to be more in sweet lime (12.86) and mixed vegetable (12.80)and lowest in pineapple (8.89). The highest mean value for reducing sugar was recorded for pineapplejuice (8.27) and lowest in sugarcane juice (3.00). Vitamin C was found to be highest in sweets lime(49.53) and lowest in sugarcane juice (1.26mg/100gm).Keywords: Sensory attributes, physio-chemical parameters, Sweet lime, sugarcane juice, mango juice,mixed vegetable juices and pineapple juiceCorrespondenceSadaf AleemWarner School of Food andDairy Technology SamHigginbottom University ofAgriculture Technology andScience, Allahabad, India1. IntroductionCodex Alimentarius defines juice as―the fermentable but unfermented juice, intended fordirect consumption, obtained by the mechanical process from sound, ripe fruits, preservedexclusively by physical means (FAO, 2005) [3]. The juice must have the characteristic colour,flavour and taste typical of the fruit from which it comes. Fruit and vegetable juices are wellrecognized for their nutritive value, mineral and vitamin content that are essential for humanbeing and play important role in the prevention of heart diseases, cancer, and diabetes. Due totheir potential nutritional and biological importance fruit juices are foods with multipleimplications for body balance (DHFS, 1998). Consumption of fresh juices increaseddramatically due to their freshness, high vitamin content, and low caloric consumptionRathnayaka et al., (2013) [13]. The high potassium and low sodium characteristic of most juiceshelp in maintaining a healthy blood pressure. Vitamin C is naturally present in juices whichare essential for the body to form collagen, cartilage, muscle, and blood vessels. It also helpsin the absorption of iron, International Federation of Fruit Juice Producers Union (2011).Raw fruit juices are among the street foods that are vended in urban areas mostly in developingcountries. They are prepared by low income vendors who have poor premises and facilitiesand lack basic needs such as portable water. Water for street food preparation is not enoughresulting in vendors using little water for washing utensils hence hygiene is compromised(Mensah et al., 2002; Muinde and Curia, 2005) [14, 15]. In spite of the potential benefits offeredby street fruit juices, concerns over their safety and quality have been raised. The criticalfactors affecting the spoilage of juices include juice pH, oxidation reduction potential, wateractivity, availability of nutrients, presence of antimicrobial compounds, and competingmicroflora. Among these factors, pH and water activity are the most influential factorsaffecting the spoilage of juices. 380
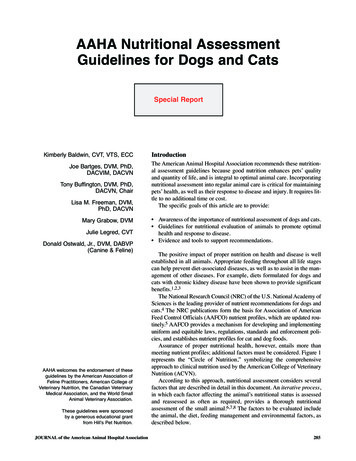
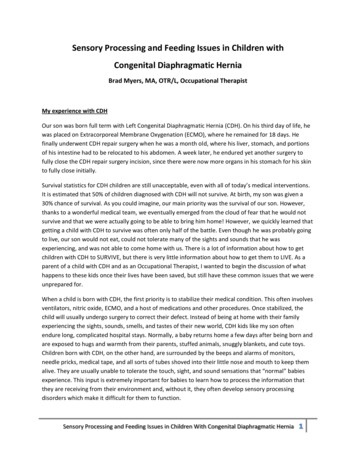
The Pharma Innovation JournalThe spoilage caused by microorganisms in juices includescloud loss, development of off-flavours, CO2 production, andchanges in colour, texture, and appearance resulting indegradation of product, Lawlor et al. (2009) [16] andSaspendra et al., (2012) [17].In developing countries like India, where street food vendingis very common, there is lack of information on the incidenceof food borne illnesses. On the other hand the quality of fruitjuices is strictly maintained in developed countries underseveral laws and regulations but in many developing andunderdeveloped countries, the manufacturer are not concernedabout the microbiological safety and hygiene of fruit juicesbecause of lack of enforcement of the law. Thus thetransmission of certain human diseases through juice andother drinks in recent years is a serious problem. One of theaim of this present investigation is to assess the sensoryattributes of freshly available fruit and vegetable juices, theirphysico chemical qualities and their comparison with theprocessed juices sold under different brand names.Materials and MethodsThe laboratory work of this study entitled “Sensory andnutritional study of locally available fresh fruit and vegetablejuices in Allahabad city” was carried out in the researchlaboratory of the Department of Food Science and DairyTechnology, SHIATS, Allahabad. A total of 169 fresh fruitand vegetable juice sample and 11 processed fruit juicesamples were collected from various shops and carts ofAllahabad city. The juices collected included sweet lime (71samples), sugar cane (40 samples), mango (25 samples),mixed vegetable (22 samples) and pineapple (11 samples).Under processed fruit juices, readily available packed samplessold under different brand names were analyzed for theirphysicochemical properties and microbial load. Fresh fruitand vegetable juices which are sold all over our country canalso be seen in the city of Allahabad. For the present studyheavily crowded carts and shop were randomly selected. Sixlocation viz, three carts (College campus, Khan Chouraha andGaughat) and three shops (Meerapur, Kareli and NoorullahRoad) were chosen for the study. These carts and shops haveon site facility for extraction of juices. Being easily accessibleand cost effective large crowds are drawn particularly duringthe summer season. The sample of fresh fruit and vegetablejuice and processed fruit juice was evaluated for their Color,Taste, Flavor, Aroma, Appearance and Overall acceptability.The sample were evaluated and tasted by a panel of judgesusing 9- point hedonic scale. The sensory evaluation wasquantified using a sensory evaluation card in which the gradesof different samples for different properties were awarded bythe panel of judges. Score between 1-9 as per liking 9-Likedvery much, 4- Slightly disliked, 8 -Liked much, 3- Dislikedmoderately, 7 -Liked moderately, 2- Disliked much, 6Slightly liked, 1- Disliked very much, 5- Neither like nordisliked. The sample of fresh fruit and vegetable juice andprocessed fruit juice was analysed for physico-chemicalproperties to determine the Moisture, Total soluble solid,Tritable acidity, pH, Total sugar, Reducing sugar and VitaminC (mg/100) content present in the juices. The data recordedduring the course of experimental investigation weresubjected to statistical analysis of “Analysis of variance”technique (Fisher and Yates, 1967) for drawing conclusion.The significance and non-significance of the treatments werejudged with the help of ‘F’ (Variance ratio) test the significantdifferences between the means were tested with the criticaldifferences at 5% probability level.Results and DiscussionOrganoleptic evaluation of different types of fresh fruitand vegetable juicesIt can be observed from the table 1 and Fig. 1 that the averagecolour score of different types of fresh fruit and vegetablejuices viz., Sweet lime (S1), Sugar cane (S2), Mango (S3),Mixed Vegetable (S4) and Pineapple (S5) were 8.00, 7.22,7.78, 7.00 and 8.67 respectively. The highest average colourscore was observed in Pineapple (S5) juice (8.67). The averagetaste score of different types of fresh fruit and vegetable juicesviz., Sweet lime (S1), Sugar cane (S2), Mango (S3), MixedVegetable (S4) and Pineapple (S5) were (8.00), (8.33), (8.00),(7.00) and (7.56) respectively. Mixed blend juice beveragesare gaining popularity to satisfy consumer taste andpreferences (Jan and Masih, 2012). The highest average tastescore was observed in Sugar cane (S2) (8.33). Taste isdetermined mainly by organic acid–sugar content balance ofthe fruit, and these compounds serve as unequivocal markersforsensory attributesassessmentandgenotypecharacterization (Melgarejo et al., 2000; Poyrazoglu et al.,2002) [10, 11]. The average flavour score of different types offresh fruit and vegetable juices viz., Sweet lime (S1), Sugarcane (S2), Mango (S3), Mixed Vegetable (S4) and Pineapple(S5) were (8.00), (7.00), (9.00), (6.00) and (8.00)respectively.The highest average flavour score was observed in Mango(S3) (9.00). The average aroma score of different types offresh fruit and vegetable juices viz., Sweet lime (S1), Sugarcane (S2), Mango (S3), Mixed Vegetable (S4) and Pineapple(S5) were (7.67), (8.67), (7.33), (7.67) and (7.33) respectively.The highest average aroma score was observed in sugar cane(S2) (8.67). The average appearance score of different types offresh fruit and vegetable juices viz., Sweet lime (S1), Sugarcane (S2), Mango (S3), Mixed Vegetable (S4) and Pineapple(S5) were (8.00), (7.33), (8.67), (7.00) and (8.67) respectively.The highest average appearance score was observed in Mango(S3) and Pineapple (S5) (8.67). The average overallacceptability score of different types of fresh fruit andvegetable juices viz., Sweet lime (S1), Sugar cane (S2), Mango(S3), Mixed Vegetable (S4) and Pineapple (S5) were (8.00),(8.00), (8.00), (7.33) and (7.67) respectively. The highestaverage overall acceptability score was observed in Sweetlime (S1), Sugar cane (S2) and Mango (S3) (8.00). Sensoryscores for colour is in close agreement with the report ofNdife et al., (2013). Data for average colour, taste, flavour,aroma, appearance and overall score of different types offresh fruit and vegetable juices were statistically analyzed tofind out significant difference between samples. 9 – pointhedonic scale reported by Banigo et al., (2015). 381
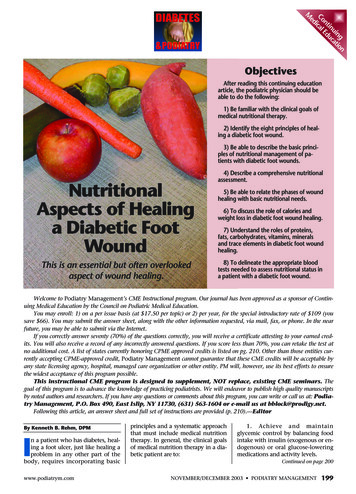
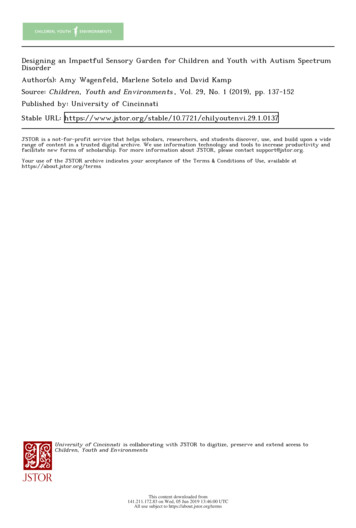
The Pharma Innovation JournalTable 1: Sensory evaluation of fresh fruit and vegetable juiceTypes of juicesSweet lime (S1)Sugar cane (S2)Mango (S3)Mixed Vegetable(S4)Pineapple (S5)F-testC.D. at 0.05%SEd ( )No. 4050.609Fig 1: Average sensory evaluation of different types of fruit juices samplesOrganoleptic evaluation of different types of processedfruit juice samplesIt can be observed from the table 2 and Fig. 2 that the averagecolour score of different types of processed fruit juice samplesviz., The highest average colour score was observed in S7T11(Mixed fruit juice) (9.00). The highest average Taste scorewas observed in S1T1 (apple Juice) S1T4 (Mango juice), S1T5(Pineapple juice) and S1T10 (Apple) (8.33). The highestaverage flavour score was observed in S1T1 (apple Juice),S1T2 (Mango Juice), S1T7 (Pineapple juice) and S7T11 (Mixedfruit) (8.00). The highest average Aroma score was observedin S1T2 (Mango Juice) and S1T10 (Apple) (8.00). The highestaverage appearance score was observed in S1T1 (apple Juice),S1T4 (Mango juice) and S7T11 (Mixed fruit) (8.00). Thehighest average overall acceptability score was observed inS1T6 (apple juice) (9.00). Data for average Colour, Taste,Flavour, Aroma, Appearance and Overall score of differenttypes of processed fruit juice samples were statisticallyanalyzed to find out significant difference between samples.Sensory scores for colour is in close agreement with the reportof Ndife et al., (2013).Table 2: Sensory evaluation of different types of processed fruit juice samplesSampleColourTasteFlavourAromaAppearanceS1T1 (apple Juice)S1T2 (Mango Juice)S1T3 (Orange juice)S1T4 (Mango juice)S1T5 (Pineapple juice)S1T6 (apple juice)S1T7 (Pineapple juice)S1T8 (Mixed fruit)S1T9 (Orange)S1T10 (Apple)S7T11 (Mixed fruit)F-testC.D. at 0.05%SEd ( .678.00S0.830.83 382 677.008.338.00S1.530.73
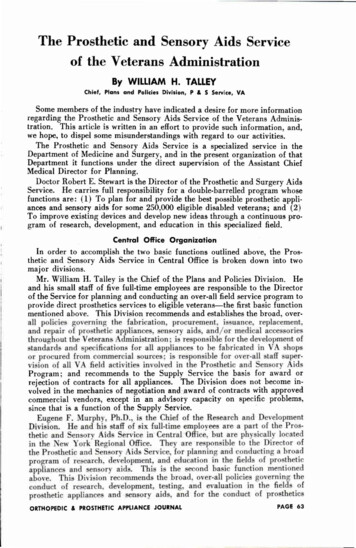
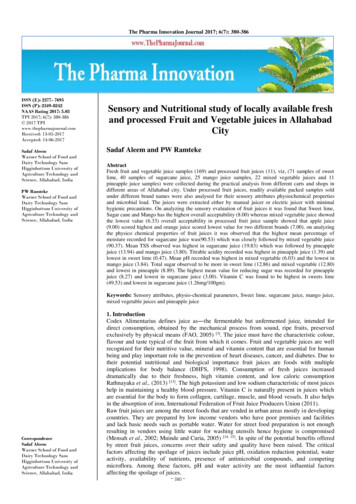
The Pharma Innovation JournalFig 2: Average sensory evaluation of different types of fruit juices samplesPhysico chemical properties of fruit and vegetable juiceslocally available in Allahabad cityIt can be observed from the table 3 and Fig. 3 that the averagemoisture content percentage of different types of fresh fruitand vegetable juices. In citrus juices, brix is used to indicatethe percentage of soluble sugars and is one of the mostimportant factors for grading the quality of a citrus juice(McAllister, 1980) [1]. Generally, pH and titratable acidity ofjuices are used primarily to estimate consumption quality.They could be considered as indicators of fruit maturity orripeness. The pH has influence on the flavour (sweet or sour)of the fruit and to a large extent determines the marketablequality of the fruit juices. The highest average moisturecontent percentage was observed in Sugar cane (40) (90.535).The highest average and TSS percentage was observed inSugar cane (40) (19.837). According to FAO (2005) [3], thejuices containing more than 1.2% acid are sour, independentof Brix/Acid (Bates et al., 2001) [4, 7]. ºBrix indicates thepercentage of water-soluble solids in fruit juice and can beaffected by many factors: cultivar, growth region, growth yearand maturity level of the fruit (Türkmen and Ekşi, 2011) [6].The highest average titrable acidity percentage was observedin Pine apple (11) (1.398). The highest average pH percentagewas observed in Mixed vegetable (22) (6.03) which werewithin the range of 3 to 5 for fruit and vegetable juices (Harrisand Silcocks, 1991) [8]. Brix to acid ratio is crucial since itconstitutes a measure of the balance between sugars and acidsas well as serves as an indication of the palatability of thejuice.Large values indicate a sweeter taste, but very highvalues may be indicative of an insipid tasting juice (FAO,2006) [12]. The highest average total sugar percentage wasobserved in Sweet lime (71) (12.861). Čolarić et al. (2005) [5]suggested that analytical measurements of titratable acids andsoluble solids could not be substituted for sensory evaluationof perceived sweetness and sourness. For instance, acidity (orsourness) could be an interesting trait for several purposes(blending juice of other fruits forexample) (Hasnaoui et al.,2010) [9]. The highest average reducing sugar percentage wasobserved in Pine apple (11) (8.277). The highest averagevitamin (c) (mg/100g) percentage was observed in Sweet lime(71) (49.539). Data for average physio-chemical properties ofdifferent types of fresh fruit juices and vegetable werestatistically analyzed to find out significant differencebetween sample with regard to the physio-chemical propertiesin different types of fresh fruit and vegetable juices.Table 3: Physico chemical properties of fruits and vegetables juice locally available in Allahabad cityTypes of juicesSweet lime (S1)Sugar cane (S2)Mango (S3)Mixed vegetable (S4)Pine apple (S5)F-testC.D. at 0.05%SEd ( )No. ofsamplesMoisturecontent 60Totalsolublesolid idity 3.846.034.081S0.0530.023 383 086Reducingsugar (%)Vitamin 391.26516.46131.49423.958S0.470.20
The Pharma Innovation JournalFig 3: Physico-chemical properties of fruits and vegetables juice locally available in Allahabad cityPhysico chemical properties of processed fruit juiceslocally available in Allahabad cityIt can be observed from the table 4 and Fig. 4 that the averagemoisture content percentage of different types of processedfruit juice samples the highest average moisture contentpercentage was observed in S1T9 (Orange) (90.69). Thehighest average total soluble solids was observed in S1T8(Mixed fruit) (14.69). The highest average titrable acidity wasobserved in S1T5 (Pineapple juice) (1.48). The highest averagepH was observed in S1T2 (Mango Juice) (4.62). The highestaverage total sugar was observed in S7T11 (Mixed fruit)(14.33). The highest average reducing sugar was observed inS1T9 (Orange) (10.68). The highest average vitamin (c)(mg/100g) was observed in S1T9 (Orange) (40.41). The highcontent of total solids in the orange juice is attributed to thehigh fibre as reported by Gelroth and Ranhotra (2001) [2].Table 4: Physico chemical properties of processed fruit juices locally available in Allahabad city.SampleS1T1 (apple Juice)S1T2 (Mango Juice)S1T3 (Orange juice)S1T4 (Mango juice)S1T5 (Pineapple juice)S1T6 (apple juice)S1T7 (Pineapple juice)S1T8 (Mixed fruit)S1T9 (Orange)S1T10 (Apple)S7T11 (Mixed fruit)F-testC.D. at 0.05%SEd ( 489.7390.6988.1790.23S0.840.40Total 1.240.611.480.370.450.310.210.290.80S0.150.71 384 2.5813.7012.3214.33S0.1810.086Reducing 8.147.8328.7332.6140.419.8535.34S0.3710.178
The Pharma Innovation JournalFig 4: Physico chemical properties of processed fruit juices locally available in Allahabad cityConclusionThe sensory investigation and physio-chemical analysis ofdifferent fresh fruit juices sold locally as well as processedtetra packed juices shows significance differences among thesensory parameter and different physio-chemical parameters.The physicochemical properties are the fundamentalcharacteristics in food processing and should be well retained.Overall acceptability among fresh fruit juice was seen highestin sweet lime, sugar cane and mongo juice, whereas amongprocessed fruit juice, apple juice showed the highest score.When analyzing the moisture content & TSS, sugar cane juicerecorded the highest values. Pineapple juice recorded thehighest titrable acidity and reducing sugar percentage whereastotal sugar and vitamin C was found to be highest in sweetlime juice. Fruits and vegetable juices are packed withnutrients, if consumed in recommended amount could preventus from major health diseases. Fresh fruit and vegetable juicesare easily available during summer season by road sidevendors.6.7.8.9.10.11.References1. McAllister JW. Methods for determining the quality ofcitrus juice.In: Nagy S, Attaway JA (Eds.), Citrus12.nutrition and quality Washington D.C: AmericanChemical Society, 1980, 237-254.2. Gelroth J, Ranhotra GS. Food uses of fiber. In: Cho S,Dreher M., eds. Handbook of dietary fiber. New York:13.Marcel Dekker, Inc. New York, NY, USA, 2001, 435480.3. FAO. General standard for fruit juices and nectars; tarius.org/./standards/./CXS 247].14.4. Bates RP, Morris JR, Crandall PG. Principles andpractices of small and medium -processing. FAOAgricultural Services Bulletin. 2001; 146:93-99.5. Čolarić M, Veberič R, Štampar F, Hudina M. Evaluationof peach and nectarine fruit quality and correlations15.between sensory and chemical attributes. Journal of the 385 Science of Food and Agriculture, 2005; 85:2611-2616.Türkmen İ, Ekşi A. Brix degree and sorbitol/xylitol levelof authentic pomegranate (Punica granatum) juice. FoodChemistry. 2011; 127:1404-1407.Bates RP, Morris JR, Crandall PG. Principles andpractices of small and medium -processing. FAOAgricultural Services Bulletin. 2001; 146:93-99.Harris A, Key J, Silcocks B. Dietary carotene.3rd ed.Prentice Hall Press, NY. 1991, 63-68.Hasnaoui N, Mars M, Ghaffari S, Trifi M, Melgarejo P,Hernandez F. Seed and juice characterization ofpomegranate fruits grown in Tunisia: Comparisonbetween sour and sweet cultivars revealed interestingproperties for prospective industrial applications.Industrial Crops and Products. 2010; 33:374-381.Melgarejo P, Salazar DM, Artés F. Organic acids andsugars composition ofharvested pomegranate fruits. Eur.Food Res. Technol. 2000; 211:185-190.Poyrazoglu E, Gökmen V, Artuk N. Organic acids andphenolic compounds in pomegranates (Punica granatumL.) grown in Turkey. Journal of Food Composition andAnalysis. 2002; 15:567-575.FAO. Citrus Fruit: Fresh and Processed Annual v/SP2UserFiles/Place/00000000/opmp/Citrus Greening61017.pdf.Rathnayaka RMUSK. Antibacterial effect of malic acidagainst Listeria monocytogenes, Salmonella enteritidisand Escherichia coli in Mango, Pineapple and Papayajuices, American Journal of Food Technology. 2013;8(1):74-82.Mensah P, Yeboah-Manu D, Owusu- Darko K, AblordeyA. Street foods in Accra, Ghana: how safe are they?Bulletin of the World Health Organization. TheInternational Journal of Public Health. 2002; 80(7):546 –553.Muinde OK, Kuria E. Hygienic and sanitary practices ofvendors of street foods in Nairobi, Kenya. African
The Pharma Innovation JournalJournal of Food, Agriculture, Nutrition and Development.2005; 5(1):1-13.16. Lawlor KA, Schuman JD, Simpson PG, Taormina PJ.Microbiological spoilage of Beverages. In W.H. Sperber,and M.P. Doyle (Eds.), Compendium of theMicrobiological Spoilage of Foods and Beverages, FoodMicrobiology and Food Safety, Springer science andBusiness media, New York, USA, 2009.17. Sospedra J, Rubert JM, Soriano, Mañes J. Incidence ofmicroorganisms from fresh orange juice processed bysqueezing machines, Food Control, 2012, 282-285. 386
Organoleptic evaluation of different types of fresh fruit and vegetable juices It can be observed from the table 1 and Fig. 1 that the average colour score of different types of fresh fruit and vegetable juices viz., Sweet lime (S 1), Sugar cane (S 2), Mango (S 3), Mixed Vege