Transcription
September 2012EB 2012-10Quantitative and Qualitative Measures ofFruit and Vegetable Production in theGenesee ValleyKristen S. ParkCharles H. Dyson School of Applied Economics and ManagementCollege of Agriculture and Life SciencesCornell UniversityIthaca, New York 14853-7801Funded by the Genesee Valley Regional Market Authority and the New York State Departmentof Agriculture and MarketsSponsored by Cornell Cooperative Extension of Wayne County1
It is the policy of Cornell University actively to support equality ofeducational and employment opportunity.No person shall be deniedadmission to any educational program or activity or be denied employmenton the basis of any legally prohibited discrimination involving, but not limitedto, such factors as race, color, creed, religion, national or ethnic origin, sex,age or handicap.The University is committed to the maintenance ofaffirmative action programs which will assure the continuation of suchequality of opportunity.2
AcknowledgementsThis project was funded by the Genesee Valley Regional Market Authority and the NewYork State Department of Agriculture and Markets, and without their support, this project wouldnot have occurred. Also, thank you goes to Cornell Cooperative Extension of Wayne Countywhich sponsored and administered the project.Acknowledgements to the GVRMA (Genesee Valley Regional Market Authority) projectwork team and grower interviewers:A special thank you goes to Elizabeth Claypoole, Executive Director at CornellCooperative Extension of Wayne County, who initiated this project and designed the frameworkof questions that the project needed to address. She ensured that the project was designed to meetthe needs of the region. In addition, the GVRMA project work team and interviewers contributedtheir insight and vision to the project. They provided answers to questions, critical feedback tosurvey design, and contacts with growers during the course of the project, W. Averell Bauder,Elizabeth Bihn, Diane Eggert , Louie Freeman, Mark Giles, Robert Hadad, DanielleHautaniemi, Craig Kahlke , Julie Kikkert, Nicole Landers, Beverly Mancuso, ElizabethNewbold, Jim Ochterski , Patricia Pavelsky, Lawrence Riegel, Roberta Severson, David Thorpe,Shawn Tiede, Thomas Tomsa Jr., Robin Travis, and Hans Walter-Petersoni
Table of ContentsIntroduction.1National Fruit and Vegetable Trends .1The Genesee Valley Study Region .4Demographics .4Agricultural Demographics .4Land Cover.5Fruit and Vegetable Production Capacity .9Fruit and Vegetable Producer Survey .14Method.14Respondents’ Production, Markets, and Regional Sales .17Fruit Production .17Vegetable Production .18Market Channels .19Direct to Consumer .21Regional Sales .23Production Outlook .25Greatest Challenges for Produce Enterprises .29Project Summary.34References.38Appendix.40ii
List of TablesTable 1.Change in Fruit and Vegetable Processing Establishments and Value ofShipments, 2002 to 2007.3Table 2.Estimates of All U. S. Retail Sales of Fresh Fruits and Vegetables .3Table 3.Changes in Retail Sales of Processed Fruits and Vegetables .3Table 4.2006 Agriculture Land Cover in the Genesee Valley Region .5Table 5.Changes in Agriculture Land Cover in the Genesee Valley Region,1996 – 2006.7Table 6.Estimated Production of Fruits and Vegetables in the Genesee Valley Region .9Table 7.Estimated Consumption and Production of Total Fruits and Vegetablesin the Genesee Valley Region .10Table 8.Estimated Regional Fruit Production as a Percent of Regional Consumption .11Table 9.Estimated Regional Vegetable Production as a Percent ofRegional Consumption.12Table 10.Farms and Production Acreage Represented by Survey Respondents .15Table 11.Additional Farm Activities Conducted by Respondents .16Table 12.Number of Respondents by County in Region .16Table 13.Fruit and Vegetable Sales Receipts of Respondents .16Table 14.Annual Fruit Production from Survey Respondents .17Table 15.Annual Vegetable Production from Survey Respondents .18Table 16Respondents’ Direct Marketing Volumes and Percent of Estimated RegionalConsumption .22Table 17.Percent of Direct Sales through Various Direct Marketing Channels .23Table 18.Plans to Manage Production Increases .28Table 19.Plans to Manage Production Decreases .29Table 20.Greatest Business Challenges .29Table 21.Business Challenges – Selected Responses and Comments .32iii
List of FiguresFigure 1.Estimates of Per Capita Fruit and Vegetable Consumption.2Figure 2.Land Cover in the Genesee Valley Region, New York, 2006 .6Figure 3.Changes in Agricultural Land Cover in the Genesee Valley Region, New York,1996 – 2006.8Figure 4.Sales Distribution by Market Channel – Fruit .19Figure 5.Sales Distribution by Market Channel – Vegetables .21Figure 6.Percent of Sales to Customer within Region – Fruit.24Figure 7.Percent of Sales to Customers within Region – Vegetables .25Figure 8.Projected Changes in Production by 2015 – Fruit .26Figure 9.Projected Changes in Production by 2015 – Vegetables .27Figure 10.Greatest Challenges – Availability of Labor, by Annual Sales and Farm Type .30Figure 11.Greatest Challenges – Labor Regulations, Respondent Comments.31iv
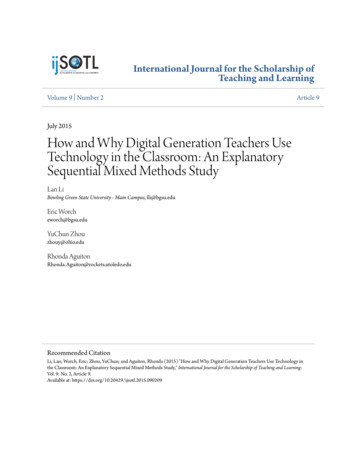
IntroductionAgriculture is a vibrant part of New York state’s economy and is especially so in theGenesee Valley region in Western New York. This study covers a nine-county region called theGenesee Valley region comprised of Genesee, Livingston, Monroe, Ontario, Orleans, Steuben,Wayne, Wyoming, and Yates counties. Several economic factors are having an impact onagriculture in the region. Two large yogurt processing plants are opening in the region. Inaddition, Bonduelle, a large, international vegetable processor, has purchased two existingvegetable processing plants and one vegetable packaging plant from Allen’s, Inc., whileChamplain Valley Specialty, a fresh-cut apple processor from eastern New York, has expandedits operations to include an additional fresh-cut plant in Oswego County, not far from the largestapple-growing county in the state, Wayne County.These separate infusions of agribusiness capital have created excitement in theproduction community and also some uncertainty. The new business partners have the potentialto reshape production decisions. Will milk needed for yogurt production expand dairy needs andforce out land formerly used for vegetable production? Will the new vegetable processor besuccessful in this, their first U. S. venture, and provide stable demand and contracts for processedvegetable growers?In addition, an explosion in the number of new farmers’ markets, has created a demandfor farmer vendors, but sometimes finding farmers able and willing to staff these new farmers’markets has not been easy. Cost accounting data from fruit and vegetable direct marketers usingvarious direct marketing channels suggest that farmers’ markets may be less profitable than otherdirect marketing channels such as Community Supported Agriculture (CSAs), farm stores, andfarm stands (LeRoux, M. N., et al., 2009).This report will present information about production capacity and production flows inand out of the region. It will provide useful information for discussions with agriculturaleconomic development in the region. Data were obtained from a producer survey as well asindustry member interviews, U. S. Census, U. S. Department of Agriculture, and additionalsecondary resources.National Fruit and Vegetable TrendsFor more than ten years total U.S. fruit and vegetable consumption, fresh and processed,has declined. Most of the decline has occurred in the consumption of processed products,particularly fruit juices and canned and frozen vegetables (Figure 1). This has occurred despiterecommendations from various nutritionists, medical professionals, health care professionals,and federal and state agencies to increase overall consumption of fruits and vegetables. Thedecline in consumption is leading to market challenges for growers, processors, and retailers offruits and vegetables.Almost all of the decline in per capita fruit consumption can be attributed to a decline injuice consumption since the late 1990s, and more specifically a decline in orange juiceconsumption. Orange juice consumption, measure as fresh weight equivalent at the farm level,dropped almost 30 pounds since the late 1990s. Apple juice, on the other hand, has increasedsince the late 1990s. Slight declines in per capita consumption of canned and dried fruits since1989 have been observed.1
Trends in vegetable consumption per capita have taken a number of twists and turnsduring the last two decades. Since the mid-1990s, processed vegetable consumption declined. Inparticular, canned vegetable per capita utilization dropped roughly 10% by 2009 from recordhighs in the early 1990s. However, it is now at levels roughly equal to consumption during the1970s-1980s. The changes in canned vegetable use were largely driven by shifts in cannedtomato purchases that represent about 70% of canned vegetable consumption. Frozen vegetableconsumption jumped roughly 15% from 1989 to 1999 and dropped slightly since then through2009. Frozen potatoes represent roughly 70% of frozen consumption.Declining per capita consumption is predominant in the United States; and the trendimpacts every business in the supply chain. As a consequence, New York fruit and vegetableindustries must also cope with the impact of this decline in consumption. Industry members arepressured to manage production costs while attempting to keep pace with innovations intechnology and new product development even as per capita consumption declines.Figure 1. Estimates of Per Capita Fruit and Vegetable Consumption--farm weight equivalent--lbs per capita (farm weight equivalent)240.0220.0200.0Processed vegetables180.0Fresh vegetables160.0Processed fruitFresh : USDA – Economic Research Service. Food Availability Data n/FoodAvailIndex.htmThe impact on the processing sector has also been observed. According to the U. S.Economic Census, although the value of U.S. fruit and vegetable manufacturing shipmentsincreased 13.1% from 2002 to 2007, the value of fruit and vegetable manufacturing shipments inNew York actually declined by 1.0% (Table 1). In New York, however, the loss of processingestablishments was not as severe as the loss of establishments nationally.2
In 2007, New York State had 86 fruit and vegetable processors with sales ofapproximately 2.8 billion. A number of national brands such as Mott’s, Silver Floss, andLibby’s are processed in the Genesee Valley region, while the region also has some frozen fruitand vegetable repackers as well as niche processors.Table 1. Change in Fruit and Vegetable Processing Establishments and Value of Shipments,2002 to 2007--Percent Change-No. ofIndustryestablishmentsValue of shipmentsU.S. Fruit and Vegetable Manufacturing-7.8%13.1%New York State Fruit and Vegetable Manufacturing-2.8%-1.0%Source: U. S. Census Bureau – Economic Census, 2002 and 2007Despite the flat to declining per capita consumption of fruits and vegetables, freshproduce sales in the retail sector have been growing (Table 2). Consumer interest in health andconvenience have been well met by supermarket produce department offerings of packagedsalads, fresh-cut vegetables, and organics. Retail sales have increased due primarily to inflationand sales of higher margin, value-added products. Actual increases in volume have not beenenough to keep up with population growth.Table 2. Estimates of All U. S. Retail Sales of Fresh Fruits and Vegetables1% change20022007Retail Produce Sales billions49.663.5%28.1%1includes sales from all retail outletsSources: U. S. Census Bureau – Economic Census and Cornell calculationsRetail sales of canned and frozen vegetables grew in 2008 and 2009 during thedepression but sales estimates for 2010 indicate minimal growth (Table 3). Canned fruits showedmostly flat or negative growth from 2007 to 2010 and frozen juices slipped drastically 2008 to2010. Even shelf-stable juices showed little or negative growth from 2008 to 2010.Table 3. Changes in Retail Sales of Processed Fruits and Vegetables% change vs year ago20082009Frozen vegetables6.03.4Canned vegetables5.88.0Canned fruit0.00.7Frozen juices, drinks-3.3-7.0Shelf-stable juice, drinks-0.4-2.4Source: Chanil and Major, 2011a320100.11.6-3.6-11.60.2
The Genesee Valley Study RegionThe study area is a region of nine counties in western central New York comprised of Genesee,Livingston, Monroe, Ontario, Orleans, Steuben, Wayne, Wyoming, and Yates counties.Demographics 1,280,895 people in 2010 up 1.26% from 2000 (slower population growth than the NYSgrowth of 2.1%)Metropolitan or Micropolitan Statistical Areas include: Rochester (metropolitan area) andBatavia and Corning (micropolitan areas).Source: U.S. Census Bureau, 2007 State and County /36/36123.html and County Summary Highlights: 2007 and 2000Agricultural DemographicsGenesee Valley study region: 5,742.52 square miles of total land area 7,482 farms 1,281 million market value of agriculturalproducts sold 990 million Total farm production expensesAs a percent of New York state:12.2% of New York state land area20.6% of New York farms29.0% of New York ag product sales28.3% of New York farm productionexpensesChanges in the regional agricultural statistics between 1997 and 2007: 19.5% increase in number of farms 110.9% increase in market value of agricultural products sold 111.5% increase in total farm production expensesSources: U.S. Census Bureau, 2007 State and County /36/36123.html and U.S. Department of Agriculture – NationalAgricultural Statistics Service. Censuses of Agriculture, State and County s4
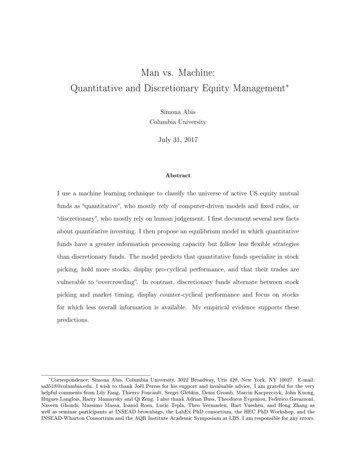
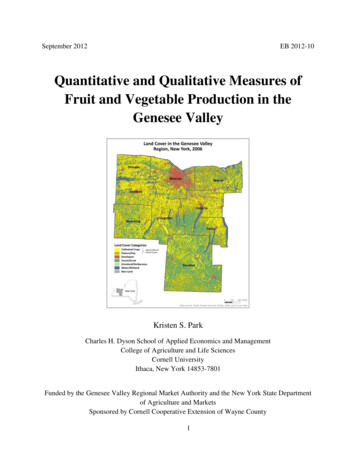
Land CoverThe region covers over 5,742 square miles (Table 4 and Figure 2). The study uses a landcover dataset from the National Oceanic and Atmospheric Administration that describes all theland cover in a geographic area. The region is largely agricultural with a large percentage of landcover in agriculture. In 2006, the most recent year for which data are available, agricultural land,defined as pasture, hay, and cultivated crops, covered 49% of the total area of the region. Theregion is much more developed agriculturally than New York in general. In New York, 22.8% ofthe land cover is in agriculture. The greatest land cover in the state is forest and woodlandsystems that comprise 53.7% of the land cover.Table 4. 2006 Agriculture Land Cover in the Genesee Valley Region2006 Ag land% of totalCountyTotal areacoverland areasq milessq .14171.9250.8Genesee Valley region5742.522,828.6949.3Source: National Oceanic and Atmospheric Administration, C-CAP Land Cover Atlas.http://www.csc.noaa.gov/ccapatlas/#app 53cc&b8de-selectedIndex 2Figure 2 illustrates the land cover in the region and contrasts areas of development withnon-developed lands which includes agricultural, forests, grasses, water, and barren lands.5
Figure 2. Land Cover in the Genesee Valley Region, New York, 20066
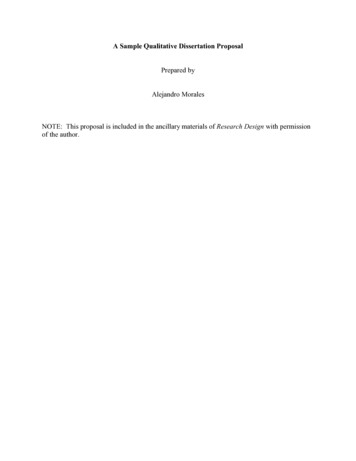
The region’s agricultural land cover remained extremely stable from 1996 – 2006.Although some land changed and moved from other land into agricultural production and somemoved from agricultural cover into other land cover, the net change in land area averaged lessthan one percent (0.07%) from 1996 to 2006 (Table 5 and Figure 3).Table 5. Changes in Agriculture Land Cover in the Genesee Valley Region, 1996 – 2006County19962006Net gain/loss% changesq misq misq -0.01-0.01%GVR2,826.592,828.692.100.07Source: National Oceanic and Atmospheric Administration, C-CAP Land Cover Atlas.http://www.csc.noaa.gov/ccapatlas/#app 53cc&b8de-selectedIndex 27
Figure 3. Changes in Agricultural Land Cover in the Genesee Valley Region, New York, 1996 – 20068
Fruit and Vegetable Production CapacityThe region is an exporter of many agricultural products including a number of fruit andvegetable crops. Regional production was estimated by obtaining fruit and vegetable cropacreage from the 2007 Agricultural Census and multiplying it by average crop yields for theregion obtained from researchers at the New York State Agricultural Experiment Station. Bythese estimates, the Genesee Valley region produced approximately 75.5% of New York’svegetable crop and 49.9% of its fruit crop (Table 6)Table 6. Estimated Production of Fruits and Vegetables in the Genesee Valley Region1% of New YorkNew York production Regional production2Productionmillion lbs%Fruits, incl. berries1,715.5855.449.9Vegetables and melons2,164.71,633.275.5Total fruits and vegetables3,880.22,488.664.11farm weight equivalent of fresh and processed productsestimated using data from U.S. Department of Agriculture, National Agricultural Statistics Service, 2007Agricultural Census2Regional consumption was calculated by obtaining estimates of average per capitaconsumption for an extensive list of fruit and vegetable products, including fresh and processedforms. The per capita consumption data are farm weight equivalents before losses due to shrink,storage, transportation, processing, etc. and are from the U. S. Department of Agriculture,Economic Research Service, Food Availability (Per Capita) Data System.If all fruit and vegetable production is combined and then divided by total fruit andvegetable consumption in the region, the region would theoretically produce almost 286% of itsneeds (Table 7). This includes production for both fresh and processing channels. Because theregion does not and cannot produce many items that are consumed, such as bananas andmangoes, it may be more useful to estimate the capacity and consumption of some of theindividual fruit and vegetable crops. This will help describe some of the strengths andweaknesses of the region’s production in more detail.9
Table 7. Estimated Consumption and Production of Total Fruits and Vegetablesin the Genesee Valley Region1Production as aRegional% of regional23consumptionRegional productionconsumption4million lbs%Fruits, incl. berries330.3855.4259.0Vegetables and melons540.51,633.2302.2Total fruits and vegetables870.82,488.6285.81farm weight equivalent of fresh and processed productsestimated using data from U.S. Census Bureau, 2010 Census and U.S. Department of Agriculture, EconomicResearch Service, Food Availability (Per Capita) Data System3estimated using data from U.S. Department of Agriculture, National Agricultural Statistics Service, 2007Agricultural Census4calculated2Production of fruits, including berries, is estimated to provide about 259% of fruitconsumed. Yet, of the fruit crops, only three are produced in quantities that exceed their regionalconsumption, apples, grapes, and cherries (tart and sweet combined) (Table 8). Apple productionalone provides a sizeable 1,205% of all apples consumed in the region, including both fresh andprocessed forms of apple consumption. Grape production in the region as a percent of grapeconsumption is 334%. However, virtually 100% of these grapes are for juice and wineproduction and what very few are sold for table consumption are usually American varieties,such as the Concord grape. The majority of cherries produced in the region are tart cherries alsoprimarily used for processing. Roughly 10% of the cherry crop is sweet cherries which areprimarily consumed fresh.Peaches and pears are also important fruit crops in the region and production levels aresuch that they would provide 91.7% and 44.8% of consumption respectively. Peaches and pearsfrom the region go to processed and fresh markets.Production of raspberries and blueberries is sufficient to provide 50.6% and 34.5% of theregion’s consumption. Berries are fragile crops, and in New York and the Genesee Valleyregion, production is primarily on smaller farms and frequently for local, direct markets. Theseasons are quite short. It is interesting that the region has production enough for roughly half ofits consumption. One possible interpretation is that most blueberry and raspberry consumptionoccurs when they are in season despite the fact that they are available now year round in mostsupermarkets.On the other hand, strawberries are produced in quantities that only cover 13.6% ofconsumption. The strawberry market is heavily dominated by national labels and thesecompanies have perfected breeding, production, and postharvest handling systems that haveallowed for national and international production and distribution 12 months of the year.10
Table 8. Estimated Regional Fruit Production as a Percentof Regional ConsumptionProduction as a % ofFruitregional rawberries13.6Plums & .0Olives0.0Papayas0.0NA Data on currant, nectarine and apricot production at theregional level were not available.Plums and prunes and blackberries are produced in small amounts locally. Productiondata at the regional level for the following fruits were unavailable: currants, nectarines, and apricotsAs shown in Table 8, there are many fruit crops that are not produced in the region.These can be largely discounted in our assessment of the region’s productive capacity as theylikely cannot be produced economically in the region.Many vegetable crops are produced in the region in volumes that exceed regionalconsumption levels (Table 9). Beets, head cabbage, green peas, snap beans, sweet corn, onions,carrots, potatoes, and cucumbers exceed consumption levels estimates. The majority of the beets,green peas, snap beans, sweet corn and carrots are grown for the processed market and are thendistributed across the eastern U.S. Head cabbage, onions, and cucumbers are primarily grownand sold for the fresh market, and cabbage and onions are storage crops that can be stored for anumber of months postharvest. Potatoes grown in the region are sold to fresh and processedmarkets; the large majority is sold to the chip market.11
Several more vegetables are produced in the region in measureable amounts as shown inTable 9. Production data for some of these crops may be smaller than actual production. TheAgricultural Census will not report crop acreage if there is a chance that the data can beassociated with an individual farm, and the production of some crops in some counties in theregion was withheld. The undisclosed data affect production estimates of the minor crops morethan the major crops.Table 9. Estimated Regional Vegetable Production as a Percentof Regional Consumption% of 34.9Peas , Green2,390.0Beans, Snap1,612.7Squash1,036.6Pumpkins927.6Sweet bers196.9Eggplant40.6Peppers, Bell30.8Cauliflower30.4Brussels Sprouts26.2Garlic23.1Peppers, .6Broccoli5.2Tomatoes5.2Lettuce, Romaine and Leaf4.4Watermelon1.9Honeydew1.212
Production coverage could not be estimated for the following vegetable crops due to lackof production and/or consumption data: artichokes, beans (lima), cabbage (Chinese), celery, collard greens, escarole, headlettuce, mushrooms, mustard greens, okra, onions (green), peas - Chinese (sugar& snow), radishes, rhubarb, sweet potatoes, turnip greens, turnipsThe region’s strengths are the major crops produced in volumes that support regionalexports. Exports of these crops from the region to the rest of the state, country or beyond provideincome to the growers, packers, shippers, processors, and distributors in the region. As long asthese fruits and vegetables are in demand, continued support for regional production of theseindustries will support the region’s economy.However, the minor crops may also provide economic opportunities. Many of these cropsare grown on farms that directly market their produce. Specializing in these crops provides nicheopportunities without risking direct competition with growers of the major crops. More effectivemarket promotion for minor crop fruits and vegetables would help small producers grow theirbusiness.While berries are difficult crops to produce and distribute, consumer demand is verystrong and continues to grow. Support of varieties, production, and postharvest handling maybenefit the growers in the region.Despite the overabundance of fruits and vegetables produced in the region, imports offruits and vegetables are still needed to balance a variety demands. These demands may beconsumer-driven or processor-driven. First, consumers demand a variety of foods. Fruits orvegetables that are tasty and nutritious but not grown in the region need to be imported. Orangesare a common example. Consumers eat, on average, 62 pounds of oranges and orange juice percapita, more than any other fruit, yet they are not grown in the Genesee Valley region.Consumers even demand more of different varieties of products, such as Granny Smith apples,organic peaches, or hot house peppers that are usually imported from outside the region.Second, consumers demand year round availability of fresh fruits and vegetables. Mostfresh fruits and vegetables need to be imported during the off-season. A few exceptions arestorage crops such as apples, potatoes, onions, and cabbage. Popular, high-volume fruits andvegetables grown in the region seasonally but in demand year round include tomatoes, lettuce,strawberries, melons, etc.Third, processors import supplies needed to maintain output and to meet customerdemands. Fourth, buyers, such as processors, retailers, wholesalers, and distributors import itemsthat are priced competitively perhaps due to abundant supplies in other regions. Finally, buyersimport to keep supply chains open from other growing regions as a hedge a
National Fruit and Vegetable Trends For more than ten years total U.S. fruit and vegetable consumption, fresh and processed, has declined. Most of the decline has occurred in the consumption of processed products, particularly fruit juices and canned an