Transcription
1
L E X ¶S F AV O U R I T E T E C H N I C A L T R A D I N G S T R AT E G I ES F O R F X - W O R K B O O KT his wor kbook is intended to accompany the /H[¶V F avourite Technical Trading Strategies for F X Applicable to Commodities and Equity Indexes as well online module.WORKBO O K Q U EST IO N : Why do you think technical indicators make trading less emotional and moreobjective?2
Table of contentsTypes of traders .5Technical indicators: Introduction .7Technical indicators: Leading Indicators .9a)Support & Resistance, Fibonacci retracement levels and Floor Pivot points . 9b)Relative Strength Index (RSI) . 13c)Stochastic Oscillator . 14Technical indicators: Lagging Indicators .16a)Moving Averages . 16b)Bollinger Band . 18c)Moving Average Convergence Divergence (MACD) . 19Technical indicators: Informational Indicators .21a)Average Directional Index (ADX) . 21b)Parabolic Stop and Reversal (PSAR) . 22c)Average True Range (ATR) . 24Trading Plan . 25Day-trade set-ups .30a)Trading set-up 1: Pivot point bounce-off . 30b)Trading set-up 2: Opening range break-out . 32c)Trading set-up 3: Post-data knock-out . 35d)Trading set-up 4: Post-data retracement . 37Trend-following trade set-ups . 39a)Trading set-up 5: Moving average crossover . 39b)Trading set-up 6: Moving average convergence divergence . 41c)Trading set-up 7: Turtle break-out system . 43d)Trading set-up 8: Ichimoku cloud . 45Range trade set-ups .52a)Trading set-up 9: Bollinger band . 52b)Trading set-up 10: RSI divergence . 53c)Trading set-up 11: Support and resistance with the stochastic oscillator & PSAR . 54d)Trading set-up 12: False break-outs and the Turtle Soup . 56Appendix A: The Fix .63Appendix B: Japanese candlesticks and technical terms as seen in 5-Step-7UDGLQJ 6WRFNV. 643
Appendix C: Fibonacci retracement levels .68Appendix D: Relative Strength Index .70Appendix E: Stochastic Oscillator .72Appendix F: Bollinger Band .73Appendix G: Average Directional Index (ADX) .74Appendix H: Parabolic Stop and Reversal (PSAR) . 80Appendix I: Average True Range (ATR) .83Appendix J: Back-testing .84Appendix K: FX mechanics (pip values and P&L, converting currencies and trading sizes) . 87Appendix L: Minimum risk-reward ratio (opening range break-out set-up) .91Appendix M: Turtle Trading .94Appendix N: Recommended readings.974
T ypes of tradersWORK B O O K E X E RC ISE : Complete the following table:ScalpersDay tradersSwing tradersPosition tradersTime horizonTrade frequencyWhat kind ofset-ups do theytrade and what dothey aim for?How often dothey need tocheck andmonitor themarket?What kind ofcharts do theylook at?Additionalcomments:WORKBO O K E X ERC ISE : Describe in your own words what the 4PM London fix is. You m ay useappendix A for more information on the fix.5
Types of tradersWORKBO O K Q U EST IO N : Should a swing trader allow larger adverse price movements than a positiontrader?WORKBO O K Q U EST IO N: For which type of trader(s) are technical trading set-ups especially useful?6
T echnical indicators: IntroductionWORKBO O K Q U EST IO N: What are technical indicators used for?WORKBO O K Q U EST IO N: What are the differences between leading and lagging indicators?WORKBO O K Q U EST IO N: How can informational indicators help you with the decision-m aking processinvolved in trading?WORKBO O K Q U EST IO N: Can an informational indicator be a leading or a lagging indicator at thesame time?7
Technical indicators: IntroductionWORKBO O K Q U EST IO N: What m arket environment does each box from above represent?Box 1:Box 2:Box 3:WORKBO O K E X E RC ISE : Describe the price action from the previous chart.For information on Japanese candlesticks and price patterns seen in 5-Step-Trading 6WRFNV , please refer toAppendix B.8
T echnical indicators: L eading Indicatorsa) Support & Resistance, F ibonacci retracement levels and F loor Pivot pointsWORKBO O K Q U EST IO N: What do the red and green boxes represent in the previous chart?WORKBO O K Q U EST IO N: What is a support level?WORKBO O K Q U EST IO N: Are support and resistance exact levels?9
Technical indicators: L eading IndicatorsExplanation of a short position & the basic mechanics of the FX market:In the FX market, currencies are traded in pairs. This is because when you buy a currency you need to payfor it using another currency. A typical quote could be for example:EURUSD 1.30The currency on the left (EUR in this case) is called the base cur rency and the price of a currency pairalways tells you how much 1 unit of this base currency is worth in terms of the other currency in the pair.This means that 1 euro equals 1.30 US dollars. When you expect the euro to be worth more US dollars, youcan buy euros and sell US dollars and this is done by going long the currency pair (you would be long eurosand short US dollars). In the opposite scenario where you would expect the euro to fall in value against theUS dollar, you could sell euros and buy US dollars and you would be short EURUSD.Long EURUSD:Short EURUSD:buy euros (long EUR)sell euros (short EUR)&&sell US dollars (short USD)buy US dollars (long USD)WORKBO O K Q U EST IO N: Is resistance meant to be broken in an uptrend?WORKBO O K Q U EST IO N: Do prices move in straight lines in uptrends? Which technical indicator canbe used to identify potential support areas for retracements within an uptrend?10
Technical indicators: L eading IndicatorsWORKBO O K Q U EST IO N : What are F ibonacci retracement levels based on?WORKBO O K Q U EST IO N: Why does a certain discretionary and subjective element come into play whenusing F ibonacci retracement levels?WORKBO O K Q U EST IO N: Which technical indicator shows objective support and resistance levels?For more information on Fibonacci retracement levels, please refer to Appendix C.11
Technical indicators: L eading IndicatorsWORKBO O K E X ERC ISE : Calculate floor pivot points using the price data shown in the following R1PPS1S2S312
Technical indicators: L eading Indicatorsb) Relative Strength Index (RSI)WORKBO O K Q U EST IO N: What does a low reading of the RSI Indicator tell you?WORKBO O K Q U EST IO N: When is a currency pair considered oversold and when is it overboughtaccording to the RSI indicator?WORKBO O K Q U EST IO N: If a currency pair is oversold or overbought does that mean the price shouldimmediately reverse?For more information on the RSI indicator, please refer to Appendix D.13
Technical indicators: L eading Indicatorsc) Stochastic OscillatorWORKBO O K Q U EST IO N: To which two factors does the Stochastic oVFLOODWRU FRPSDUH D FDQGOH¶V FORVLQJ price to?WORKBO O K Q U EST IO N: When is a currency pair considered oversold and when is it overboughtaccording to the Stochastic oscillator?14
Technical indicators: L eading IndicatorsWORKBO O K Q U EST IO N: Under which circumstances is the Stochastic oscillator close to zero? Doesthat mean the price should reverse?WORKBO O K Q U EST IO N: What does the %D line indicate and what is it used for?For more information on the Stochastic oscillator, please refer to Appendix E.15
T echnical indicators: L agging Indicatorsa) Moving AveragesWORKBO O K Q U EST IO N: Why is a moving average considered a lagging indicator?WORKBO O K Q U EST IO N: Which type of moving average is the most sensitive to recent price action?16
Technical indicators: L agging IndicatorsWORKBO O K Q U EST IO N : What information can the slope of a moving average give to you?WORKBO O K Q U EST IO N: How can moving averages be used in trading?WORKBO O K Q U EST IO N: :KDW LV ³FRQIOXHQFH "17
Technical indicators: L agging Indicatorsb) Bollinger BandWORKBO O K Q U EST IO N: What does the line in the centre of the Bollinger band show you?WORKBO O K Q U EST IO N: What determ ines the width of the Bollinger band?WORKBO O K Q U EST IO N: How m any times out of 100 ³should the price close within the band?18
Technical indicators: L agging IndicatorsWORKBO O K Q U EST IO N: Does the band show potential support and resistance areas?WORKBO O K Q U EST IO N: If the band narrows, would you increasingly expect an explosive move?For more information on the Bollinger band, please refer to Appendix F.c) Moving Average Convergence Divergence (M A C D)19
Technical indicators: L agging IndicatorsWORKBO O K Q U EST IO N: What does the MAC D line show you?WORKBO O K Q U EST IO N: What does the signal line and the histogram show you?WORKBO O K E X ERC ISE : Explain what convergence and divergence is and identify areas where thishappens in the previous chart.20
T echnical indicators: Informational Indicatorsa) Average Directional Index (A D X)WORKBO O K Q U EST IO N: What information does the ADX indicator give you?WORKBO O K Q U EST IO N: Why is the 20 level watched closely?21
Technical indicators: Informational IndicatorsWORKBO O K Q U EST IO N: Can the ADX line enter negative territory? Does it distinguish between up anddown-moves?WORKBO O K Q U EST IO N: In the previous chart, what does it mean when the green line is above the redline?For more information on the Average Directional Index indicator, please refer to Appendix G.b) Parabolic Stop and Reversal (PSA R)22
Technical indicators: Informational IndicatorsWORKBO O K Q U EST IO N: What information does the PSAR indicator give you?WORKBO O K Q U EST IO N: When PSAR dots suddenly change from being above a candle to being belowit, how is this new dot¶V YDOXH REWDLQHG?WORKBO O K Q U EST IO N: What does the acceleration factor do?For more information on the Parabolic Stop and Reversal indicator, please refer to Appendix H.23
Technical indicators: Informational Indicatorsc) Average True Range (AT R)WORKBO O K Q U EST IO N: What information does the ATR indicator give you?WORKBO O K Q U EST IO N: Why is the ATR indicator useful for setting stop-losses and profit targets?For more information on the Average True Range indicator, please refer to Appendix I.24
T rading PlanFor more information on back-testing please refer to Appendix J.WORKBO O K Q U EST IO N: Is having a good trading plan all you need to be a successful trader? Whichother skills are desirable?WORKBO O K Q U EST IO N: If you have traded before, did you follow a trading plan? If so, did you usestop-losses and how did you come up with the levels? Have you ever experienced a trade running out ofcontrol? What did you learn from that?WORKBO O K Q U EST IO N: Why is it important not to risk too much on any single trade?WORKBO O K Q U EST IO N: Which two factors play a big role in determ ining trading size?25
Trading PlanWORKBO O K E X ERC ISE : Calculate the trading size for each of the following two scenarios:Scenario 1Scenario 2Account Size 10,000 10,000Prepared to lose (% of account size)1%1%Prepared to lose ( ) 100 100Stop-loss from entry20 pips40 pipsTrade Size?For more information on trading sizes and pip values, please refer to Appendix K.26
Trading PlanWORKBO O K Q U EST IO N: If a trader uses a 20 pip stop which of the two currency pairs shown above ismore likely to withstand a natural retracement? Why?WORKBO O K Q U EST IO N : What is the advantage of using an ATR stop versus a fixed amount of pips stopfor all currency pairs?27
Trading PlanWORKBO O K E X ERC ISE : Assume you have gone long the NZD U S D at the green arrow in the chartsbelow, where would you have been stopped out if you had used each of the following trailing stops:10 day lowest low trailing stop, Swing low trailing stop,Bollinger band trailing stop,PSAR trailing stopMoving average trailing stop28
Trading PlanWORKBO O K Q U EST IO N: Have you ever used a trailing stop? If so, which one?WORKBO O K Q U EST IO N: What is the main aim of using a trailing stop?WORKBO O K Q U EST IO N: Why are profit targets norm ally not used together with trailing stops?29
Day-trade set-upsa) Trading set-up 1: Pivot point bounce-off30
Day-trade set-upsWORKBO O K E X ERC ISE : Explain this trading set-up.31
Day-trade set-upsb) Trading set-up 2: O pening range break-out32
Day-trade set-upsWORKBO O K E X ERC ISE : Explain this trading set-up (G FX 38).WORKBO O K E X ERC ISE : Why was the break-out in the previous chart initially ignored when the pricetraded above the opening range?33
Day-trade set-upsWORKBO O K Q U EST IO N: Why was the previous trade set-up not initiated?Please refer to Appendix L to for information on the minimum risk reward ratio.34
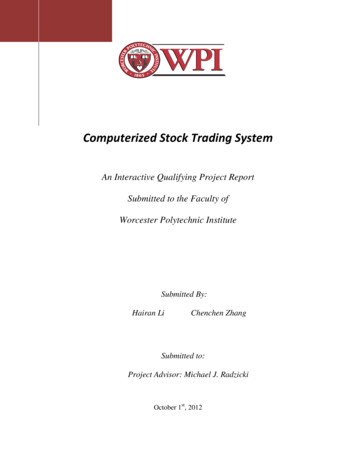
Day-trade set-upsc) Trading set-up 3: Post-data knock-outBUY EURUSDBUY USD CHFREAL POSITIONLONG EURLONG USDL ONG EURSHORT USDSHORT CHFSH O R T C H F35
Day-trade set-ups36
Day-trade set-upsd) Trading set-up 4: Post-data retracementWORKBO O K E X ERC ISE : Explain this trading set-up.37
Day-trade set-upsWORKBO O K Q U EST IO N: Should inexperienced traders trade news events? Why?38
T rend-following trade set-upsa) Trading set-up 5: Moving average crossoverWORKBO O K Q U EST IO N: Explain this trading set-up.39
Trend-following trade set-upsWORKBO O K Q U EST IO N: What is the purpose of applying the ADX filter?WORKBO O K Q U EST IO N: Should you use an initial hard stop for the previous trade set-up?WORKBO O K Q U EST IO N: If a short trigger was given, when should you exit and reverse your trade?(hint: distinguish between closing and intra-day trading below the moving average)40
Trend-following trade set-upsb) Trading set-up 6: Moving average convergence divergence41
Trend-following trade set-upsWORKBO O K E X ERC ISE : Explain this trading set-up (G FX 56).WORKBO O K E X ERC ISE : Explain the previous trading set-up.42
Trend-following trade set-upsc) Trading set-up 7: Turtle break-out systemWORKBO O K E X ERC ISE : Complete the following table:EntryInitial stopTrailing stopLong tradeShort tradeWORKBO O K E X ERC ISE : Identify the 20 day high and the 20 day low in the following chart:WORKBO O K E X ERC ISE : Calculate the stop-loss for the following long entry assuming 1 ATR equals 92pips.LONG1.04712xATRStop-lossWORKBO O K Q U EST IO N: Should you exit a long trade that hits the 2 ATR stop before it hits the 10 daylow?43
Trend-following trade set-upsWORKBO O K Q U EST IO N: What did one of the people behind the turtle trading system say aboutpublishing the rules in a newspaper?For more information on the turtle trading system, please refer to Appendix M.44
Trend-following trade set-upsd) Trading set-up 8: Ichimoku cloudBase & Conversion Lines:WORKBO O K Q U EST IO N: Does a bar chart give less information than a candlestick chart?45
Trend-following trade set-upsWORKBO O K Q U EST IO N: Does the base line follow the current price action better than the conversionline? Why / why not?Explanation of GFX 65:When the conversion line is above the base line, thesum of the highest high and the lowest low of theprevious 9 periods must be greater than the sum ofthe highest high and lowest low of the previous 26periods:Conversion line ୌ୧ ୦ୣୱ୲ ୦୧ ୦ ሺଽ ୮ୣ ୧୭ୢୱሻ ା ୭୵ୣୱ୲ ୪୭୵ ሺଽ ୮ୣ ୧୭ୢୱሻ ଶGreater thanBase line ୌ୧ ୦ୣୱ୲ ୦୧ ୦ ሺଶ ୮ୣ ୧୭ୢୱሻ ା ୭୵ୣୱ୲ ୪୭୵ ሺଶ ୮ୣ ୧୭ୢୱሻ ଶThis can only happen when the lowest low of the previous 9 periods is at a higher level than the lowestlow of the previous 26 periods. You cannot obtain a 9 period high that is greater than the 26 periodhigh because the first 9 periods are per definition included in the longer time frame of 26 periods.Therefore, when the conversion line is above the base line, it is considered bullish- the price made ahigher low during the last 9 periods compared to the low made during the last 26 periods.WORKBO O K Q U EST IO N: When the base line is above the conversion line, is it bullish or bearish? Why?What must the price do to obtain a greater value for the base line than the conversion line?46
Trend-following trade set-upsWORKBO O K E X ERC ISE : Explain the previous trading set-up.47
Trend-following trade set-upsLeading Spans:48
Trend-following trade set-upsWORKBO O K Q U EST IO N: :K\ DUH WKHVH WZR OLQHV FDOOHG ³OHDGLQJ VSDQV" WORKBO O K E X ERC ISE : Explain the previous trading set-up.49
Trend-following trade set-upsWORKBO O K Q U EST IO N: How is the Ichimoku cloud formed?Lagging Span:WORKBO O K Q U EST IO N: What does the lagging span plot and where does it displays this information?50
Trend-following trade set-upsWORK BO O K E X ERC ISE : Explain the previous trading set-up.Summ ary:Leading span BLagging spanLeading span AConversion lineBase lineBullishPrice crosses above base lineConversion line crosses above base linePrice crosses above cloudFast leading span (A) crosses above slow leadingLaggingspan (B).span closes higher than the close of 26days agoBearishPrice crosses below base lineConversion line crosses below base linePrice crosses below cloudFast leading span (A) crosses below slow leadingLaggingspan (B).span closes lower than the close of 26 daysagoLagging span crosses above cloudLagging span crosses below cloud51
Range trade set-upsa) Trading set-up 9: Bollinger bandWORKBO O K E X ERC ISE : Explain the previous trading set-up.WORKBO O K Q U EST IO N: Why are some potential triggers (where the price trades outside the band)ignored in the previous chart?52
Range trade set-upsb) Trading set-up 10: RSI divergenceEntry (Long)1.2290Stop-loss1.2040 (- 250 pips)Target1.2790 ( 500 pips)Risk reward1:2WORKBO O K E X ERC ISE : Explain the previous trading set-up.53
Range trade set-upsc) Trading set-up 11: Support and resistance with the stochastic oscillator & PSA RWORKBO O K Q U EST IO N: Why can trading support and resistance areas be ambiguous?WORKBO O K Q U EST IO N: Are support and resistance areas subjective?54
Range trade set-upsWORKBO O K E X ERC ISE : Explain the previous trading set-up.55
Range trade set-upsd)Trading set-up 12: F alse break-outs and the Turtle SoupWORKBO O K Q U EST IO N: When do trend-following strategies work well? What about reversalstrategies?WORKBO O K Q U EST IO N: How can looking at a wider timescale help you understanding the m arketenvironment better and distinguishing between genuine and false break-outs?56
Range trade set-upsWORK BO O K Q U EST IO N: Is it important to know if the level that is being tested or that is about to bebroken stands out to other traders?57
Range trade set-upsWORKBO O K Q U EST IO N: Can looking at other indicators help you distinguishing between genuine andfalse break-outs?WORKBO O K Q U EST IO N: Why would large players trick sm aller traders into buying whilst they areselling?58
Range trade set-upsWORKBO O K E X ERC ISE : What happens in the previous chart?WORKBO O K E E RC ISE : Complete the following table:59
Range trade set-upsWORKBO O K Q U EST IO N: During September no turtle soup trade is given even though 20 day high levelsare broken. Why?60
Range trade set-upsWORKBO O K Q U EST IO N: Does the turtle soup set-up restrict you from trading a normal trend-followingstrategy?WORKBO O K Q U EST IO N: If the trade does not get triggered on the day after the 20 day extreme levelwas broken, should you cancel the working order?61
ConclusionWORKBO O K Q U EST IO N: What are the main things you look for in a plain price chart?WORKBO O K Q U EST IO N: Should you be careful with triggers given in the opposite direction of a strongtrend?WORKBO O K Q U EST IO N: Should you expect volatility around large psychological levels?WORKBO O K Q U EST IO N: Is the complexity of a technical indicator correlated with its success rate?WORKBO O K Q U EST IO N: Should you always trade with a stop?62
A ppendix A : T he F ixLet me explain what the fix means. Because currencies trade 24 hours a day there is never a real closingprice like there is with equities. However, companies and financial institutions want one single price atwhich they can value their currency holdings and at which they can trade or swap currencies at.That is why there is a company that calculates a standardized rate every day creating a global benchmarkto value currencies at. It is derived from what is called the 4pm London fix and the rates obtained are theones you can see for example in the Financial Times.A fix rate is simply a price which serves as a reference rate. So the 4pm London fix is just the price atwhich a currency pair trades at 4pm UK time. As you might know, most of FX trading happens duringthe London session. This could be explained due to its strategic location as it links Asiawith America whilst markets in Europe, Middle East and Africa are open at the same time as well.So, if a large Japanese company wants to buy 100 million euros it might instruct their broker to do it atthe 4pm fix rate. The company promises to use the euro-yen rate at 4PM to pay for their euros. If theJapanese company places this order at 1pm UK time, their broker could actually buy the euros beforethe fix time if they expect the euro to trade higher at 4PM- they could buy them cheap and sell them at ahigher price to the Japanese company.However this does normally not happen. It would involve too much risk exposure for the broker becausethe euro-yen could also trade lower at 4PM and the broker would have to absorb the losses. So normallythese orders are executed at or very close to the fixing time which of course could potentially createadditional volatility. Especially if large orders unknown to other market participants are placed.The coverage of this closing rate benchmark includes 159 currencies and for some currencies such as theeuro, pound sterling or the Australian dollar, intra-day fix rates are also calculated every 30 minutes. Forother currencies for which offshore trading is not permitted such as the Chinese yuan or the Indonesianrupiah, intra-day rates are published in line with their local market levels. So if the market does nottrade, no changes in fix rates are given.Although the 4pm London closing fix rate is a globally accepted benchmark, other institutions mightalso have their own fixing rates. For example the ECB uses FX rates as of 2.15 PM CET as theirUHIHUHQFH UDWH 7KLV LV EHFDXVH (XURSHDQ FHQWUDO EDQNV QRUPDOO\ GR WKHLU GDLO\ ³FRQFHUWDWLRQ SURFHGXUHV between other central banks across Europe and worldwide at that time. There is also anotherLondon fix rate at 11.00 AM which might be a bit more convenient for Asian corporations. So as yousee, it is important to be aware of these different fixing times as it could potentially cause significantintra-day movements.63
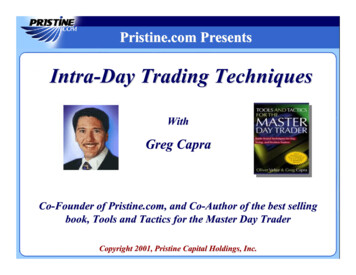
A ppendix B: Japanese candlesticks and technical terms as seen in 5-Step-7UDGLQJ 6WRFNV Daily line charts only plot the closing price of each day without showing where the price has beentrading during the day.Candlesticks do plot this additional information by showing the highest and lowest level at whichthe price has traded at and as well the opening and closing prices.EURUSD - Line 00012345678910 11 12 13 14 15 16 17 18 19 20 21 22 23EURUSD - Candlestick & Line 1001.200012345678910 11 12 13 14 15 16 17 18 19 20 21 22 2364
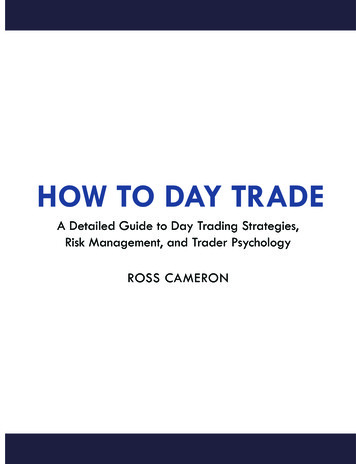
Candle 2, bad: the price closed lower than where it opened. VERY GOODCandle 1, good: the price closed higher than where it opened.DRAGONFLYGRAVESTONEDOJIVERY BADBADGOOD Candle 3, very bad: the price barely traded above the opening price and closed pretty much at thelow.Candle 4, doji: the price opened and closed at the same level but traded above and below it. Thisnormally indicates indecision as neither sellers or buyers have been able to dominate the priceaction.Candle 5, gravestone doji: this is a negative candle because the price traded above the open butsellers stepped in and pushed the price back down.Candle 6, dragonfly doji: this is a positive candle because the price traded below the open butbuyers stepped in pushing the price back up.Candle 7, very good: the price barely traded below the open and closed pretty much at the high.65
Most of the candlestick patterns seen in 5-Step-7UDGLQJ 6WRFNV DUH QRW UHDOO\ DSSOLFDEOH WR WKH FX markets. This is because in FX, the open of a candle is almost always the same as the close ofthe previous candle since the market only closes over the weekend.These two patterns from 5-Step-7UDGLQJ 6WRFNV are probably the only ones worth mentioninghere:The Hammer (bullish) The Hanging Man (bearish)Continuation price patterns: These patterns are usually followed by a break-out into the directionof the previous trend.- ‐The flag resembles a downward sloping rectangle marked by two parallel trend lines.- ‐The pennant is a downward sloping pattern but instead of a rectangle it looks like avertical triangle.FX PriceFlagFX Jan11-JanPennant16-Jan21-Jan26-Jan66
Reversal price patterns: These patterns often indicate the end of a trend and signal to a potentialreversal. - ‐Head and shoulders / inverted head and shouldersFX Price29-Dec03-Jan- ‐08-JanNeckline13-JanFX Price18-Jan23-Jan28-Jan29-Dec03-Jan08-Jan13-JanFX Price 04-Jan23-Jan28-Jan09-Jan23-Jan28-JanDouble BottomDouble nWhen a resistance level is broken, buyers overwhelm sellers and normally an explosive move isobserved. If th
2 LEX¶S FAVOURITE TECHNICAL TRADING STRATEGIES FOR FX - WORKBOO K This workbook is intended to accompany the /H[¶V Favourite Technical Trading Strategies for FX - Applicable