Transcription
Crypto TradingStrategiesApr 27, 2021Amanda Brown MS, MS&E ‘21Jonathan LingMS, MS&E ‘21Arjun Sawhney MS, CS ‘21
ContentsData SelectionData ExplorationMethodsEvaluationData universeData availabilityHandling missing dataBlockchain dataAsset correlationAutocorrelationStatistical arbitrageTime series analysisDeep learningToy modelBacktestingMetrics
Dataset Selection
Data universe7,800 cryptocurrencies (as of Jan 2021)1500 cryptocurrency exchanges230 public APIs available3; we looked into Kraken and Bitfinex as they had downloadabledata without needing an APIBTCUSD is the most traded pairData availability: many new currencies have only been in existence for 3 yearsData is mostly already clean, but missing when exchange is down or trade volume is zero1 -are-there-in-2021/2 rency-exchanges-are-there3 urrency
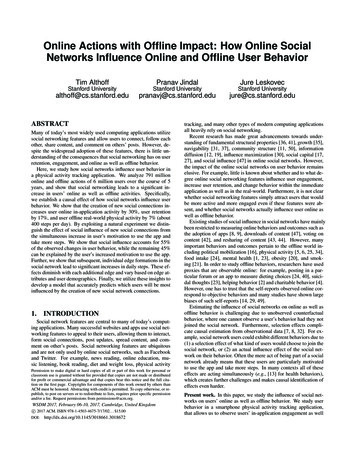
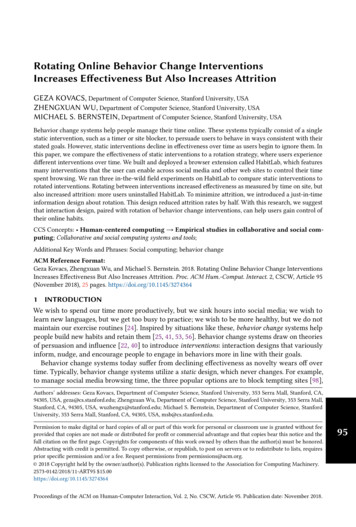
Data source choice: Bitfinex is more liquidand has more complete data than KrakenClose priceRaw dataBitfinexKrakenDifference(Bitfinex - Kraken)(Bitfinex - Kraken)DifferenceVolume*Data was for BTCUSD from one sampled day (3/19/21)
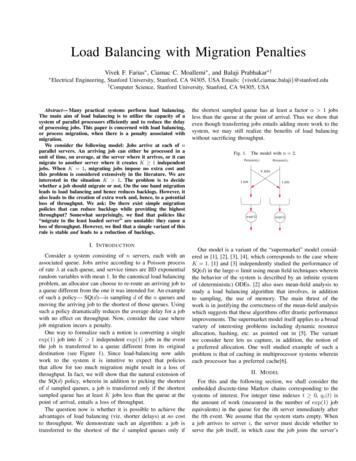
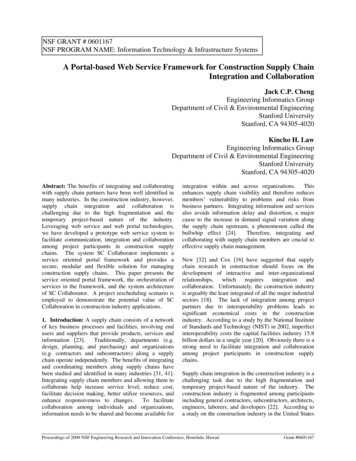
BTC/ETH/XRP-to-USD are the most datacomplete currency pairs across 2019-21Data availability (percentage non-missing) atthe minute level for the most data-completecurrency pairs in the Bitfinex dataWe filtered for all currency pairs whose dataavailability percentage was above 60% for2019, 2020 and 2021 (only 5 pairs qualified),then plotted their availability.From the data, BTC, ETH and XRP to USD arethe most data-complete coins. This isconfirmed by the fact that they are also thetop traded coins on coinmarketcap.com byvolume and market capitalization.
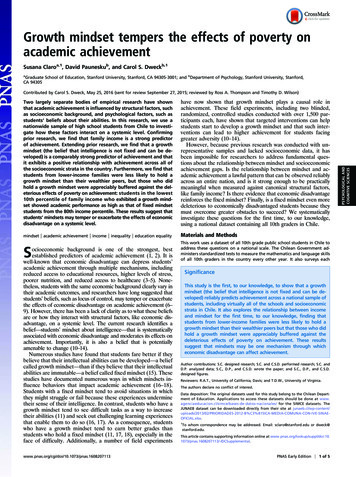
Hourly-level data cleaning and availabilitywas done by syncing ‘close’ timestampsResolution technique for syncing “close” time stamps ( /- 2 minutes). This yielded much higherdata availability percentage than minute-level data, as expected.Data availability (percentage non-missing) at the hour levelcalculated using two methodsExact filtering on on-the-hour timestamps /- 2 minute timestamp leniency
Data Exploration
Time period of observationsPairs Trading Start: 2020-01-01End: 2021-04Frequency: by hourSingle-Asset Models Start: 2018-01-01End: 2021-04-01Frequency: by minute & hour
Correlation matrix (hourly data),Sept. 2020 - Jan. 2021ReturnsOpen Price
Time series correlations (BTC, ETH, XRP)We observe extremely weak correlations at the minute level
Top 4 Lagged Corrs:Hourly returns (8 tokens)34 hour lag
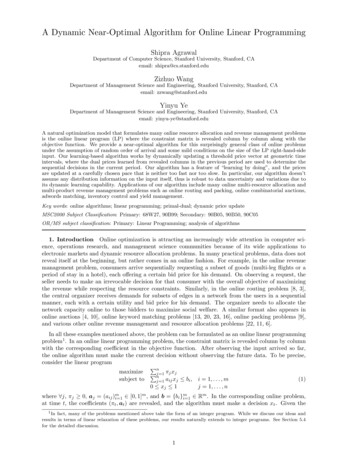
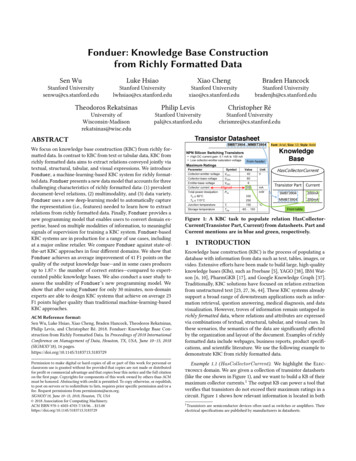
Co-integrated pairsPairs where p-value is 0.05:Co-integration p-values (plotting p 0.98)(ETH, XLM)(DOT, ADA)(LTC, XLM)XLMETH
Methods
Stat arb: pairs trading strategy1.2.3.4.5.Calculate price ratios of cointegrated pairs for all time points in training set (e.g. ‘eth’divided by ‘xlm’)Get 6 hour moving average of ratiosGet 72 hour moving average and standard deviation of ratiosCalculate z-scoreIf z-score 2, sell the overperforming coin, buy the othere.g. If ratio eth price / xlm price, thenif ratio is low (z -2), buy ‘eth’ and sell ‘xlm’If ratio is high (z 2), sell ‘eth’ and buy ‘xlm’
Time series regression: autocorrelation andseasonalityAutocorrelationModel: regressionWe use lagged regression features up until somelookback time period to predict the target Feature engineering can then be performed (as afunction of the lookback) to account for non-linearsignals and interactionsAutocorrelation and seasonalityModel: neural network*Seasonality settings will require further adjustments tomake the model predictions more granularLog returns Log returns Actual log returnsPredicted log returns*NeuralProphet library from FacebookHours
Deep learning approachesUnderway: RNNs (recurrent neural networks) LSTMs (long short-term memory)Approaches to try next: CNNs (convolutional neural networks)Transformers
Evaluation
Evaluating models: train, validate & test Rolling-window cross-validation approachAccounting for seasonality or trends in model performance over time
Evaluating strategies: backtesting Need to account for factors such as transaction costs and market impactWe aim to use Backtrader as our backtesting frameworkIt allows us to define data feeds to feed our models and also account for transactioncosts, initial investments and the possibility of going long/short and trading on margin
Metrics for evaluationWe use different sets of metrics to evaluate our models and our strategies For the model level, given that we focus on a regression task, we focus on thevalidation adjusted R2For strategies, we consider the risk-adjusted return as our benchmark and so considerthe Sharpe ratio as our strongest metricTo get a sense of our downside, we also consider our max-drawdown and win-ratio
Crypto Trading Strategies Apr 27, 2021 Amanda Brown MS, MS&E ‘21 Jonathan Ling MS, MS&E ‘21 Arjun Sawhney MS, CS ‘21. Contents Data Selec t ion Data Explorat ion Met hods Evaluat ion Data universe Data availability Handling missing data Blockchain dat