Transcription
Theranostics 2018, Vol. 8, Issue 113126IvyspringTheranosticsInternational PublisherResearch Paper2018; 8(11): 3126-3137. doi: 10.7150/thno.24784Image-guided chemotherapy with specifically tunedblood brain barrier permeability in glioma marginsXihui Gao1, 7, *, Qi Yue2, *, Yikang Liu3, Dandan Fan1, Kun Fan4, Sihan Li1, Jun Qian1, Limei Han1, FangFang5, Fulin Xu1, Daoying Geng6, Liang Chen2, , Xin Zhou5, Ying Mao2 and Cong Li1,6, 1.2.3.4.5.6.7.Minhang Branch, Zhongshan Hospital and Key Laboratory of Smart Drug Delivery, Ministry of Education, School of Pharmacy, Fudan University,Shanghai, China.Department of Neurosurgery, Huashan Hospital, Fudan University, Shanghai, China.Department of Biomedical Engineering, The Pennsylvania State University, University Park, PA, USADepartment of Pancreatic and Hepatobiliary Surgery, Fudan University Shanghai Cancer Center, Shanghai, ChinaNational Center for Magnetic Resonance in Wuhan, State Key laboratory of Magnetic Resonance and Atomic and Molecular Physics, Wuhan Institute ofPhysics and Mathematics, Chinese Academy of Sciences, Wuhan, Hubei Province, ChinaInstitute of Functional and Molecular Medical Imaging, Department of Radiology, Huashan Hospital, Fudan University, Shanghai, China.Department of Laboratory Medicine, Shanghai Fengxian District Central Hospital, Shanghai, China.*These authors share equal first authorship. Corresponding authors: Cong Li, Email: congli@fudan.edu.cn; Liang Chen, Email: hschenliang@fudan.edu.cn Ivyspring International Publisher. This is an open access article distributed under the terms of the Creative Commons Attribution (CC BY-NC) /4.0/). See http://ivyspring.com/terms for full terms and conditions.Received: 2018.01.07; Accepted: 2018.03.05; Published: 2018.04.30AbstractBlood–brain barrier (BBB) disruption is frequently observed in the glioma region. However, the tumoruptake of drugs is still too low to meet the threshold of therapeutic purpose.Method: A tumor vasculature-targeted nanoagonist was developed. Glioma targeting specificity of thenanoagonist was evaluated by in vivo optical imaging. BBB permeability at the glioma margin wasquantitatively measured by dynamic contrast enhanced magnetic resonance imaging (DCE-MRI).Single-photon emission computed tomography imaging/computed tomography (SPECT/CT)quantitatively determined the glioma uptake of the radiolabeled model drug. T2-weighted MRI monitoredthe tumor volume.Results: Immunostaining studies demonstrated that the BBB remained partially intact in the invasivemargin of patients’ gliomas regardless of their malignancies. DCE-MRI showed that vascular permeabilityin the glioma margin reached its maximum at 45 min post nanoagonist administration. In vivo opticalimaging indicated the high glioma targeting specificity of the nanoagonist. SPECT/CT showed thesignificantly enhanced glioma uptake of the model drug after pre-treatment with the nanoagonist.Image-guided paclitaxel injection after nanoagonist-mediated BBB modulation more efficiently attenuatedtumor growth and extended survival than in animal models treated with paclitaxel or temozolomidealone.Conclusion: Thus, image-guided drug delivery following BBB permeability modulation holds promise toenhance the efficacy of chemotherapeutics to glioma.Key words: image-guided chemotherapy, dynamic contrast-enhanced magnetic resonance imaging,blood-brain-barrier, glioma margin, nanoagonistIntroductionGliomas accounts for approximately 80% ofprimary malignant brain tumors [1]. Despiteaggressive treatment including maximum debulkingsurgery, radiotherapy and chemotherapy, gliomapatients still face dismal prognosis [2]. Among thenumerous chemotherapeutics approved for cancertreatment, only a few, such as temozolomide (TMZ),show efficacy towards glioma [3]. In addition to drugresistance, the reason is likely, at least in part, due totheir inability to circumvent the blood–brain barrierhttp://www.thno.org
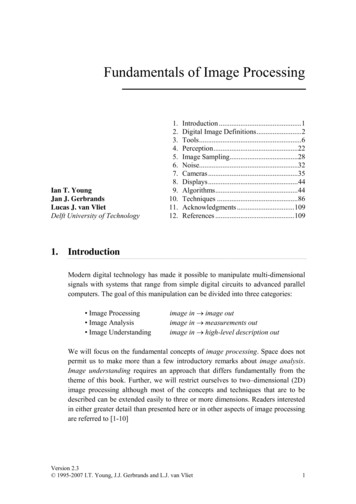
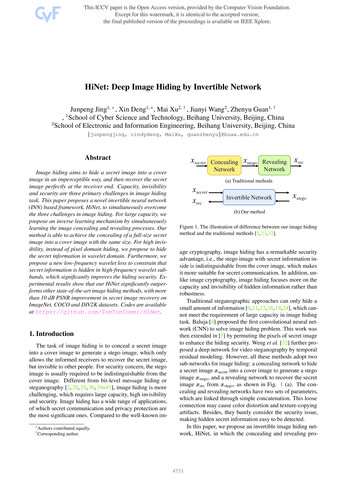
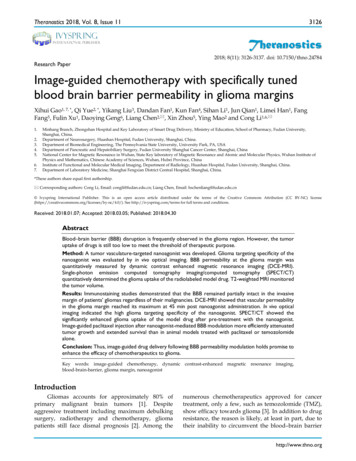
Theranostics 2018, Vol. 8, Issue 11(BBB) that maintains brain homeostasis by shieldingthe brain from peripheral circulation [4, 5]. d BBB is believed to exist in invasiveedges of gliomas allowing the cancer cells to infiltrateinto surrounding brain tissue [6]. Considering mostrecurrences occur in the glioma margins [7], strategiesspecifically delivering therapeutics into the tumorperiphery by circumventing the BBB are direlyneeded.Up-regulating para-endothelial diffusion is anattractive strategy to increase the brain delivery ofdrugs by maximally preserving their pharmacologicalpotencies. Hypertonic agents such as mannitol havebeen used in the clinic to break para-endothelial tightjunctions (TJs) via osmotic pressure [8]. However,non-selective BBB disruption results in complicationssuch as epileptic seizures and brain edema [9].Microbubble-enhanced focused ultrasound (MB-FUS)was also used to facilitate brain drug delivery bydisrupting TJs via bubble oscillation-inducedmicrostreaming forces [10]. Nevertheless, mechanicalshear force-induced potential risks, including cerebralhemorrhage and excessive immune reaction, cannotbe overlooked [11]. Therefore, up-regulating vascularpermeability in glioma marginal territories with highefficiency, specificity and safety is highly desirable.Adenosine 2A receptor (A2AR) is a purinergicG-protein coupled receptor (GPCR) with adenosine asan endogenous agonist. Signaling vascular A2AR withits agonist could increase BBB permeability bytemporarily opening TJs [12]. We previouslydeveloped a series of A2AR nanoagonists that not onlymore efficiently modulated BBB permeability thansmall molecule agonists, but also showed capability oftuning the BBB opening time window [13, 14].Importantly, minimal side effects were observed evenafter multiple cycles of BBB modulation [15, 16]. Inthis study, we developed a new nanoagonist in whichglioma-targeting ligands and A2AR agonistic domainswere modified on a nanoplatform. We hypothesizedthat this nanoagonist would first target the gliomaneovasculature and then compromise herapeutic is injected when the BBBpermeability is imaged to be high in the gliomamargin but low in the surrounding brain tissue.Therefore, the efficiency of chemotherapeutics couldbe maximized by specifically increasing BBBpermeability in the tumor invasive margin. The aim ofthis study is to up-regulate chemotherapeuticefficiency by specifically increasing blood brainbarrier permeability in the glioma invasive margin.3127ResultsTight junction-associated protein ZO-1remains partially intact in patient gliomamarginsAlthough uncompromised BBB in the gliomamargin is believed to be the primary cause of the lowchemotherapeutic efficiency [17], there is insufficientclinical evidence to support this notion. To addressthis issue, ZO-1, a key TJ-associated protein thatdetermines BBB integrity, was immuno-stained in themarginal regions of low-grade glioma (LGG) andhigh-grade glioma (HGG) from patients, as well as incontrol brain tissues (Figure 1A). While ZO-1immunity was presented as well-regulatedzebra-strips twining around vascular endothelium incontrol brain tissues, its disrupted distribution andattenuated expression level in glioma margins wereevident. Nevertheless, capillaries with unspoiledZO-1 immunity were still present in the marginalterritories regardless of the malignancy grade. Thecapillary percentage with intact ZO-1 was decreasedfrom 74.1% in control brain tissues to 48.5% in LGGand 23.7% in HGG (Figure 1B). The highest ZO-1expression level was found in control brain tissues,which was 1.45- and 3.17-fold higher than that in LGGand HGG respectively (Figure 1C). Representativehematoxylin-eosin (H&E)-stained images of LGG,HGG and control brain tissue sections are presentedin Figure S1. Neurons, glial cells and vascularendothelial cells distributed dispersedly and werewell-organized in control human brain tissues. In theLGG margin, the cells distributed with a slightlyhigher density than in the control brain tissues andmild shape abnormality was observed. Also,neuronophagia and blurred structures were observed.In the HGG margin, the cell density was substantiallyhigher than that of the control brain and LGG margin.Remarkable shape abnormality and karyokinesis withhigher nucleus to cytoplasm ratio were observed.Additionally, the normal structure of brain tissuedisappeared and disorderedly distributed vasculatureand necrosis were evident.Over-expression of both A2AR and β3 integrinin patient glioma marginsThe presence of both A2AR and αvβ3 integrin inthe glioma margin is a prerequisite to specifically tuneBBB permeability in the glioma margin. As expected,no obvious β3 integrin was detected in the vessels ofcontrol brain tissues (Figure 2A). By contrast,pronounced β3 integrin immunity polarized on theluminal face of the vasculature in HGG margins wasdemonstrated. While vascular A2AR immunityremained faint in control brain tissue, it increasedhttp://www.thno.org
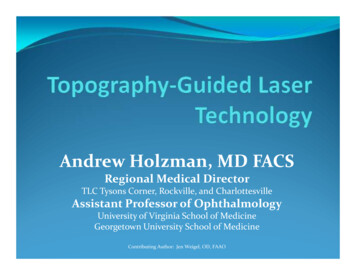
Theranostics 2018, Vol. 8, Issue 113128Figure 1. Uncompromised TJ associated protein is found in the glioma margin from patients. (A) Representative immunofluorescence images ofvascular endothelium and ZO-1 protein in control brain tissues and invasive margins of LGG and HGG. Endothelium stained by CD31 antibody is displayed in red,ZO-1 immunity is displayed in green; the nucleus stained with DAPI is shown in blue. Scale bar: 30 μm. (B) Percentage of capillaries with intact ZO-1 immunity incontrol brain tissues and glioma margins (control brain tissue, n 4, LGG, n 3, HGG, n 5). *P 0.05 control brain tissue vs HGG. (C) Normalized vascular ZO-1immunities in control brain and glioma margins. *P 0.05 control brain tissue vs. HGG. LGG: low-grade glioma; HGG: high-grade glioma; TJ: tight junction.remarkably in the tumor margins (Figure 2B).Compared to the control brain tissue, A2AR and β3integrin immunities were increased by 53% and69.4%, respectively, in LGG and 57% and 213.5%,respectively, in HGG (Figure 2C).Nanoagonist compromises TJs in the brainendothelial monolayerIn this work, a new nanoagonist Den-RGD-Regwas developed that was expected to first target theglioma neovasculature and then compromiseperi-tumoral BBB integrity via A2AR signaling. e Den-Reg without a tumor targetinggroup, and Den-PEG without any functional groupwere selected as control groups. The chemicalstructures of the small molecule agonist regadenoson,nanoagonist Den-RGD-Reg, control nanoparticleDen-Reg, and Den-PEG are presented in Figure 3A.Detailed synthetic procedures are presented in FigureS2. The agonistic domain Reg-NH2 and c(RGDyK)peptide were labeled on the fifth generation (G5)poly(amidoamine) (PAMAM) dendrimer throughpoly(ethylene glycol) (PEG) linkers. The home-made,near-infrared (NIR) fluorophore IR640B was directlymodified on the dendrimer surface. 1HNMR ofDen-RGD-Reg indicated that the molar ratio betweenthe c[RGDyK] peptide/agonist domain/dendrimerwas 8.2/11.4/23.3/1 (see Supplementary Material).TEM images showed the nanoagonist to bewell-separated spherical particles with diameters inthe range of 6–8 nm (Figure S3A). The hydrodynamicdiameter of the nanoagonist was measured as 7.9 nm,while its surface charge was measured as 16.5 mV(Figure S3B).ZO-1 is a TJ-associated protein that links celladhesion molecules to actin cytoskeleton formaintaining morphology of endothelial cells. WhileZO-1 protein was expressed as a continuousalignment on the cell-cell interface of intact BBB, thediscontinued intervals and even absence this proteincan be observed in compromised BBB. Mouse braincapillary endothelial bEnd.3 cells were cultured toreach 100% confluence. After treatment with PBS, 10μM regadenoson, or nanoagonist, the cells wereimmunostained with anti-ZO-1 antibody. As shownin Figure 3B, ZO-1 immunity as continuous and sharplines delineated the para-cellular interface of culturedmouse brain capillary endothelial bEnd.3 cells.Although treatment with both regadenoson and thenanoagonist led to ZO-1 disruption, nanoagonisttreatment led to more significant ZO-1 breakdownthan regadenoson treatment. Actin stress fibreshttp://www.thno.org
Theranostics 2018, Vol. 8, Issue 11(ASFs) were also stained after the bEnd.3 cells weretreated with PBS, 10 μM regadenoson, or nanoagonist.Results showed that A2AR signaling triggered theformation of ASFs, leading to cell contractionfollowed by TJ disassembly. While ASFs weredistributed as short, thin fibers aligned to thelongitudinal axis of the endothelial cells, their lengthand thickness increased dramatically after agonistaddition. Nanoagonists induced ASF assembly moreefficiently than regadenoson. After treatment withregadenoson or the nanoagonist, the ZO-1immunofluorescence intensity levels were decreasedby 17% and 48%, respectively, with the simultaneousincrease in average ASF fluorescence intensity levelsby 1.9- and 2.9-fold, respectively (Figure 3C).Immunoblotting studies revealed the attenuation ofTJ-associated proteins ZO-1 (16%) and occludin (7%)at 30 min after agonist addition (Figure 3D).Cytoskeletal rearrangement promotes conversion ofG-actin to F-actin, a sign of ASF formation. TheF/G-actin ratio in bEnd.3 cells was determined to be1.32 after nanoagonist treatment, which wassignificantly higher than that of regadenoson (0.98) orPBS (0.92). Phosphorylation of myosin light chain(MLC) protein triggers the formation of ASF from3129short F-actins to elicit cytoskeletal contraction. Asexpected, while the total MLC level was unchangedafter agonist addition, phosphorylated MLC (pMLC)increased significantly. The pMLC/MLC ratios at 30min post treatment of nanoagonist or regadenosonwere measured to be 1.02 and 0.97, respectively, bothsignificantly higher than that (0.53) following PBStreatment.Nanoagonist specifically tunes BBBpermeability in the glioma marginsIn vivo NIR fluorescence images demonstratedthat the nanoagonist offered a higher target tobackground (T/B) ratio (1.83 0.84) than Den-Reg(1.21 0.43) or Den-PEG (1.10 0.27) at 24 h post i.v.injection (39.3 mg/mouse) in mice bearing orthotopicU87MG glioma xenografts (Figure S4). The T/B of thenanoagonist in excised mouse brain tissue was 2.32 0.76, which was significantly higher than that ofDen-Reg (1.46 0.51) or Den-PEG (1.26 0.38).Fluorescence microscopy imaging showed that, whilea strong fluorescence signal of nanoagonist occupiedthe entire tumor region, only scattered intratumoralsignals of Den-Reg or Den-PEG were observed(Figure S5).Figure 2. Over-expressed vascular A2AR and β3 integrin in glioma margins from patients. Representative immunofluorescence images for vascularendothelium and β3 integrin (A) or A2AR (B) in control brain tissue and glioma margins. Endothelial immunity is displayed in red, A2AR or β3 immunity is displayedin green. Scale bar: 50 μm. Perivascular A2AR or β3 immunity is indicated by the arrows. (C) Normalized immunofluorescent intensities of perivascular A2AR or β3in control brain tissue and glioma margins (brain tissue, n 4; LGG, n 3; HGG, n 5). *P 0.05 control tissue vs. LGG or HGG. ***P 0.001 control tissue vs HGG.http://www.thno.org
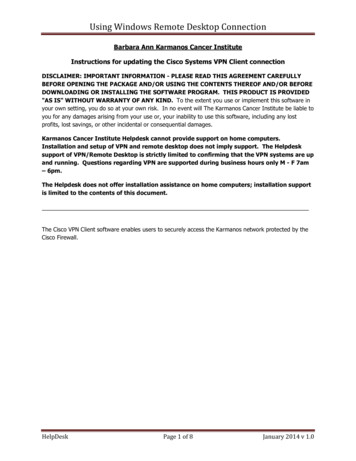
Theranostics 2018, Vol. 8, Issue 113130Figure 3. Nanoagonist attenuates para-endothelial TJs in the endothelial monolayer. (A) Chemical structures of regadenoson, nanoagonistDen-RGD-Reg, control nanoparticles Den-Reg and Den-PEG. (B) Fluorescence microscopic images of ZO-1 and ASF in the bEnd.3 endothelial monolayer at 30 minpost treatment. Arrows point to disrupted ZO-1 (upper panel) and newly formed ASF (lower panel). Scale bar: 50 μm. (C) Percentage of ZO-1 integrity andnormalized ASF fluorescence intensity at 30 min post treatment of PBS, regadenoson or nanoagonist (n 4). *P 0.05 nanoagonist versus PBS and regadenoson,regadenoson versus PBS. (D) The nanoagonist triggered MLC phosphorylation, actin aggregation and attenuation of TJ-associated proteins. β-actin was used as aninternal loading control. *P 0.05, nanoagonist vs. PBS and regadenoson, regadenoson vs. PBS. TJ: tight junction; ASF: actinomyosin stress fibre; Reg: regadenoson;MLC: myosin light chain protein; NA: nanoagonist.In vivo T2W MRI visualized the gliomaxenografts with a hyper-intense signal (Figure 4A).The tumor could not be distinguished well byT1W-MRI until the injection of Gd3 -DTPA.Interestingly, compared with the glioma xenograftdefined by Gd3 -DTPA alone, the tumor margin wasextended substantially when Gd3 -DTPA was bility alteration was quantified by dynamiccontrast-enhanced magnetic resonance imaging(DCE-MRI), in which the pixel maps of Ktrans, aparameter presenting vascular permeability bycounting the volume transfer efficiency of aparamagnetic agent between blood and theextracellular extravascular interstitium, are presented.When blood flow is not big enough compared topermeability-surface area product (PS), Ktrans in theTofts model is related to both blood flow and PS.http://www.thno.org
Theranostics 2018, Vol. 8, Issue 113131Figure 4. Nanoagonist increases BBB permeability in the margin of glioma xenografts. (A) Representative T2W-, T1W- and DCE-MR images of anidentical mouse after treatment with Gd3 -DTPA alone (upper panel) followed by combined treatment of Den-RGD-Reg plus Gd3 -DTPA (lower panel). Thecombined treatment was conducted at 24 h post the initial Gd3 -DTPA injection. (B) Ktrans maps of mouse brain when Gd3 -DTPA was injected at 45 min postnanoagonist administration. White line circles the tumor parenchyma, tumor margin is delineated between the white and black circles, blue circle selects the controlbrain tissue. (C) Average Ktrans values in glioma parenchyma, glioma margin and control brain tissue when Gd3 -DTPA was injected at 45 min PI of the nanoagonist(n 3). (D) The Ktrans value ratio between the glioma margin and control brain tissue when Gd3 -DTPA was injected at selected time-points post nanoagonistadministration.However, normal brain tissue is considered to havehigh blood flow and low permeability due to BBB. Inbrain tumor imaging, it is often assumed that theleakage is small compared to the high blood supply,which is the reason why the Tofts model is widelyused for assessing BBB disruption in tumors.Therefore, in this study, it is reasonable to associateKtrans only with BBB permeability.Compared with the Ktrans map post treatmentwith Gd3 -DTPA alone, the combined treatment ofnanoagonist followed by Gd3 -DTPA remarkablyenhanced the Ktrans signal in both the gliomaparenchyma and margin but not in the normal braintissue (Figure 4B). Importantly, the mean Ktrans valuein the glioma margins increased from 0.05mL/min/100 mL before nanoagonist treatment to themaximum of 1.2 mL/min/100 mL at 45 min postnanoagonist administration (Figure 4C and FigureS6). This value decreased to 0.7 mL/min/100 mL at 60min. The Ktrans value ratio between the glioma marginand control brain tissue reached its maximal value(9.5) when Gd3 -DTPA was injected at 45 min rescence study showed remarkable ZO-1down-regulation in the glioma margins at 30 min postnanoagonist administration (Figure S7).Figure 5A demonstrates SPECT/CT images ofthe mouse brain area after i.v. injection of 99mTc-DTPAalone or combined administration of nanoagonist plus99mTc-DTPA. According to the DCE-MRI results,99mTc-DTPA was injected at 45 min post nanoagonistadministration. In contrast to the weak intratumoralradioactivity after the injection of 99mTc-DTPA,combined treatment offered higher tumor-to-normalbrain radioactivity per unit volume ratio (2.96 0.43vs. 1.17 0.15) (Figure 5B). Figure 5C showsautoradiographic images of consecutively sectionedmouse brain slides following combined treatmentwith nanoparticle plus 99mTc-DTPA. The relativeradioactivity in glioma post nanoagonist plushttp://www.thno.org
Theranostics 2018, Vol. 8, Issue 1199mTc-DTPAtreatment was measured as 4.85 0.68,which was 3.2 and 1.9 times higher than that treatedwith Den-PEG (1.52 0.17) or Den-Reg (2.54 0.39)plus 99mTc-DTPA (Figure 5D).Image-guided drug administration increasesthe chemotherapeutic efficiencyFigure 6A presents T2W-MR images of micebearing U87MG glioma xenografts at selected timepoints post treatment with Den-RGD-Reg plus PTX,PTX alone, TMZ alone or PBS. In the control grouptreated with PBS, the average tumor volume increased11.4 times from 15.6 mm3 at 14 days post tumorimplantation to 193.1 mm3 at 28 days (Figure 6B).While treatment with PTX alone barely inhibitedglioma growth (9.7-fold volume increase at 28 days), aremarkable tumor growth delay (2.9-fold) wasobserved after the combined treatment of nanoagonist3132plus PTX. TMZ showed less therapeutic efficiencythan the combined treatment and a 5.4-fold tumorvolume increase was recorded. Compared with thePBS-treated mice with a maximal survival time of 29days after tumor implantation, all of the micereceiving PTX injection succumbed to death at day 32(Figure 6C). Notably, while only 15% of mice afterTMZ treatment survived to day 35, and 43% of micereceiving the combination of nanoagonist plus ansferase mediated dUTP nickend labeling (TUNEL) staining showed that apoptoticcells were predominately located in the tumor but notin normal brain tissue 3 weeks after the combinednanoagonist/PTX administration, implying the safetyof this treatment (Figure S8).Figure 5. Nanoagonist increases the model drug uptake in glioma xenografts. (A) In vivo SPECT/CT images of the mouse brain area after intravenousinjection of 99mTc-DTPA alone followed by combined treatment of Den-PEG plus 99mTc-DTPA (mouse 1), Den-Reg plus 99mTc-DTPA (mouse 2) or Den-RGD-Regplus 99mTc-DTPA (mouse 3). The combined treatment was applied at 48 h post initial 99mTc-DTPA injection. 99mTc-DTPA as a model drug was injected at 45 min PIof the nanoparticle. (B) Glioma to normal brain %ID/g ratio (n 4) in which 99mTc-DTPA (3.7 106 Bq/ mouse) was injected at 45 min post administration of PBS,Den-Reg or Den-RGD-Reg. *P 0.05 nanoparticle vs. PBS. (C) Autoradiographic images of mouse brain sections at 90 min post-injection of 99mTc-DTPA (n 4). Thearrows indicate glioma. (D) Relative radioactivity of 99mTc-DTPA in the normal brain and glioma areas quantitated from autoradiographic images (n 4). *P 0.05Den-RGD-Reg vs. Den-PEG. *P 0.05 Den-RGD-Reg vs. Den-Reg.http://www.thno.org
Theranostics 2018, Vol. 8, Issue 113133Figure 6. Image-guided drug administration post BBB intervention enhances the chemotherapeutic efficacy. (A) Representative in vivo T2W-MRI ofthe mouse brain bearing glioma xenograft at selected time-points post treatment of PBS, TMZ (20 mg/kg daily), PTX (5 mg/kg every three days) or nanoagonist (39.3mg/kg) plus PTX (5.0 mg/kg). The dashed line delineates the tumor margins. Tumor size (B) and survival rate (C) of the mouse models (n 7 per group) postcorresponding treatment. **P 0.01 nanoagonist plus PTX versus PTX alone. PTX: Paclitaxel; TMZ: temozolomide.DiscussionIn an ex vivo study, TJ breakdown in glioma frompatients was evident with a disrupted paraendothelial profile and down-regulated expressionlevel of ZO-1. Glioma cells aggressively invadedneighboring brain tissue by inserting themselves intothe perivascular space between the astrocytic endfeetand the endothelium of pre-existing blood vessels,thus disrupting astrocyte-vascular coupling andresulting in a loss of TJ integrity [18]. To the best ofour knowledge, this work, for the first time, revealedthe unspoiled ZO-1 profile in the marginal region ofboth HGG and LGG, indicating the existence ofuncompromised TJs even in the most malignantglioma. The data highlighted the necessity to deliverchemotherapeutics intoglioma margins byovercoming uncompromised TJs.Current BBB opening strategies can be roughlyclassified into physical and chemical approaches.Hypertonic chemicals such as mannitol have beenused to disrupt the TJs and increase BBB permeabilityby inducing osmotic pressure between the vascularwalls. However, the non-specific BBB breakdownleads to potential risks such as epileptic seizures andvasogenic edema. Focused ultrasound (FUS) has beenintensively investigated to locally disrupt BBB [19].Even though this strategy significantly increased thetherapeutic efficacy of gliomas, the limited focal depth( 3 cm), the requirement for image-guidance and thethermally induced irreversible BBB recovery need tobe overcome. Therefore, specifically and safely tuningBBB permeability is crucial for improving thetherapeutic efficiency of gliomas. Compared withhypertonic agents and MB-FUS breaking TJs viaexternal force, the nanoagonist modulates TJ tightnessby amplifying the endogenous A2AR signalingcascade. Our previous study showed that the brainuptake of a radioactively labeled dextran (45 kDa) as amacromolecular model drug increased 6.8 times afterpretreatment with the nanoagonist [13]. Additionally,the BBB opening time window could be tuned in arange from 30 min to 4 h by adjusting the agonisticdomains labeled on the dendrimer. Furthermore, thenanoagonist-modulated BBB permeability reversiblywithout disrupting the neurovascular units.Pathological symptoms including hemorrhage andedema induced by uncontrollable vascular leakagewere not observed after nanoagonist treatment [14].Thus, nanoagonist-mediated A2AR signaling is apromising strategy to increase brain drug deliverywith high efficiency and safety.AlthoughtheprecisemechanismofA2AR-mediated BBB permeability alteration remainsunclear, A2AR activation up-regulates Rho-associatedprotein kinase (ROCK) activity, which inhibits MLChttp://www.thno.org
Theranostics 2018, Vol. 8, Issue 11phosphatase (MLCP) and thereby promotes thephosphorylation of MLC [20]. MLC phosphorylationpromotes the conversion of short F-actins to ASFwhose centripetal tension weakens para-endothelialconnectivity, disassembles TJ proteins and finallyenhances BBB permeability [21]. Both regadenosonand nanoagonist led to an increased F/G-actin ratioand MLC phosphorylation level but reducedTJ-associated protein level in the endothelialmonolayer. The above phenomena indicate that boththe nanoagonist and small-molecule agonists inducedstress fibre formation and TJ opening via A2ARsignaling. Notably, the nanoagonist tuned the TJintegrity in a more pronounced manner than thesmall-molecule agonist. The multivalent associationbetween the nanoagonist and dimeric or evenoligomeric A2AR complexes could amplify ogical responses [22].The expression levels of both A2AR and β3integrin were found to be high in the vasculature ofhigh-grade glioma but low in peritumor control braintissue, indicating the feasibility to specifically tuneBBB permeability in glioma patients. Regadenoson, apurine nucleotide derivative approved by the FDA asa coronary vasodilator, was selected as an agonisticagent due to its high selectivity to A2AR (13-foldagainst A1R and 35-fold against A2BR) [23]. Thec(RGDyK) peptide was chosen as a targeting ligand toαvβ3 integrin because of its high affinity (1.3 nM) [24].Considering the stronger association between thec(RGDyK) peptide and αvβ3 integrin than thatbetween regadenoson and A2AR (290 nM), thenanoagonist first targets the αvβ3 integrinover-expressed in the neovasculature, which isabundant in the glioma margin. The increased localconcentration of the nanoagonist activates endothelialA2AR and then specifically up-regulates peri-tumoralBBB permeability. A higher T/B ratio of nanoagonistthan that of Den-Reg and Den-PEG in fluorescenceimaging verifies the targeting specificity of thenanoagonist.DCE-MRI has been applied to non-invasivelyevaluate BBB permeability alterations, in which MRsignal changes, as a result of contrast agent leakageinto the extracellular extravascular space, could bedynamically monitored [25, 26]. The time-slot forchemotherapeutic injection was optimized at 45 minpost nanoagonist administration when the averageKtrans value was high in the glioma margin but low insurrounding normal brain tissues. The benefit of thisimage-guided drug delivery strategy was confirmedby timing PTX administration post nanoagonistmediated BBB opening. The combined treatment notonly remarkably increased the therapeutic response of3134PTX, achieving a longer survival than TMZ, thefirst-line chemotherapeutic treatment for gliomas, butalso prevented the cytotoxic effect of PTX to normalbrain tissue. Estimation of the arterial input function(AIF) is the key to accurately determining BBBpermeability via DCE-MRI. Direct measurement ofAIF from large vessels by blindly estimating the tissueconcentration time curves (CTCs) is a mainstreamapproach. Although the MRI signal from the largevessels is less susceptible to partial volume effect, itindeed succumbs to the T2* effect of the contrastagent, leading to artificial concentration calculations.Additionally, the actual AIF differs from CTC of largevessels due to dispersion of the contrast agent duringtransportation from the aorta to tissues or from tissuesto the veins. The problem is more severe because ofthe vascular tortuosity in the tumor. In this work, weused a multiple reference tissue method that couldestimate the specific AIF for a group of voxels with noconstraints on mathematical modeling of AIF but onlyits smoothness. In this way, the fitting errors of CTCscould be minimized, and a more accurate calculationof dynamic parameters could be achieved.ConclusionThis work shows the existence of intact tightjunctions in the margins of both LGG and HGG frompatients. Therefore, a drug delivery strategy toincrease BBB permeability in the glioma margin isrequired to improve therapeutic efficiency andattenua
HGG and control brain tissue sections are presented in Figure S1. Neurons, glial cells and vascular endothelial cells distributed dispersedly and were well-organized in control human brain tissues. In the LGG margin, the cells distributed with slightly a higher densi