Transcription
Street Lighting and Blue LightFrequently Asked QuestionsFebruary 2017Prepared for:Solid-State Lighting ProgramBuilding Technologies OfficeOffice of Energy Efficiency andRenewable EnergyU.S. Department of EnergyPrepared by:Pacific Northwest NationalLaboratory
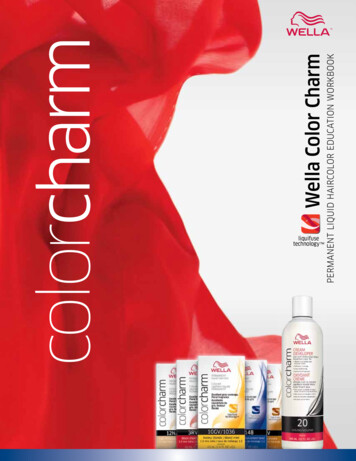
Street Lighting and Blue Light – Frequently Asked QuestionsThese frequently asked questions (FAQs) have been assembled in response to ongoing discussion of theJune 2016 American Medical Association (AMA) public release, Guidance to Reduce Harm from HighIntensity Street Lights, which presented a number of recommendations related to possible health risksof increased short-wavelength content of outdoor lighting sources, with a particular focus on thecontinuing widespread conversion of older products to LED. The issues raised in the AMA guidance arecomplex, arising from new science and new lighting technology that are often misunderstood andmisreported. These FAQs are intended to provide factual information and some clarity to the ongoingdiscussion in a format readily accessible to a general lighting audience.Basics and terminologyWhat is “blue light”?“Blue light” is a term often used as shorthand to describe a variety of ranges of wavelengths that playkey roles in the health issues raised by the AMA. But the term can lead to confusion, because there’s noconsensus definition of blue light; light colors vary along a continuum, and there’s no single, discretedefinition of blue or any other color. For the sake of accuracy, it’s important that any time the term“blue” is used, it’s clearly defined, since different ranges of the spectrum apply to different concerns.Figure 1 provides a list of definitions of blue and other spectral colors from four different referencedocuments. Together, these documents categorize blue light as falling somewhere in the range from424 nm to 500 nm, but the specific ranges reported differ significantly. 1Figure 1. Wavelength ranges for monochromatic light as reported in four source documents. Source: http://physics.info/color/.1Source: http://physics.info/color/1
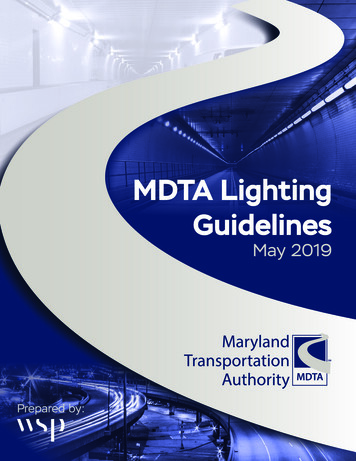
“Blue light” is also a term sometimes used by astronomers to describe lighting wavelengths that arescattered in the atmosphere at night and result in skyglow that interferes with the observation andappreciation of night skies. Along these lines, the Cégep de Sherbrooke, a Canadian university with afocus on astronomy and atmospheric science, broadly defines the blue range as 405-530 nm andrecommends a metric called “% Blue,” which sums the radiant power in that range, dividing by the totalpower emitted between 380 and 780 nm. 2None of the cited ranges for blue are more definitive than others, which means that generic terms suchas “blue light,” “blue-rich LEDs,” and “blue content” are not very specific and in fact can be misleading,given that the term “blue” itself is not a defined quantity in terms of spectrum, visual outcome, ornonvisual outcome.Moreover, the associated health and other impacts under discussion are caused by particularwavelengths of light, not by colors. The relevant wavelengths for any given effect don’t necessarilycoincide with what the human eye perceives as a particular color. The effects linked to “blue light” in theAMA release, for example, in actuality extend into violet, indigo, cyan, and green. Referring only to blueincorrectly discounts the effects of these other wavelength regions.These FAQs thereby avoid use of the term “blue light,” except where necessary to address specific useof the term in public media.What is a spectral power distribution (SPD)?The spectral power distribution (SPD) of a light source is the amount of radiant power it emits atdifferent wavelengths across the visible spectrum. An SPD can be represented as a table of radiantpower values, or as a graph similar to those in Figure 2. In addition to determining the apparent color ofthe light, the SPD determines how the source affects the appearance of objects it illuminates, as well asits potential scattering characteristics within the atmosphere 3 and the potential for associated healtheffects (such as those brought up in the AMA guidelines). The SPD is the fundamental light-sourceinformation used in color science.SPDs can vary widely, even within a given light-source technology. Two metal halide lamps that havecorrelated color temperatures (CCTs) of 4000 K can have very different SPDs, for example, as shown inFigure 2. This is also true of LED products, so it’s important to keep in mind that no single SPD is entirelyrepresentative of a given light-source e.qc.CA/app/en/homeThis FAQ focuses primarily on potential health consequences of light at night. Discussion of the relationshipbetween light at night and sky glow will be addressed separately by DOE in a forthcoming report.32
Figure 2 Two 4000 K metal halide SPDs showing variability in wavelength content, with one high-pressure sodium SPD forcomparison.What is correlated color temperature (CCT)?Most white-light sources emit a range of wavelengths, which, when combined, produce the color of lightperceived by the human eye. Correlated color temperature (CCT) is a shorthand way to describe thelight’s color, in terms of its apparent “warmth” or “coolness.” CCT is expressed in kelvin (K), and thevalue corresponds to the color of light emitted by a heated mass (a theoretical blackbody radiator) atthat physical temperature (although the light source is not actually operating at that physicaltemperature). So an LED with a CCT of 3000 K will appear to give off a color of light close to that of atungsten filament operated at a physical temperature of 3000 K (tungsten being very close to an idealblackbody radiator). The challenge is that light sources with very different SPDs can have the same CCT,as illustrated by the two 4000 K MH products in Figure 2. Similarly, sources with the same CCT can lookdifferent. For this reason, CCT is only a rough gauge of the actual spectral content of a light source. Formore information, see the LED Color Characteristics Fact Sheet.What are the five types of photoreceptor in the human eye, and what is an action spectrum?There are five currently recognized photoreceptors in the human eye. These include three differenttypes of cone photoreceptors, which are responsible for color and detail vision under well-lighted (orphotopic) conditions. The different types of cone receptors are distinguished by their comparativesensitivities to short-, medium-, and long-wavelength light. In addition to the cones, there are rods,which provide monochromatic vision under low lighting (or scotopic) conditions. Rods are responsible3
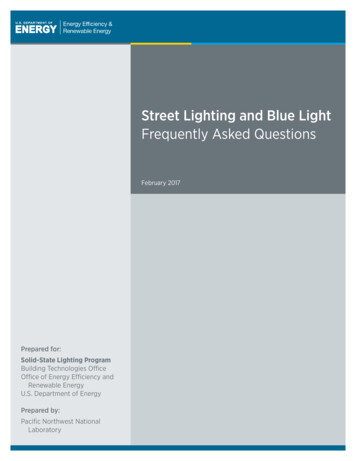
for vision at low light levels but don’t detect color or detail. The eye’s aggregate sensitivity shifts towardshorter wavelengths under scotopic conditions compared to photopic conditions (Figure 3). There arealso the recently discovered intrinsically photosensitive retinal ganglion cells (ipRGCs), which are crucialfor relaying light information to parts of the brain controlling the biological clock.4 Relevant primarily tocircadian physiology, pupil dilation, and other nonvisual effects, the ipRGCs contain melanopsin, aphotopigment that has a peak photosensitivity at 480 nm. For a variety of reasons, the peak responseof the ipRGCs in vivo appears to be at about 490 nm,5 though this value is still being refined.Figure 3 shows the spectral sensitivity (or action spectra) for each of the five known types ofphotoreceptors, which combine in various ways to allow for visual and nonvisual processes. Themechanisms underlying some of these processes are well-known, such as how the three conephotoreceptors provide for the perception of color; whereas other mechanisms, such as those involvingthe body’s circadian systems, are only beginning to be understood. Importantly, the responses of thephotoreceptors are not static, but change based on the amount and duration of light present.6 The roleof ipRGCs at various light levels is still being investigated. The response of the ipRGCs is usually referredto as the melanopic response.4Lucas RJ, Peirson SN, Berson DM, Brown TM, Cooper HM, Czeisler CA, Figueiro MG, Gamlin PD, Lockley SW,O'Hagan JB, Price LA, Provencio I, Skene DJ, Brainard GC. 2014. Measuring and using light in the melanopsin age.Trends in Neurosciences, 37(1), 1-9.5CIE. 2015. TN 003:2015: Report on the First International Workshop on Circadian and NeurophysiologicalPhotometry, 2013.6Joshua J. Gooley, Kyle Chamberlain, Kurt A. Smith, Sat Bir S. Khalsa, Shantha M. W. Rajaratnam, Eliza Van Reen,Jamie M. Zeitzer, Charles A. Czeisler, and Steven W. Lockley. Exposure to Room Light before Bedtime SuppressesMelatonin Onset and Shortens Melatonin Duration in Humans. J Clin Endocrinol Metab. 2011 Mar; 96(3): E463–E472.4
Figure 3. Spectral sensitivity (action spectra) of the five known human photoreceptors, along with Vλ, the photopic responsecurve used to define and quantify lumen output from a light source. Data from CIE TN 003:2015.As it pertains to the issues related to “blue light,” the corresponding melanopic action spectrumencompasses a wide range of wavelengths that extends well beyond the nominal definitions of “blue.”In other words, while some portion of the melanopic response occurs with short wavelengths that aretypically recognized as blue, it’s also influenced by colors outside of those wavelengths. Furthermore, itshould be noted that ipRGCs don’t act in isolation when it comes to influencing the biological clock; thatis, the rods and cones also play a role, although the full extent of their contributions is not fullyunderstood at this point. 7How do LEDs create white light?The most common white LEDs today employ blue-pump LED chips that, at the chip level, produce anSPD peak centered somewhere in the range of about 445 to 465 nm. Light from the LED chip passesthrough a phosphor layer that converts most of the chip’s output into longer wavelengths, typically inthe green, yellow, orange, and red parts of the spectrum. The mix of these colors produces white light.However, there are other methods of producing white light, which are less common but offer greaterflexibility for adjusting the SPD. One such method is to combine LEDs of different colors – such as7Lucas RJ, et al, op cit.5
phosphor-converted LEDs (PC-LEDs) in combination with other LEDs that emit specific colors (see Figure4) – or to combine multiple LEDs of various colors, which can be varied in relative output to attain anyapparent color of light desired. Systems offering dynamic adjustability tend to be more expensive andthus have been employed less frequently in street lighting and other outdoor applications to date.Figure 4. PC amber-cyan-violet flat lens chip array (ledengin.com).Health concernsWhy is so much attention being paid to “blue light” right now?In the last two decades, the medical research community has learned much about light’s role in thephysiology of plants and animals, 8 some of which has focused on the influence of short-wavelengthlight. Researchers have demonstrated, for example, the ability of such light to affect circadian rhythm(the 24-hour “biological clock”). Humans and other organisms have evolved this biological response toregular periods of daylight and darkness. In the early 2000s, researchers were able to identify a class ofpreviously unknown photoreceptors, the ipRGCs (see “What are the five types of photoreceptor in thehuman eye, and what is an action spectrum?”) that links directly to parts of the brain outside the visualcortex. 9 The peak sensitivity of this type of photoreceptor in a 32-year old male is at approximately 490nm, with the raw sensitivity of its photopigment (melanopsin) at around 480 nm. 10 Both of these peaksfall at the upper end of the range commonly described as “blue.”Simultaneously with the rise in our understanding of nonvisual photoreception, LEDs have emerged as aviable light source for general illumination. Because of the rise in use of white LEDs for outdoor lighting,and their relatively greater short-wavelength content compared to the high-pressure sodium (HPS)products they’re typically replacing, concerns have arisen that the potentially increased presence ofshort wavelengths in the night environment may be detrimental to health.8For a review, see Lucas RJ, et al, op cit.Berson DM, Dunn FA, Takao M. 2002. Phototransduction by retinal ganglion cells that set the circadian clock.Science 295(5557):1070-3.Hattar S, Liao HW, Takao M, Berson DM, Yau KW. 2002. Melanopsin-containing retinal ganglion cells: architecture,projections, and intrinsic photosensitivity. Science 295(5557):1065-70.10CIE. 2015. TN 003:2015: Report on the First International Workshop on Circadian and NeurophysiologicalPhotometry, 2013.96
However, it’s important to note that the spectral content of LEDs can be engineered to provide anyaction spectrum desired – for example, to provide more ipRGC stimulation, or less of it. Thischaracteristic has also contributed to the discourse of how LEDs could help –or harm – lighting users.What are the specific lighting-related health concerns that have been raised?Two examples, taken together, summarize the issues. One source concluded:“These findings indicate that room light exerts a profound suppressive effect onmelatonin levels and shortens the body’s internal representation of night duration.Hence, chronically exposing oneself to electrical lighting in the late evening disruptsmelatonin signaling and could therefore potentially impact sleep, thermoregulation,blood pressure, and glucose homeostasis.” 11Another summary of the issues as of 2013 reported:“It is now clear that electric lighting, including indoor evening light levels, has strongeffects on human circadian rhythms in physiology, metabolism, and behavior. Recentexperimental evidence in humans has shown, for example, that the lighting commonlyused in the typical home in the evening is enough to delay melatonin onset and blunt itsnocturnal peak (36). Even the display screens of personal computers, which often emitlight rich in the blue portion of the visible spectrum, can alter melatonin production inthe evening (41). It is not certain that these alterations can, in fact, increase breastcancer risk; that evidence is accumulating but is not yet conclusive. However, chronicdisruption of circadian rhythmicity has the potential to yield serious long term healthconsequences.” 12Is short-wavelength light harmful to the eyes?This question refers to the risk of physical damage to the retina as a result of direct exposure to shortwavelength light, and is separate from the circadian-disruption concerns that are the main focus of theAMA guidelines. In typical situations using common electric light sources, there is no danger to the eyesfrom short wavelengths, regardless of the source type. The DOE Fact Sheet Optical Safety of LEDs makes11Gooley et al, Conclusions.Richard G. Stevens, PhD, George C. Brainard, PhD, David E. Blask, PhD, MD, Steven W. Lockley, PhD, and Mario E.Motta, MD. Breast Cancer and Circadian Disruption from Electric Lighting in the Modern World, CA Cancer J Clin.2014 May; 64(3): 207–218.127
this clear and provides a detailed description of retinal hazards posed by lighting in more specializedsituations, along with references to international standards on the safe use of lighting products. 13Why not remove shorter-wavelength emissions from our outdoor light sources?Short wavelengths are a fundamental component of the visible spectrum and have their benefits,ranging from aesthetics to safety. White light sources containing short-wavelength light generallyrender nighttime colors more similarly to daylight, aiding in identification (e.g., of vehicles, clothing,people) and improving contrast between an object (e.g., road debris) and its surroundings. Shortwavelengths are also acknowledged (e.g., in IES TM-12 Spectral Effects of Lighting on Visual Performanceat Mesopic Lighting Levels) as providing enhanced peripheral vision at the low levels of illuminancetypically associated with street lighting. Researchers have found improvements in detection thresholdand reaction times in simulated outdoor viewing tasks under light sources with broader spectra andbetter color rendering properties; these improvements occurred when target light levels were in themesopic vision range (i.e., at typical street lighting levels). 14 It stands to reason that improved visualperformance can bring associated safety benefits.However, there are some instances where the benefits of omitting the short wavelengths outweigh anydetriments from doing so – for example, in areas harboring endangered species that are particularlyaffected by short wavelengths. In such situations, it’s possible to engineer the SPD of the light source toprecisely match the need. This is especially true with LEDs, whose spectra are more easily manipulatedthan those of most conventional light sources.What factors contribute to potential health concerns about light at night?Spectrum, light level measured at the eye, duration of exposure, and timing of exposure relative to anindividual’s circadian cycle are believed to be the principal contributing factors to light’s effects onhealth. 15 (See also “Are some wavelengths of more concern than others?”) The underlying issues arecomplex and involve factors that are sometimes interrelated, and sometimes external to the lightingsystem.Are any of the factors that are related to health concerns about light at night unique toLEDs?None of the factors or concerns raised are unique to LEDs. At the same given wavelength, there is nodifference between a radiant watt of light emitted by an LED and one emitted by any other type of lightsource. What varies between sources is the particular combination of wavelengths in the overall output,13For example, IES RP-27.1-05, Photobiological Safety for Lamps and Lamp Systems - General Requirements.AL Lewis (1999). “Visual Performance as a Function of Spectral Power Distribution of Light Sources atLuminances Used for General Outdoor Lighting,” Journal of the Illuminating Engineering Society, 1999. 28(1): p.37–42.15CIE TC3-46-2016: Research Roadmap for Healthful Interior Lighting Applications.148
and the relative amount of radiant power at each wavelength. In addition to LEDs, all conventionalwhite light sources used for street lighting (mercury vapor, metal halide, fluorescent, induction) haveSPDs with a greater proportion of their radiant power in short wavelengths than do the orange HPSsources that have dominated street and roadway lighting over the last several decades.How do light-exposure levels from street lighting compare with those from other sources?All light at night can potentially contribute to the biological responses and related health concernsdescribed in these FAQs, to varying degrees. At least two journal articles, for example, note that theprimary concern about the effects of light at night on human health is driven by interior light levels inhomes and workplaces, 16 17 although exterior sources can also play a role if people (or other livingorganisms) are exposed to high enough light levels for sufficiently long durations. If the intensity andduration are identical, white light sources with higher proportions of short wavelengths (typicallycharacterized as higher melanopic content) are more of a concern in this respect than are orange oramber sources with lower proportions of short wavelengths. The exact wavelengths of concern dependon the specific action spectrum. Because research is still ongoing, melanopic content is presently used asa proxy for most health concerns related to light at night.Table 1 lists a few relevant characteristics of various lighting products used in both interior and exteriorapplications, including some products that are available at different CCTs. The “% Blue” column in thetable divides the radiant power delivered in the wavelengths between 405 and 530 nm (a range used forsimilar purposes in a number of published reports pertaining to sky glow 18) by the total radiant powerdelivered from 380 to 780 nm (approximately the visible spectrum) for each light source. The melanopiccontent of a light source, listed in the last column, is the source spectrum weighted by the spectralefficiency of the ipRGCs (see “What are the five photoreceptors in the human eye?”), and is an indicatorof the source’s potential to stimulate a melanopic response (i.e., a response by the ipRGCs).Values in the table are normalized first to a uniform lumen output, to enable “apples to apples”comparisons among sources; and then, in the last two columns, the values are normalized relative toHPS to illustrate impact compared to the most common incumbent type of street lighting. The table listsvalues of % Blue, Relative Scotopic Content, and Relative Melanopic Content for a number of specificlight sources. LED sources are shown with a range of values, because at any given CCT there are manyLEDs with varying spectra. Conventional light sources are all listed with single values rather than a range,but they, too, would be most accurately characterized with some amount of variability.16Richard G. Stevens, PhD, George C. Brainard, PhD, David E. Blask, PhD, MD, Steven W. Lockley, PhD, and Mario E.Motta, MD. Breast Cancer and Circadian Disruption from Electric Lighting in the Modern World. CA Cancer J Clin.2014 May; 64(3): 207–218.17Joshua J. Gooley, Kyle Chamberlain, Kurt A. Smith, Sat Bir S. Khalsa, Shantha M. W. Rajaratnam, Eliza Van Reen,Jamie M. Zeitzer, Charles A. Czeisler, and Steven W. Lockley, 2010. Exposure to Room Light before BedtimeSuppresses Melatonin Onset and Shortens Melatonin Duration in Humans. J Clin Endocrin Metab.doi:10.1210/jc.2010-209818Percent blue calculated according to LSPDD: Light Spectral Power Distribution c.CA/app/en/home9
Importantly, reducing the total luminous flux from a light source (e.g., by 50%, as is common whenconverting from HPS to LED streetlights) reduces the melanopic content by that same amount (i.e., by50% in this example). Proper application of the values in Table 1, then, must also account for pre- andpost-installation light output, in order to accurately compare pre- and post-melanopic content.Table 1. Characteristics of Various Light SourcesRowABCDEFGHIJKLMNOPQRSTUVWXLight sourcePC White LEDPC White LEDPC White LEDPC White LEDPC White LEDPC White LEDPC White LEDPC White LEDNarrowband Amber LEDLow Pressure SodiumPC Amber LEDHigh Pressure SodiumHigh Pressure SodiumMercury VaporMercury VaporMetal HalideMetal HalideMetal HalideMoonlightIncandescentHalogenF32T8/830 FluorescentF32T8/835 FluorescentF32T8/841 FluorescentLuminousFlux CCT 92041692437253145400240414681 †28362934294034803969% Blue*17% - 20%18% - 25%22% - 27%27% - 32%31% - 35%34% - 39%39% - 43%43% - ative ScotopicContent1.77 - 2.201.89 - 2.392.04 - 2.732.10 - 2.652.35 - 2.852.60 - 2.892.77 - 3.313.27 - 232.282.022.372.58Relative MelanopicContent**1.90 - 2.682.10 - 2.992.34 - 3.572.35 - 3.402.75 - 3.813.18 - 3.743.44 - 4.524.38 - 732.812.292.873.18* Percent blue calculated according to LSPDD: Light Spectral Power Distribution c.CA/app/en/home** Melanopic content calculated according to CIE Irradiance Toolbox, http://files.cie.co.at/784 TN003 Toolbox.xls, 2015Source: MSSLC Light Post uly-2016)† Moonlight CCT measured and provided by Telelumen, LLC.Key: PC – Phosphor Converted; LED – Light Emitting DiodeAre some wavelengths of more concern than others?Medical research has identified an action spectrum of wavelengths having the potential to stimulateipRGCs (see “What are the five types of photoreceptor in the human eye, and what is an actionspectrum?”). Although the reported profile of ipRGC photosensitivity varies a bit among research10
groups, the U.K.’s University of Manchester convened a workshop in 2013 to seek consensus, 19 and thiswas followed by a CIE Technical Note in 2015, which included an approximate photosensitivityrepresented by the curve shown in Figure 5. The action spectrum is centered on 490 nm and extendsfrom approximately 380 to 600 nm. Hence, green and other nominally labelled color groups alsocontribute to the melanopic content of a light source, which explains why even the SPD for HPS, asshown in Figure 2, has potential for stimulating the ipRGCs. Likewise, metal halide, incandescent, andfluorescent sources all possess levels of melanopic content that are determined by their particular SPDs.Figure 5. Melanopic action spectrum. Source: CIE TN 003:2015, Report on the First International Workshop on Circadian andNeurophysiological Photometry, 2013, published 2015.What about the “blue spike” in LED SPDs? Does it suggest an above-average content ofshort wavelengths?Plots of SPDs can be confusing, and the narrow peak in LED curves can be easily misinterpreted assuggesting an unusually high “blue light” content. SPDs for phosphor-converted LEDs do generallyexhibit a local peak in the short-wavelength region of the spectrum, typically centered near 450 nm formost blue-pump products, as can be seen in Figure 6. Note, however, that the chart on the left in Figure6 is portrayed in relative power terms (i.e., on a percentage scale where the maximum value is drawn at100% and the magnitudes of other wavelengths are displayed relative to that value). A critical elementnot conveyed in this common plotting format is the absolute magnitude, or total quantity, of thatradiant power, in radiant watts, which is displayed in the chart on the right of Figure 6 for the very sameproducts. The red line in both charts displays an incandescent SPD for comparison, and all threeproducts (two LED, one incandescent) have the same nominal CCT of 2800 K.19Lucas RJ, et al, op cit.11
The absolute magnitudes of radiant power values determine both the lumen output and melanopiccontent of a given product. Relative values, in contrast, are independent of lumen output. As anillustration, one of the products on the left in Figure 6 might be emitting 10 lumens and another one10,000 lumens, and there’s no way of discerning that difference from this format. The relative format byitself is thus of limited use in comparing any two actual light products in terms of their melanopiccontent or any other “real-world” characteristics.Melanopic action spectrum peaks hereFigure 6. SPDs for two LED products displayed in terms of both relative (left) and absolute (right) magnitude of radiant power(W/nm). The red line displays an incandescent SPD. All products are nominal 2800 K CCT. The absolute magnitude plots on theright are normalized for lumen output.It’s also important to note where the peak in the short wavelengths occur. The LED “blue spikes” inFigure 6 occur some distance away from the peak of the ipRGC action spectrum (which was shown inFigure 3), indicated here by the arrow at 490 nm. In fact, the radiant power of the LEDs is in a trough atthis point. In comparison, the incandescent source exhibits a significantly higher amount of radiantpower at this particular wavelength, which explains why the incandescent listed in Table 1 (Row “T”)shows a higher melanopic content than the majority of the LED products at 3000 K (Row “B”), eventhough the latter are at higher CCT. In fact, the melanopic content of the incandescent falls roughly inthe midpoint of the range listed for LED products at 4000 K CCT (Row “D”). Such a result is likely to comeas a surprise, based on a first impression derived from viewing the chart on the left in Figure 6.Are brightness and glare particular problems for LED?Glare and perceived brightness are both related to the spectral content, light output, and optical designof a luminaire, as well as the perception of the viewer. For a variety of reasons that haven’t beenentirely identified by the lighting research community, the same installation may be perceived quitedifferently by different viewers.A common approach in the early implementation of LED lighting products was to replace incumbent HPSproducts on an equivalent average illuminance basis. This often resulted in an overly bright appearance,12
according to typical comments received at the time. 20 Such early feedback compelled city engineers toreduce the target light levels when using LED products, which largely eliminated the correspondingcomplaints. LEDs can still appear bright and/or glaring if the observer has a direct view of them,however – especially from viewing angles near the streetlight’s maximum intensity.Among the factors influencing a perception of glare are the luminance of a given object, the apparentsize of the object, the luminance of the background, the position of the object with respect to theobserver’s line of sight, and the pattern of luminance across the light-emitting surface. While all lightingsources can potentially cause glare, the small surface area of LEDs translates into a high luminance thatcan emphasize this characteristic if not sufficiently addressed in the luminaire’s design. Fortunately, themanufacturers of quality lighting products – LED and traditional – have developed a number ofapproaches for mitigating glare. With LED sources these approaches often involve limiting direct viewingof the LEDs – for example, using diffusing materials or wave guides to reduce luminance by increasingthe apparent size of the emitting area – but use other methods as well, such as limitin
Street Lighting and Blue Light Frequently Asked Questions February 2017 Prepared for: Solid-State Lighting Program Bui