Transcription
Business Modelsfor Distributed EnergyResources:A Review andEmpirical AnalysisAn MIT Energy Initiative Working PaperApril 2016Scott P. Burger1*sburger@mit.eduMax Luke1*Corresponding authorMIT Energy Initiative and MIT Institute for Data, Systems and Society, Massachusetts Institute of Technology, USA1MIT Energy Initiative, 77 Massachusetts Ave., Cambridge, MA 02139, USAMITEI-WP-2016-02
AbstractThis paper presents a novel, empirical analysis of the most common business models for the deployment of distributedenergy resources. Specifically, this research focuses on demand response and energy management systems, electricity andthermal storage, and solar PV business models. We classify the revenue streams, customer segments, electricity servicesprovided, and distributed energy resources leveraged for 144 business models. We use this empirical assessment to identifya limited set of business model archetypes in each distributed energy resource category. Within each archetype, concreteexamples of individual business models are presented, along with notable exceptions or extensions of these business models.Our review leads us to five key takeaways regarding the structure of distributed energy resource business models. First,business models can be classified into a discrete number of archetypes based on common characteristics. This clusteringindicates that there are factors that contribute to the success or failure of a business model that cannot be captured inreviews of business model structures (for example, company culture, or factors linked to execution). Second, as anticipated,regulatory and policy environment is a significant, if not the most significant driver of business model structure. Third,business models are not static with time – technological, policy, and regulatory developments all drive changes in acompany’s business model. Finally, business models compete for the provision of a limited set of commodity electricityservices. This observation leads two final conclusions. Structures (such as markets) should be encouraged to allowcompetition among service providers and efficient solutions to emerge; additionally given that these business models arefundamentally competing for the provision of commodity services, differentiation beyond price will be difficult to realize.Keywords: Business Models; Distributed Energy Resources (DERs); Solar; Photovoltaics; Demand Response; EnergyStorage; Business Model Ontology; Energy Services.aCorresponding author. MIT Energy Initiative and MIT Institute for Data, Systems, and Society, Massachusetts Institute ofTechnology (MIT), 77 Massachusetts Ave., Cambridge, MA 02139, USA. Tel: 1 512-751-5450. Email: sburger@mit.edu.bMIT Energy Initiative and MIT Institute for Data, Systems, and Society, Massachusetts Institute of Technology (MIT), 77Massachusetts Ave., Cambridge, MA 02139, USA. Tel: 1 512-751-5450. Email: mluke@mit.edu.1
Business models for distributed energy resources: a review and empirical analysis1INTRODUCTION“It would be foolish to dismiss the potential for major changes in the utility business model.”-Theodore Craver Jr., CEO, Edison International [1]Craver, the CEO of the U.S.’s second largest utility and chairman of the Edison Electric Institute, the tradeorganization representing U.S. utilities, 1 is not alone in his belief that the utility business model is on thethreshold of dramatic change. A 2013 survey found that 94% of the senior power and utility executivessurveyed “predict complete transformation or important changes to the power utility business model” by 2030[2]. These changes are being driven primarily by the influx of distributed energy resources (DERs), includingsolar photovoltaics and other distributed generation, thermal and electrical energy storage, and more flexibleand price-responsive management of electricity demand. Many predict that the changes driven by DERs willbe highly disruptive to the electricity sector, and that, without adaptation, incumbent utilities 2 risk fallinginto a “death spiral” that threatens their financial viability [3,4]. While some industry analysts see changesto utility business models occurring in years to come, some of the world’s largest incumbent utilities aretaking action today; for example E.ON, Germany’s largest utility, and NRG Energy, one of the U.S.’s largestpower producers, each announced major structural changes to their business models, selling off billions ofdollars in assets, and developing new undertakings in distributed resources and renewable energy [5,6].Electricity infrastructure is considered uniquely critical due to its role as an enabler of other economicfunctions and sectors [7]. The bankability of electric utilities is key to the effective management,maintenance, and expansion of the trillions of dollars of global critical electricity assets [4]. Further, a wellcrafted business model will, logically, have important impacts on the financial performance of a firm [8,9].Understanding the business models that are emerging in the power sector is therefore important, not only toincumbent utilities and new market entrants, but to the public at large.Given high profile business model shifts at organizations like E.ON and the importance of the viability ofelectricity services business models, many industry analysts have begun to speculate about what businessmodels will be leveraged to deliver electricity services in the future. In order to shed light on this discussion,this paper performs a novel empirical review and analysis of the business models for three of the most widelyEdison International is a holding company that owns both Southern California Edison and Edison Energy. Southern CaliforniaEdison is the second largest utility in the United States by revenue [97]. The Edison Electric Institute members represent roughly70% of the electric power industry [98].1In the U.S. context, the “utility” typically refers to the distribution system owner/ operator, whether in a traditional or restructuredenvironment. In European or other contexts, the term “utility” is often interpreted more broadly and refers to generators, networkcompanies, and other power sector firms involved in the supply of electricity. We adopt a broad definition of the utility, and use theterm to describe any company engaging in the provision of electricity services.22
Burger & Luke, 2015deployed distributed energy resources: solar photovoltaics, electricity and thermal storage, and demandresponse. We define the key value capture and creation components of 144 distributed energy businessmodels. We take an ontological approach, as proposed by Osterwalder and Pigneur [10], to define distributedenergy business models. As noted by Zott et al. [11], ontological definitions provide a “conceptualization andformalization of the elements, relationships, vocabulary, and semantics of a business model and which isstructured into several levels of decomposition with increasing depth and complexity.” The business modelontology deployed herein creates a structured framework with which to analyze and classify distributedenergy business models [12,13].For each business in our dataset, we define the electricity services provided, the revenue streams captured bythe provision of these services, the customers targeted, and the key DER resources used. The Osterwalderand Pigneur framework also includes the business models’ value proposition, key activities, cost structure,and key partners. We reviewed these components of the business models in our dataset, but do not include itin our results since in many cases the data is sparse, unavailable, or unreliable. We use data about electricityservices, revenue streams, customer segment, and key DER resource to define a small set of business model“archetypes” that describe common classes of many business models. While differences exist amongst thebusiness models in each archetype, each archetype shares a common set of features. For each archetype,concrete examples of active business models are provided.This paper proceeds as follows. First, we provide a brief review of the current literature on utility businessmodels. Second, we introduce the method by which our data was collected. Third, we provide an overview ofthe business models in our sample. Fourth, we define business model archetypes for the three largest DERcategories: demand response (DR) and energy management systems (EMS), electrical and thermal storage,and solar PV. Within this section we describe some of the interesting nuances that exist within eacharchetype. Finally, the paper concludes with a discussion of the results and directions for future research.The analysis presented in this paper leads to several key insights. First, despite the great number of businessmodels currently operating around the world, these business models can be classified into a discrete numberof archetypes. This clustering, combined with the diversity in performance of businesses within each cluster,indicates that there are factors that contribute to the success or failure of a business model that cannot becaptured in ontological reviews. Second, the regulatory and policy environment is a larger driver of businessmodel structure than technological differences or other factors. Third, business models are not static withtime – technological, policy, and regulatory changes all drive changes in the business model adopted by agiven company. Finally, business models compete for the provision of the same electricity services, indicatingthat structures (such as markets) should be encouraged to allow competition that will enable the most efficientsolutions to emerge.3
Business models for distributed energy resources: a review and empirical analysis2LITERATURE REVIEWLittle academic literature describing current or potential future utility business models exists. However, anumber of trends emerge from reviewing the existing academic, trade, and industry analyst literature. First,paradoxically, studies of business models often do not define either the utility business model or a businessmodel more broadly 3 [14–16]. Second, many studies define and explore a single business model or a smallset of business models associated with a single technology without exploring how these models may becompetitively positioned against other business models [17–21]. Finally, a number of studies performanalyses of a technology providing a limited set of electricity services, without exploring the full range ofservices that the technology is providing or may provide [17,18]. Traditional engineering or economicsdriven business model analyses tend to assume that business models are superfluous, because suppliers cansimply capture economic rents through the sales of services at competitive, market-based rates [22]. Indeed,business models flourish due to market imperfections that hinder the discovery of value, while engineeringanalyses assume that if value exists, a supplier will always deliver it and consumers will always pay for it[22].Only a small subset of business model studies have analyzed utility business models using an ontologicalapproach such as the one used in this paper, but none have done so using quantitative empirical methods.Several of these studies focus on a subset of business models that utilize a particular technology (e.g. seeSchoettl and Lehmann-Ortega [23] and Okkonen and Suhonen [24]). Richter [13] and Richter [12] usecase studies and surveys in combination with an ontological approach to develop an understanding of utilitybusiness models that utilize a variety of renewable energy technologies. Our paper builds upon the existingliterature by taking a data-driven approach to circumscribe and glean insights from the current distributedenergy business model landscape.3DATA COLLECTION METHODOur analysis includes a sample of 144 regionally diverse companies whose core business operations areassociated with one or more of three DER technology categories – demand response (DR) and energymanagement systems (EMS), electrical and thermal storage, and solar PV. Many of the companies in oursample rely heavily on information and communication technologies (ICTs) to enable communication to andMany of the early authors of business model literature failed to provide a definition of a business model as well. Of the studiessurveyed by Zott et al. 2011, 37% did not promulgate a definition of a business model, “taking its meaning more or less for granted.”34
Burger & Luke, 2015control of the DER resource of interest. However, given their ubiquitous nature, we do not include ICT as astandalone category in this analysis.Data for the companies used in this analysis were collected from publicly available news, academic, andindustry publications between February 2014 and October 2015. In order to ensure that the sample wasrepresentative of the “universe” of DER business models that exist today, we sampled from the CleantechGroup’s i3 database, a commercial database that contains information on more than 24,000 “clean tech,” DER,and sustainability-focused businesses [25]. We created three sets of companies from the i3 database – one foreach of the DER technology categories. The i3 database categorizes businesses by their core focus; we usedthis feature to create sets of all business models that were categorized as “ground-mounted PV,” “rooftop PV”(which together form the solar PV set), “grid energy storage,” 4 and “demand response.” We then drewstratified random samples from each of these three sets, such that the distributions of companies in our finalsample were similar to those of the i3 database in terms of company headquarter region and founding year.We sampled 50 companies in each of our three DER technology categories. A small number of the sampledcompanies did not fit our coding criteria, and thus were not included in our final sample.Tables 1 and 2 show the number of companies in our sample in each founding year bracket and in each region.These percentages are compared with the percentages that are found in the larger i3 database. As Tables 1and 2 show, the distribution of companies in our sample deviated from the relevant distribution of companiesin the i3 sample by no more than 5%.Table 1: Founding year of companies in sampleYearFounded1990 2015Total4Demand Response &Energy ManagementSystemsElectrical & ThermalStorageSolar ote that despite the name, this category also includes “behind-the-meter” energy storage companies, as discussed in Section 6.5
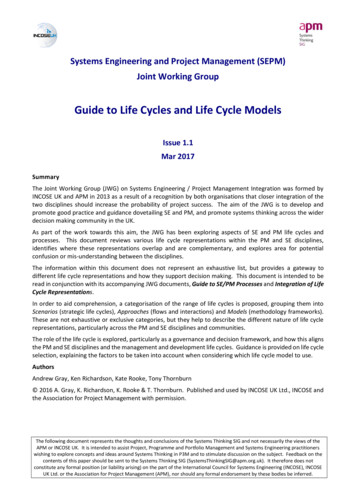
Business models for distributed energy resources: a review and empirical analysisTable 2: Headquarter region of companies in sampleRegionAfricaAsia PacificCentral &SouthAmericaEurope &IsraelMiddleEastNorthAmericaTotal4Demand Response &Energy ManagementSystemsElectrical & ThermalStorageSolar %67%2652%52%46100%100%48100%100%50100%100%OVERVIEW OF BUSINESS MODELSFigures 1-3 summarize the business models in our sample in terms of the services they provide (Figure 1),the customer segments they target (Figure 2), and the revenue streams that they leverage (Figure 3). EachDER technology category (i.e. demand response & energy management systems, electrical & thermal storage,and solar PV) is represented by a different color, and the size of each individual circle represents the numberof business models in a given service, customer segment, or revenue stream category. For the sake ofefficiency, these summary charts only show categories that contain four or more business models. Detailedanalyses of each DER category are provided in Sections 5-7. However, the summary data provided in thissection gives us some initial insights into the DER business model landscape.Figure 1 summarizes the electricity services provided by the business models in our sample. The vast majorityof business models in our dataset are either providing a mix of firm capacity and operating reserve 5 products,or providing energy. While operating reserve services are rather lucrative, the markets for these services arevery small (typically making up less than 4% of total energy costs) [26–28]. The intense competition for theprovision of operating reserve services could prove challenging for demand response and energy storagetechnologies. On the other hand, payments for firm capacity can be quite significant depending on desiredNote that operating reserves take different definitions depending on the system. This paper uses the terms primary, secondary, andtertiary operating reserves, which are corollaries to the European system of Frequency Containment Reserve (FCR), FrequencyRestoration Reserves (FRR), and Replacement Reserves (RR) respectively. See I. Pérez-Arriaga, “Managing large scale penetrationof intermittent renewables”, MIT Energy Initiative Symposium, 2011 for a review of various reserve taxonomies. Note however, thatthis review does not include the new European Network Codes, released in 2013 (i.e. FCR, FRR, and RR).56
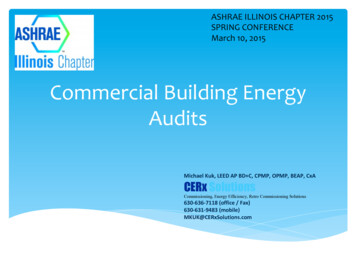
Burger & Luke, 2015reserve margins (for example, on the order of hundreds of dollars per megawatt-day and with a market sizeof tens of gigawatts in certain systems) [29,30]. As one might expect, the only business models in our datasetproviding energy in a distributed fashion are those that utilize solar PV. Where a business model is describedas providing “operating reserves,” the business can provide the range of primary, secondary, or tertiaryreserves; other business models may provide only a single type of reserves (notably, secondary reserves).Figure 1: Electricity Services SummaryFigure 2 summarizes the customers targeted by the business models in our sample. Business models that actas intermediaries between (and therefore service providers to) two agents are represented with a double-sidedarrow ( - ) connecting the two customer segments. Commercial, institutional, or municipal customers arerepresented by the abbreviation “C/I/M.” The customer segment “DER Provider” indicates that the companyis selling its products to businesses that then integrate one or more of these DERs at customer sites. The“Regulated Utility” customer segment refers to network companies – distribution, transmission, or both. Thiscustomer segment also refers to utilities that are vertically integrated such that they are also function as theload-serving entity. Figure 2 shows that the majority of business models are targeting end users directly. DRand EMS companies primarily target larger commercial and industrial customers, while the customer7
Business models for distributed energy resources: a review and empirical analysissegments targeted by solar PV and storage companies are more diverse. A smaller number of companies areselling services directly to regulated utilities or independent system operators (ISO). 6Figure 2: Customer Segment SummaryFigure 3 summarizes the revenue streams leveraged by the business models in our sample. Many companiesleverage multiple revenue streams. The structure of the revenue streams often depend on the customersegment(s) that is/are targeted. For example, many solar PV integrators offer consumers the option toThe role and structure of the system operator changes with from system to system. The system operator, referred to in all diagramswith the “ISO/ TSO/ RTO” tag, is the agent responsible for ensuring reliable bulk system operation through scheduling andprocurement of services such as operating reserves. The ISO/ TSO/ RTO tag indicates that the business is either selling bulk systemservices such as operating reserves to the system operator or that the business is selling services such as energy directly to bulk powersystem markets. While in the United States, power markets are operated by the system operator, in Europe, these markets are typicallyoperated by independent power exchanges. For the sake of conciseness, this has simply been represented as the ISO/ TSO/ RTO tag.68
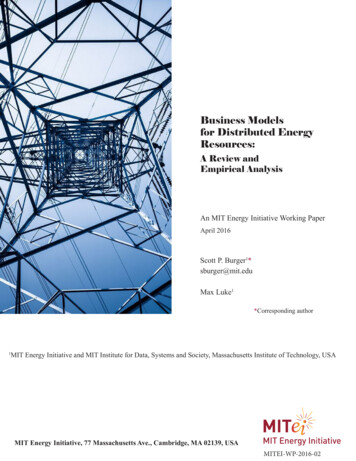
Burger & Luke, 2015directly purchase their systems, lease them (or sign a power purchase agreement – a related revenue streamdiscussed below), or take out a loan for the system. Notably, the vast majority of DR companies leveragesubscription fees or brokerage fees (or a combination thereof) for their services. Such brokerage fees aretypically structured as shared savings arrangements or as fees on payments earned in markets. Given thenascence of the storage market and the difficulties in predicting end user savings, storage business modelshave so far relied heavily on asset sales or financing.Figure 3: Revenue Streams SummaryUsing the same set of data as that presented in this section, the following sections explore each of the threeDER categories in much greater detail. For each of the three DER categories, the following sections define arelatively small set of business model “archetypes,” each encompassing many individual business models.These archetypes circumscribe the key value creation and capture components of the most common DERbusiness models that exist today.9
Business models for distributed energy resources: a review and empirical analysis5DEMAND RESPONSE & ENERGY MANAGEMENT SYSTEMS BUSINESSMODELSBusiness models for demand response and energy management systems have received increasing attention inrecent years [21,31]. Demand response (DR) encompasses a large category of technologies and applications.It refers to energy loads that can be adjusted to provide electricity services to the power system. DR can beautomatically activated in response to price signals, manually in response to a request from the DR business,or via an alternative dispatch signal [32]. Energy management systems (EMS) are computer-based systemsfor monitoring and controlling energy loads in buildings and are often critical components of demandresponse business models. DR can be thought of in three, not necessarily mutually exclusive, categories basedon the method of activation: reliability, economic, and pricing-based [33]. Reliability DR is typically activateddirectly by system signals and used in times of scarcity to prevent outages. Economic DR resourcesparticipate in energy markets or bilateral trading (and fulfill the associated requirements). Pricing-based DRresponds to energy or demand pricing signals (such as real-time pricing tariffs or critical peak pricingincentives) without participating in bilateral or multilateral energy markets.Figure 4 depicts the DR and EMS business model landscape. The figure shows the customers targeted(horizontal axis), services provided (vertical axis), and revenue streams leveraged (color) by business models.The size of each circle represents the number of business models within a given category.10
Burger & Luke, 2015Figure 4: Demand Response and Energy Management Systems Business Model TaxonomyFrom Figure 4, we can identify three major business model clusters, or archetypes, that share similarcharacteristics (i.e. that target similar customers and provide similar services). A brief description of each ofthose business model archetypes is provided below.5.1Market-based capacity and reserve DRThe majority of DR and EMS business models have emerged in restructured power markets [32,34,35]. Themarket rules that will determine the exact structure of products procured from DR business models varyfrom market to market [21,35]. However, a number of common, market-independent themes can be foundamong business models that fall within an archetype that we have defined as “market-based capacity andreserve DR.” The generic structure of this business model archetype is depicted in Figure 5 and describedbelow.11
Business models for distributed energy resources: a review and empirical analysisFigure 5: Generic market-based demand response business model structureBusinesses within this archetype most commonly target large C/I/M and industrial customer segments. Thisis due to a number of factors including market rules such as minimum bid-size requirements, transactioncosts, and customer acquisition costs [21]. These businesses often provide an EMS (or similar product) tothe targeted customer to optimize the customer’s energy consumption (and production in the case ofcustomers with on-site distributed generation); the EMS also enables the customers to participate in ISObased DR programs, with market interaction facilitated by the DR business. In certain cases, the businessesdo not provide an EMS-like product, and loads are simply controlled through alternative measures (e.g. phonecalls instructing customers to manually respond). These business models most commonly leverage customerloads such as lighting, HVAC units (chillers and fans), refrigeration units, other variable frequency driveunits, idiosyncratic industrial process loads, and customer-sited generation such as backup diesel or gas units,fuel cells, or batteries [31,36]. Among the various types of operating reserves, DR is most commonlydeployed for secondary reserves (e.g. “contingency reserves”); however, the provision of primary reserveservices is becoming increasingly common [37]. Secondary reserves are favored amongst DR providers, assecondary reserves are dispatched less frequently and the required response time is typically lower thanprimary reserves.These businesses typically make a profit by taking a portion of the revenues generated from the sales of theseservices – that is, by brokering market revenues (brokerage fees) – and/or by charging for the use of theenergy management software that enables the demand control (subscription fees). Note that the businessmodel’s revenue is a brokerage fee, rather than a commodity sale; the business distributes the revenuesassociated with commodity sales to the DR resources under contract.Table 3 includes several examples of business models that fall under this archetype. EnerNOC and REstoreare typical examples of businesses selling to C/I/M and industrial customers. Ohmconnect is an interestingexception in that it explicitly targets residential customers through a user-friendly app. By sending signals12
Burger & Luke, 2015to homeowners directly or communicating with home area network (HAN) connected devices, Ohmconnectenables residential consumers to participate in power system markets. Encycle targets mostly small andmidsize C/I/M facilities, which are commonly overlooked amongst DR businesses.Table 3: Market-based demand response business model examplesMarket-based capacity and reserve demand responseLarge DR resource business modelsTypical customers: C/I/M & Industrial - ISOTypical Services: Firm capacity, operating reserves, & constraintmitigationSmall DR resource business modelsTypical customers: Residential & small C/I/M - ISOTypical Services: Firm capacity, operating reserves, & constraintmitigation5.2EnerNOC (United States)Innovari (United States)Restore (Europe)Ohmconnect (United States)Encycle (United States)Lichtblick (Europe)Utility-based capacity and reserve DRThe second largest cluster of DR and EMS business models, which we have called “utility-based capacity andreserve DR” companies, sell demand response products directly to regulated utilities. The utility customersof these DR businesses tend to operate in vertically integrated or partially restructured markets (i.e. marketswithout competitive retail supply). Regulated utilities will contract with DR providers to procure (mostcommonly) firm capacity, operating reserves, and mitigation of network constraints. These utilities will eitheroperate these programs under compulsion from their regulators or, in certain cases, proactively seekregulatory approval (see, for example, Consolidated Edison’s program [38], or Tuscon Electric Power’sprogram [39]). The generic structure of this business model is depicted in Figure 6.13
Business models for distributed energy resources: a review and empirical analysisFigure 6: Generic utility-based demand response business model structureIn these cases, distribution utilities seek an explicit (although sometimes unlimited) capacity of qualifyingdemand response resources. DR businesses procure DR resources at prices determined by negotiation withthe utility and the regulator. In many cases, a single DR business will operate the DR program on behalf ofthe utility [21]. Participating load resources obtain a share of the revenues earned by the DR aggregators.This represents a strict departure in strategy from the market-driven DR business model archetype describedabove; the DR provider’s focus is on selling products to the utility and working with the utility to connectwith (most commonly) C/I/M and industrial customers. In some cases, the utility will help the DR providerin targeting specific customers or customer classes (DR/customer engagement opportunity identification isa stand-alone service provided by certain ICT companies as well). These DR businesses tend to earn revenuesthrough subscription fees (i.e. payments from the utility linked to the provision of the DR managementsoftware, etc.) or brokerage fees (i.e. keeping a share of the revenue earned from the sale of the DR resourceto the utility). Many of the businesses operating in market environments also operate in these regulatedenvironments; examples include EnerNOC and Comverge.While in market-driven environments transaction and customer acquisition costs have driven DR businessmodels to target larger C/I/M and industrial customers, the regulated environment allows for gre
A Review and Empirical Analysis An MIT Energy Initiative Working Paper April 2016 Scott P. Burger1* sburger@mit.edu 1MIT Energy Initiative and MIT Institute for Data, Systems and Society, Massachusetts Institute of Technology, USA MIT Energy Initiative, 77 Massachusetts Ave., Cambridge, MA 02