Transcription
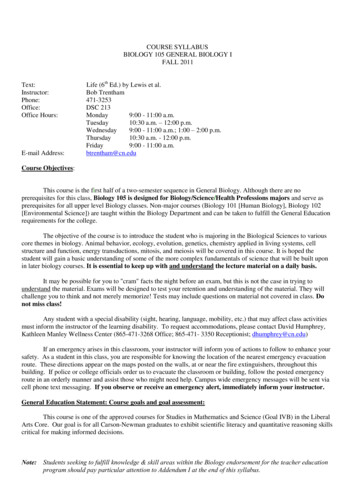
NamePeriodAP BiologyDateLAB . FACTORS INFLUENCING ENZYME ACTIVITYBackgroundEnzymes are biological catalysts capable of speeding up chemical reactions by loweringactivation energy. One benefit of enzyme catalysts is that the cell can carry out complexchemical activities at a relatively low temperature.Most enzymes are proteins and their 3-dimensional shape is important to their catalytic activity.Two specific regions on the enzyme structure play an important role in catalytic activity: theactive site and the allosteric site. The active site is the area of the enzyme which binds to thesubstance(s) (substrate) and aids in the chemical reaction. The allosteric site is involved informing the proper 3-dimensional shape when linked with specific cofactors. As a result of theunique characteristics of these sites, enzymes are highly specific in terms of the reactions theywill catalyze and the condition under which they work best.In biochemical reactions the enzyme, combines reversibly with its specific substrate, to form anenzyme-substrate complex. One result of this temporary union is a reduction in the energyrequired to activate the reaction of the substrate molecule so that the products of the reaction,are formed.This can be summarized in the equation:Enzyme Substrate Enzyme-Substrate Complex Enzyme ProductNote that the enzyme is not consumed in the reaction and can recycle to work with additionalsubstrate molecules. Each enzyme is specific for a particular reaction because its amino acidsequence is unique which causes it to have a unique 3-dimensional structure. The active site isthe portion of the enzyme that interacts with the substrate, so that any substance that blocks orchanges the shape of the active site affects the activity of the enzyme.In practice, this specificity permits one to mix a purified substrate with crude preparations ofenzyme that might contain many other substances and obtain a quantitative assay (analysis) ofthe amount of enzyme present.We will be working in this lab with a representative enzyme —catalase. Catalase has a molecular weight of approximately240,000 daltons and contains 4 polypeptide chains, eachcomposed of more than 500 amino acid monomers. Thisenzyme occurs universally in aerobic organisms. One functionof catalase within cells is to prevent the accumulation of toxiclevels of hydrogen peroxide (H2O2) formed as a by-product ofmetabolic processes. Catalase might also take part in some ofthe many oxidation reactions going on in all cells.The primary reaction catalyzed by catalasedecomposition of H2O2 to form water and oxygen.isthe2 H2O2 2 H2O O2 (gas)In the absence of catalase, this reaction occurs spontaneously,but very slowly. Catalase speeds up the reaction considerably.In this experiment, a rate for this reaction will be determined.The catalase that works in liverand in red blood cells.1 of 112007-2008
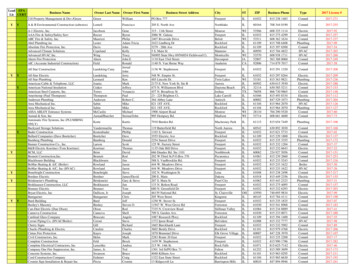
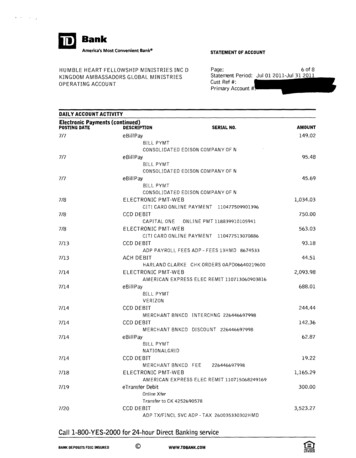
NamePeriodMuch can be learned about enzymes by studying the kinetics (changes in rate) of enzymecatalyzed reactions. For example, it is possible to measure the amount of product formed, or theamount of substrate used, from the moment the reactants are brought together until the reactionhas stopped.So let’s look at a hypothetical example:An enzyme and its substrate are mixed in a reaction vessel. If the amount of product formed ismeasured at 30 second intervals and this quantity plotted on a graph, a curve like the one inFigure 1 is obtained:Figure 1. Enzyme Activity4030Product(µmoles) 2010012345678Time (minutes)Observe the solid line for this reaction. At time 0 there is no product. After 30 seconds, 5 µmoleshave been formed; after 1 minute, 10; after 2 minutes 20. The rate of reaction could be given as10 µmoles of product formed per minute for this initial period. Note, however, that by the 3rd and4th minutes only about 5 additional µmoles of product have been formed. During the first 3minutes, the rate is constant. From the 3rd minute through the 8th minute, the rate is changing—it is slowing down. For each successive minute after the first 3 minutes, the amount of productformed in that interval is less than in the preceding minute. From the 7th minute onward, thereaction rate is very slow.In the comparison of kinetics of one reaction with another, a common reference point is needed.For example, suppose you wanted to compare the effectiveness of catalase obtained frompotato with that of catalase obtained from liver. Would you want to compare the two reactionsduring the first few minutes when the rate is constant or later when the rates are changing?Answer: It is best to compare the reactions when the rates are constant.In the first few minutes of an enzymatic reaction such as this, the number of substratemolecules is usually so large compared to the number of enzyme molecules that the enzyme isconstantly having successful collisions with substrate. Therefore, during this early period, theenzyme is acting on substrate molecules at a constant rate (as fast as it can). The slope of agraphed line during this early period is called the initial velocity of the reaction. The initialvelocity (or rate) of any enzyme-catalyzed reaction is determined by the characteristics of theenzyme molecule. It is always the same for a specific enzyme and its substrate as long astemperature and pH are constant and the substrate is present in excess.2 of 112007-2008
NamePeriodThe initial rate of the reaction, therefore is the slope of the linear portion of the curve. Todetermine a rate, pick any two points on the straight-line portion of the curve. Divide thedifference in the amount of product formed between these two points by the difference in timebetween them. The result will be the rate of the reaction which, if properly calculated, can beexpressed as µmoles of product/second. This equation is:µmoles2 - µmole1t2 – t1In the graph shown as Figure 1:30 – 20180 – 120 1060 0.17 µmoles/secondThe rate of a chemical reaction may be studied in a number of ways, including the following:1. Measuring the rate of disappearance of substrate, in this example, H2O22. Measuring the rate of appearance of product, in this example, O2, which isgiven off as a gas.3. Measuring the heat released (or absorbed) during the reaction.In this experiment, the disappearance of substrate, H2O2, and the generation of product, O2, aremeasured.Materials:Obtain the following materials: 50mL beaker containing freshcatalase (yeast) solution reaction chamber ring stand & clamp 10mL graduated cylinder 100mL graduated cylinder 3% hydrogen peroxide (H2O2) pan (water bath) pipette hot plate ice thermometer boiled catalase buffers of varying pH: 4, 7, 10 distilled water balance NaCl (salt)3 of 112007-2008
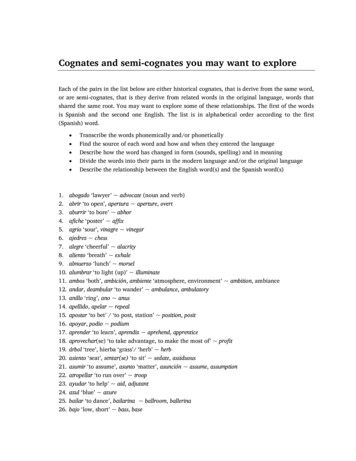
NamePeriodGeneral Lab Procedure:1. Work as a lab group of 3-4 members. Each lab group will complete Part A and Part B of thelab. Your teacher will assign on an additional activity to each group form Parts C, D, E & F.2. At your lab bench you will find a round vial with a rubber stopper top. This is called thereaction chamber. You will also find a 100mL graduated cylinder, ring stand and clamp,and a plastic pan which will be used as a water bath. All of this equipment needs to beassembled into our experimental apparatus, as described and illustrated below.3. Fill the pan 3/4 full of tap water. Allow the water to come to room temperature.4. Submerge the 100mL graduated cylinder to fill it with water. Turn the graduated cylinderupside down, keeping the open end under water, so as to keep it filled with water. Suspendit upside down in the clamp on the ring stand. Adjust the height of the clamp on the ringstand so the open end of the graduated cylinder is about 3cm above the bottom of the pan.See diagram below.5. Place a thermometer in the pan and record the temperatureof the water, during Part A of the lab. C6. When all sections of the lab are complete, share the data with the class from your group’ssection. Each person must plot the data for all parts of the lab on his/her own graph paper.4 of 112007-2008
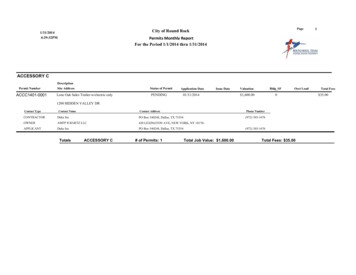
NamePeriodFACTORS INFLUENCING THE ACTIVITY OF CATALASESeveral enzymatic variables will be examined in this lab. You will be using the protein enzyme,catalase. Catalase is found in most cells, even in single-celled eukaryotes like yeast. In this lab,you will extract catalase from a yeast solution and test its catalytic effectiveness on hydrogenperoxide. Catalase speeds up the breakdown of peroxides which may form during respiration(metabolic energy production). This breakdown prevents the peroxide from causing unwantedoxidation of important biomolecules:2 H2O2 2 H2O O2 (gas)We will measure enzyme activity by measuring the generation of oxygen gas — aproduct in the reaction.Part A. The Time Course of Enzyme Activity1. Set up the experimental apparatus as illustrated and described above.2. Obtain a reaction chamber.3. Obtain a bottle of 3% hydrogen peroxide (H2O2) solution and a 10mL graduated cylinder.4. Obtain a small amount of stock catalase (yeast) solution in a 50mL beaker. You willneed 1.0mL of yeast solution for each trial. When you are ready, you will add it to the vialwith a plastic pipette.5. Pour 10mL of hydrogen peroxide (H2O2) into the reaction chamber. Pipette in 1.0mL ofstock catalase solution (yeast solution) and IMMEDIATELY stopper the reactionchamber tightly, submerge it in the water bath and place the plastic tubing into thebottom of the graduated cylinder, so all the bubbles formed in the reaction chamber arecaptured by the inverted graduated cylinder.6. Measure the gas levels in the graduated cylinder at 30-second intervals for 5 minutes.Record the levels in a data table of your own design.7. Plot the data on a graph. Don’t forget to label your axes and title your graph.Part B. The Effect of Enzyme Concentration on Enzyme Activity1. Repeat the experiment from Part A, using 3 different levels of enzyme concentration:75%, 50%, and 25% concentration of enzyme solution. You may easily do this by usingthe following procedures:a. 75% concentration: Follow the procedure from Part A, but use 0.75mL catalasesolution in the reaction chamber, instead of 1.0mL.b. 50% concentration: Follow the procedure from Part A, but use 0.50mL catalasesolution in the reaction chamber, instead of 1.0mL.c. 25% concentration: Follow the procedure from Part A, but use 0.25mL catalasesolution in the reaction chamber, instead of 1.0mL.2. Record all data in a data table of your own design.3. Plot the data on the same graph as Part A. Don’t forget to clearly label the enzymeconcentrations on your plotted lines.5 of 112007-2008
NamePeriodPart C. The Effect of Temperature on Enzyme Activity1. Repeat the experiment from Part A (5 minute runs with 1mL catalase solution), using 3different temperatures: 5 C, 37 C, and 100 C (boiled catalase). You may easily do thisby using the following procedures:a. 5 C: Set up your reaction vessel and water bath and add ice to the water bath sothat it is chilled to 5 C for 5 minutes before running the experiment. Keep addingice to keep the temperature at 5 C or colder.b. 37 C: Set up your reaction vessel and water bath with heated water so that it iswarmed to 37 C for 5 minutes before running the experiment. Keep adding hotwater to keep the temperature at 37 C.c. 100 C (boiled catalase): We can’t use a water bath of boiling water since thatmay injure a student, so instead of keeping the reaction vessel in boiling waterduring the experiment, we will instead boil the catalase solution for 5 minutes.Then after the catalase solution has cooled you run the experiment in roomtemperature water (but with already boiled catalase).2. Record all data in a data table of your own design.3. Plot the data on a new graph. Also plot on this graph the room temperature datarecorded in Part A. Don’t forget to clearly label your axes and plotted lines, and title yourgraph.Part D. The Effect of pH on Enzyme Activity1. Repeat the experiment from Part A (5 minute runs with 1mL catalase solution), using 3different hydrogen peroxide solutions at 3 different pH values: pH 4, pH 7, and pH 10.You may easily do this by using the following proceduresa. pH 4: Make a 1.5% solution of H2O2 at pH4 by adding 5mL of H2O2 to 5mL of pH4 buffer.b. pH 7: Make a 1.5% solution of H2O2 at pH7 by adding 5mL of H2O2 to 5mL of pH7 buffer.c. pH 10: Make a 1.5% solution of H2O2 at pH10 by adding 5mL of H2O2 to 5mL ofpH 10 buffer.2. Record all data in a data table of your own design.3. Plot the data on a new graph. Don’t forget to clearly label your axes and plotted lines,and title your graph.6 of 112007-2008
NamePeriodPart E. The Effect of Substrate Concentration on Enzyme Activity1. Repeat the experiment from Part A (5 minute runs with 1mL catalase solution), using 4different substrate concentrations: 0%, 0.3%, 1.5%, and 3.0%. You may easily do this byusing the following proceduresa. 0%: Use 10mL distilled water only.b. 0.3%: Prepare this by adding 3mL of H2O2 to 7mL of distilled water.c. 1.5%: Prepare this by adding 5mL of H2O2 to 5mL of distilled water.d. 3.0%: This is the concentration of substrate from the original experiment in PartA; just use this initial data.2. Record all data in a data table of your own design.3. Plot the data on a new graph. Don’t forget to clearly label your axes and plotted lines,and title your graph.Part F. The Effect of Ionic Concentration on Enzyme Activity1. Repeat the experiment from Part A (5 minute runs with 1mL catalase solution), using 3different ionic concentrations: 10% NaCl, 2% NaCl, and 0% NaCl. You may easily dothis by using the following proceduresa. 10% NaCl: Make a 1.5% solution of H2O2 containing 10% NaCl by dissolving 5gof NaCl in 50mL of water then add 5mL of this solution to 5mL of H2O2.b. 2% NaCl: Make a 1.5% solution of H2O2 containing 2% NaCl by dissolving 1g ofNaCl in 50mL of water then add 5mL of this solution to 5mL of H2O2.c. 0% NaCl: Prepare this by adding 5mL of distilled water to 5mL of H
enzyme that might contain many other substances and obtain a quantitative assay (analysis) of the amount of enzyme present. We will be working in this lab with a representative enzyme — catalase. Catalase has a molecular weight of approximately 240,000 daltons and contains 4 polypeptide chains, each composed of more than 500 amino acid monomers. This