Transcription
COVID-19 Impact on Fintech MarketsAPRIL 2020
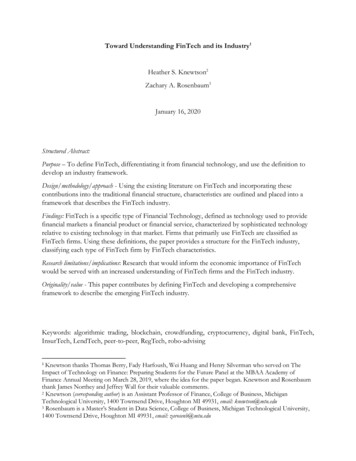
How Will the Fintech Community Respond to COVID-19?Overall, the COVID-19 impact is proving negative in the short term, but some areas are proving resilient and may even benefit over medium term. While there is current uncertainty, particularly around M&A, valuations, and credit pricing, there is still plenty of liquidity that is likely to lead to consolidationonce the market recovers. Investors will continue to favour those domain players with platforms, high recurring (and/or re-occurring) revenues, high operating leverage, and robustcash flow generationd—with a particular emphasis on those with embedded digital and data and analytics capabilities. In the short term, B2C models are more vulnerable; B2B models, particularly those with subscription revenues, remain more resilient.ImpactAsset and WealthManagementBanking andLendingPaymentsExchanges ons Panic peaks andcaution prevails Short-term redemptions impacting end customers and short-term investments. Investors migrate to established brands with scale, impacting new entrants. Industry focus on technology and data adoption to solve complex regulatory and workflow challenges continues. Long-termfundamentals hold Established lenders have vastly improved funding, liquidity, and capital positions; likely to withstand COVID-19 stress-test.? Despite demand for capital and consumers embracing technology to manage their money, challenger banks and specialist lendersface a more turbulent environment. Lenders scrambling to recalibrate underwriting methodologies. Potential for short-term expense control, but innovation/technology transformation still top of C-suite agenda. B2C models to sufferprofound short-termimplications Temporary paralysis in certain verticals and/or regions caused by cessation of global consumer and corporation spending and falloff in associated transaction volumes. E-commerce as a key channel already well entrenched and COVID-19 likely to accelerate digitisation initiatives. Exchanges gain asvolatility reigns All asset classes currently benefitting from elevated volatility and trading activity. Creating an opportunity for exchanges to consolidate their positions and move into adjacent markets. Adequately insured,with some variableimpacts A majority of participants theoretically absolved from pandemics, but growing scrutiny on the wider industry to provide flexibilityin paying out non-underwritten COVID-19 risks Although providers have different exposures, COVID-19 anticipated to speed up digitisation and data-usage initiatives B2B subscriptionmodels remainresilient Proprietary content has become embedded and nondiscretionary in nature, driving stable and predictable earnings COVID-19 impact on growth profile difficult to ascertain and will drive multiples when markets stabilise2
How We Look at the Fintech OpportunityAsset andWealthManagementBanking nd vicesEnd MarketsAsset andWealthManagersBanks eUnderwritersand nativeLendersBusiness models converging:Alternative Financial Services BPO Transaction Processing Tech-Enabled Services Data and Analytics Software/SaaSNote (*): Deal expected to close in H2 2020.Source: Public announcement.3
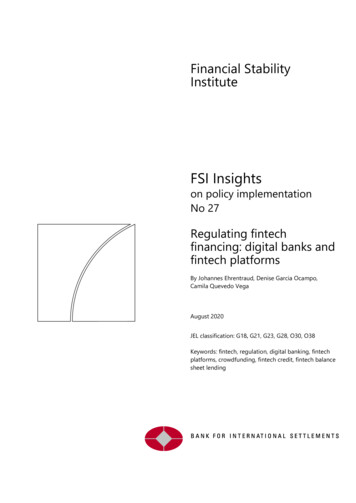
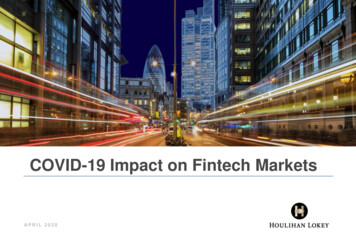
Crisis to Crisis: How Does It Look?Although fintechs have outperformed the market, the recent correction all but reverses historical multiple expansion delivered post 2008.Earnings multiples back to “normal”?Fintech outperforms the broader market900Global Financial Crisis30.0x 447% US FintechGlobal Financial Crisis 344% EU Fintech80025.0x 74% S&P 500 700-13% FTSE 10020.0x600EV/LTM EBITDAShare Price (Rebased to 100)since March 200750040015.0x10.0x300100-3.3x US Fintech 5.0x 200-0.5x EU Fintech 1.2x S&P 500since March 2007--x--S&P 500FTSE 100US FinTechSources: S&P Capital IQ. All share prices rebased to 100.US fintech includes: CME, EBIX, Global Payments, ICE, Sapiens.EU fintech includes: Deutsche Börse, Experian, Iress, LSE, SimCorp, Temenos.EU FinTechS&P 500US FintechEU FinTech4
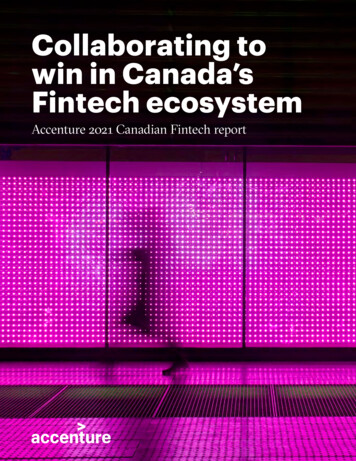
Not All Subsegments Equally Impacted by COVID-19Fintech segments have retraced between c.13% and 29% in the immediate aftermath of COVID-19.105Performance Since 20 FebruaryAsset & Wealth Management: 71.410%Banking & Lending: 76.6100Payments: 71.3Share Price (Rebased to 100)Exchanges & Execution: 86.95%0%(5%)(10%)(15%)95Insurance: 83.0(13.1%)(20%)(17.0%)(20.5%)(25%)Financial Information: 79.5(30%)(23.4%)(28.6%)90(28.7%)One-Year )(15%)(25%)75(20.1%)Three-Year -MarAsset & Wealth ManagementExchanges & Execution12-MarBanking & l Information40%68.4%67.8%51.2%60%29.7%20%0%Sources: S&P Capital IQ. All share prices rebased to 100.Asset & Wealth Management: Broadridge, Envestnet, Iress, SimCorp, SS&C ; Banking & Lending: FIS, Fiserv, Jack Henry & Associates, Q2, Temenos; Payments : Bottomline Technologies, FleetCor, GlobalPayments, Mastercard, Square, Visa; Exchanges & Execution: CME, Deutsche Börse, ICE, LSE; Financial Information: Cerved, Equifax, Experian, FICO, IHS Markit, Moody’s, MSCI, RELX, S&P Global,TransUnion; Insurance: EBIX, Guidewire, Sapiens, Verisk.5
Banking and Lending Stocks Have Performed Comparatively StronglyVersus Other Fintech Segments, Supporting Long-Term ThesisAsset and Wealth ManagementBanking and LendingFY20E Median Feb: 17.5x/Current: 14.4xΔ share pricesince Feb-20(36.0%)(23.9%)(23.3%)(45.5%)(21.2%)FY20E Median Feb: 20.9x/Current: 16.9x(26.5%)(29.3%)(10.5%)(22.9%)EV/2020E/2021E %)13.6x16.8x14.1x12.9x9.0xMarket Cap(1)( 132,223EV(1) ( x11.2x/7.5x% RecurringRevenuen.d. 64% 50%96% 90%82%n.d. 85%n.d.43%n.d.Rev. 6.2%11.7%23.1%EBITDA 0.1%41.2%4.3%EV/2020 Rev. (asat Feb/Mar)EV/2020E/2021E EBITDA as at 3 April 2020Notes: Financials are calendarised to 31 December year end. Trading multiples are based on share price and market data listed as at 20 February/3 April 2020 andbroker consensus future earnings estimates from S&P Capital IQ and broker reports as at 20 February/3 April 2020. EV/EBITDA multiples considered to be notmeaningful when greater than 40x.(1) As at 3 April 2020.EV/2020E/2021E EBITDA as at 20 February 20206
Exchanges and Execution Platforms Have Benefited From Increased TradingVolumes Across Asset Classes Following Significant Periods of VolatilityPaymentsExchanges and ExecutionFY20E Median Feb: 20.8x/Current: 13.7xΔ share pricesince nmnmnm35.5xnm29.7x25.7x25.0xEV/2020E/2021E .9x23.7x19.8xFY20E Median Feb: 19.4x/Current: 16.4x14.2x t Cap(1)( 736,32325,26720,219EV(1) ( x10.8x/9.1x12.7x/10.9x9.5x/7.8x% .d.48%Rev. 1.5%3.6%5.2%5.1%EBITDA .5%55.9%61.7%EV/2020 Rev. (asat Feb/Mar)EV/2020E/2021E EBITDA as at 3 April 2020Notes: Financials are calendarised to 31 December year end. Trading multiples are based on share price and market data listed as at 20 February/3 April 2020 andbroker consensus future earnings estimates from S&P Capital IQ and broker reports as at 20 February/3 April 2020. EV/EBITDA multiples considered to be notmeaningful when greater than 40x.(1) As at 3 April 2020.EV/2020E/2021E EBITDA as at 20 February 20207
B2B Information Providers With Subscription Models and Relatively FixedCosts Base Demonstrate RobustnessInsuranceFinancial InformationFY20E Median Feb: 20.1x/Current: 14.4xΔ share pricesince Feb-20(16.4%)(39.4%)nm(65.1%)(30.9%)FY20E Median Feb: 19.5x/Current: .2%)31.1x29.8xnm 36.6xEV/2020E/2021E EBITDA(34.0%)14.6x13.6x12.9x11.8x13.1x12.0x10.0x 9.9x7.0x8.4x7.3x5.8x4.4xMarket Cap(1)( 8,78910,6219,1536,281946EV(1) ( x4.4x/3.6x% Recurringrevenue81%64%83%75%64%52%57%85%n.d. 96%n.d.n.d.n.d.n.d.Rev. 7%4.1%10.4%5.5%6.2%4.4%7.4%EBITDA 5.2%55.1%34.0%39.9%32.7%42.6%EV/2020 Rev.(as at Feb/Mar)EV/2020E/2021E EBITDA as at 3 April 2020Notes: Financials are calendarised to 31 December year end. Trading multiples are based on share price and market data listed as at 20 February/3 April 2020 andbroker consensus future earnings estimates from S&P Capital IQ and broker reports as at 20 February/3 April 2020. EV/EBITDA multiples considered to be notmeaningful when greater than 40x.(1) As at 3 April 2020.EV/2020E/2021E EBITDA as at 20 February 20208
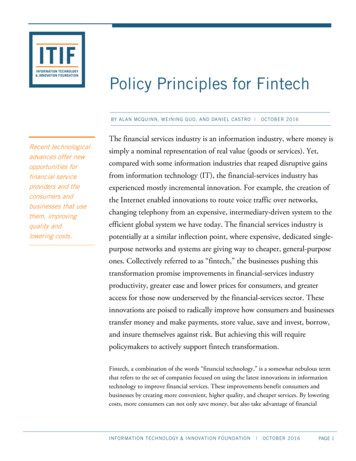
Capital Markets Experience Extreme VolatilityHeightened concerns surrounding COVID-19 continue to cause volatility across markets and weaken investor sentiment.Equity Capital Markets Volatility, as measured by the VIX index, peaked on 16 March at anall-time high, exceeding the levels seen during the financial crisis.Volatility has since reduced from the peak with the VIX index currentlyaround 44, but this is still 3x higher than the low levels seen in early2020 before the COVID-19 pandemic. Markets have recovered strongly, with major indices up more than15% since their lows on 23 March. However, volatility is likely toremain until there is more visibility on the progress of the virus,potential COVID-19 exit strategies, oil price stability, and the impactthat each will have on the broader economy and corporate earnings. Companies across the globe have cancelled dividends and sharebuybacks and have dialled down capital expenditure programmesdespite unprecedented fiscal and monetary policy response. A number of companies in directly affected sectors have tappedequity markets, successfully raising equity as they seek to ensurethey can absorb operational disruptions for an extended period. IPOs across Europe scheduled to launch before Easter have beenpostponed, and it seems likely that IPOs planned to occur before thesummer will also be postponed, even if market volatility continues tosettle down as management teams assess any damage from thepandemic and its economic consequences, including on theirguidance to the market. While there has been significant disruption, bear markets caused byexternal shocks have (historically) been the fastest to recover.Note: As at 3 April 2020.Debt Capital Markets International governments and central banks remain at the ready tosupport their respective economies with necessary monetary andfiscal policies to soften the impact of COVID-19. In the leveraged loans and high-yield markets, there have been nonew primary issues (apart from some small add-ons) for a month,although early April has seen four BB issuers emerge in the US. Bank underwriting has withdrawn, except for deals committed precrisis while (in the direct credit market) there has been someinvestment, albeit again on deals nearly complete before the crisis. The direct market has liquidity; however, we are still in a stage ofprice discovery, since secondary public markets have highlyattractive current yields and are typically with much largercompanies. In March, credit rating agencies downgraded ratings at the fastestpace on record with the level of downgrades forecast to remain highover the coming weeks. There is a possibility that downgrades willforce further selling pressure. The secondary market has seen a major sell-off across industries inboth the leveraged loan and high-yield markets, in part influencedby the rating downgrades (the short-term dislocation presentingopportunities to some investors). However, investment gradeissuance has been at all-time-high volume levels, and this hasunderpinned upward price movements in sub-IG of 5%–10%, withthe BB index at c. 5% and the single B index at c. 10% in earlyApril.9
China: A Look Into the Future?China will be used as a natural high-water mark and will provide early insights as to how Western markets will recover from COVID-19.China is back up and running .emerging from lockdown Over the past several weeks, Chinese government efforts have beengeared towards normalising production and reducing supply disruptions. While not at prior year levels, 25 provinces (which account for 89.2% ofGDP) are reporting full resumption rates. Early indicators for electricity and coal power generation, port traffic,passenger activity, and car sales have shown signs of improvement asfactories gradually resume production.Current production levels at80.6% China’s large industrial andmanufacturing enterprises202010080201960Wuhan shutdown40Lunar new year 25 Jan 202020Production levels one65.3%month prior0JanFebMarAprFT China Economic Activity Index (2019 vs. 2020), as at 5 April 2020 outperforming Western markets and showing initial signs of positive progress.(1)12094%Rebased Price110of large companies outsideHubei have restartedoperationsPower Plant ight1001009093807370696020-FebS&P 50005-MarFTSE 10019-MarDAX02-AprCSI 300Sources: Trivium, FT research, WIND, EntGroup. FT China Economic Activity Index, S&P Capital IQ.Note: FT China Economic Activity Index 2019 values are at the same number of days before/after the lunar year as 2020.FT China Economic Activity Index – selected subindices (2019 vs. 2020), as at5 April 202010
Integrated, Global Team Built to Advise Modern Fintech PlatformsIndustry-leading fintech investment banking team Mark FisherTim ShortlandGagan SawhneyDavid SolaManaging DirectorLondonMFisher@HL.com 44 (0) 20 7907 4203Managing DirectorLondonTShortland@HL.com 44 (0) 20 7907 4213Managing DirectorNew YorkGSawhney@HL.com212.830.6165Managing DirectorLondonDSola@hl.com 44 (0) 20 7747 7575Rob FreimanKegan GreeneChris PedoneBrenton PursloweDirectorNew YorkRFreiman@HL.com212.497.7859DirectorSan FranciscoKGreene@HL.com415.273.3639DirectorNew YorkCPedone@HL.com212.830.6166Vice PresidentLondonBPurslowe@HL.com 44 (0) 20 7907 4223 supported by the extensive resources and relationships of the firm’s global product teams.Private Equity Coverage 19 senior officers dedicated to sponsorcommunity in North America and Europe Dedicated coverage of 1,000 funds withproprietary knowledge of buyer behavior Sold 450 companies to financial sponsorsover the last five yearsPrivate Capital Markets 45 professionals globally, representing theindustry’s largest dedicated alternativeinvestor coverage teamFinancial Valuation and AdvisoryFinancial Restructuring No. 1 ranked global M&A fairness opinionadvisor over the past 20 years No. 1 ranked global investment bankingrestructuring advisor in 2019 1,000 annual valuation engagements Raised more than 100 billion of capital inthe past 5 years Advised on 1,000 restructuring transactionswith aggregate debt claims of 2.5 trillionover past decade Raised approximately 11.5 billion in 2019with participation from 40 different investors Advised on 12 of the 15 largest bankruptcytransactions since 2000Ranking Source: Refinitiv (formerly known as Thomson Reuters).11
Additional Financial Institutions Coverage OfficersOne of the industry’s deepest senior teams with expertise and relationships globally spanning the entire spectrum of financial services.North inhard KoesterJeff LevineJeff BollermanMike McMahonJimmy PageGroup Co-HeadGroup Co-HeadManaging DirectorManaging DirectorManaging DirectorArik RashkesCraig TessimondEric WeberBrent FerrinJuan GuzmanManaging DirectorManaging DirectorManaging DirectorDirectorDirectorSam KramerRob LosquadroRich SaltzmanFaiz VahidyJim FreemanSenior Vice PresidentSenior Vice PresidentSenior Vice PresidentSenior Vice PresidentSenior AdvisorChristian KentLawrence GuthrieZam KhanPaul TraceyYashin ModyManaging DirectorManaging DirectorManaging DirectorDirectorSenior Vice President12
Proven Fintech Track Record With Exceptional Momentum (1/2)Transaction PendingTransaction PendingFunds managed byhave entered into an agreement tocombineand its wholly-owned subsidiaryhas agreed to invest inEuropean Servicinghas been acquired byhas been acquired byhas acquiredhas acquired a majority stake inandhas agreed to be acquired byhave been acquired byFinancial AdvisorPendingFinancialInformationSellside AdvisorPendingBanking andLendingFinancial AdvisorMar. 2020Banking andLendingSellside Advisor*Nov. 2019Asset and WealthManagementthe parent company ofSellside Advisor*Sep. 2019Exchanges andExecutionSellside AdvisorBuyside AdvisorSep. 2019InsuranceSep. 2019InsuranceFairness OpinionsJun. 2019Banking andLendingLenderLive Networka portfolio company ofa portfolio company ofa portfolio company ofhas solda division ofhas been acquired byhas been acquired byhas been acquired byhas received a minority investmentfromhas been acquired by2018has been acquired bytoUndisclosed Investor GroupSellside AdvisorSellside AdvisorSellside AdvisorMay 2019Capital MarketsSoftwareMar. 2019Capital MarketsSoftwareMar. 2019Capital MarketsSoftwareSellside AdvisorMar. 2019InsuranceSellside Advisor*Feb. 2019Capital MarketsSoftwarehas received an investment fromSellside AdvisorJan. 2019Banking andLendingSellside AdvisorJan. 2019Banking andLendinga portfolio company ofhas acquired a majority interest inhas been acquired byhas been acquired byLowell has sold its paymentsbusiness unit in the Nordics tohas been acquired byhas been acquired byhas been acquired byandELLIOTTFinancial AdvisorDec. 2018FinancialInformationBuyside AdvisorDec. 2018PaymentsSellside AdvisorNov. 2018Exchanges andExecutionList of transactions shown not exhaustive.*Selected transactions were executed by firms acquired by Houlihan Lokey.Sellside AdvisorNov. 2018Banking andLendingSellside AdvisorNov. 2018PaymentsSellside AdvisorSep. 2018FinancialInformationSellside Advisor*Sep. 2018Banking andLendingSellside AdvisorSep. 2018Insurance13
Proven Fintech Track Record With Exceptional Momentum (2/2)Funds managed bya portfolio company ofa portfolio company ofhas closed a funding round led byhave entered into an agreement tocombinehas been acquired byhas been acquired byhas merged withVermeg Group N.G.has been acquired byhas been acquired by2017andanda portfolio company ofSellside AdvisorSellside AdvisorJul. 2018FinancialInformationJun. 2018FinancialInformationa portfolio company ofFinancial Advisor*Sellside Advisor*Jun. 2018Asset and WealthManagementa portfolio company ofMay 2018FinancialInformationa portfolio company ofhas received an investment fromFinancial Advisory ServicesApr. 2018Asset and WealthManagementhas closed a series Cfinancing round withFeb. 2018Capital MarketsSoftwareDec. 2017Paymentshas received strategic investmentfromhas been acquired byhas been acquired byEQTFrancisco PartnersSellside AdvisorSellside Advisor*has been acquired byhas been acquired byFive Arrows PrincipalInvestmentshas been acquired byEquiniti Group PLCandMoody’s CorporationPostFinanceSellside Advisor*Oct. 2017Asset and WealthManagementSellside Advisor*Aug. 2017FinancialInformationSellside Advisor*Sellside AdvisorAug. 2017Capital MarketsSoftwareAug. 2017InsuranceSellside Advisor*Placement AgentAug. 2017Asset and WealthManagementJul. 2017Exchanges andExecutionSellside Advisor*Jul. 2017Banking andLendingSellside Advisor*Jul. 2017Insurancea portfolio company ofhas been acquired byhas been acquired byhas acquiredhas been acquired byhas been acquired byhas received an investment fromhas been acquired byand minority-owned byVerisk AnalyticsVerisk AnalyticsBroadridgeIK Investment PartnersBISAMZoopla Property Grouphas been acquired bySellside Advisor*Jun. 2017Exchanges andExecutionSellside Advisor*May 2017FinancialInformationSellside AdvisorBuyside Advisor*Sellside Advisor*Apr. 2017Capital MarketsSoftwareMar. 2017Capital MarketsSoftwareMar. 2017Capital MarketsSoftwareList of transactions shown not exhaustive.*Selected transactions were executed by firms acquired by Houlihan Lokey.Sellside Advisor*Feb. 2017InsuranceSellside Advisor*Feb. 2017FinancialInformationSellside Advisor*Jan. 2017FinancialInformation14
M&ADeal Activity Summary: M&A Heightened concerns surrounding COVID19 continue to cause volatility across M&Amarkets with a distinct downswing in totaldeal activity in March. 28 M&A deals in March represents a45% decrease in deal activity againstrecent monthly averages and a 40%decrease year-over-year.Growth/VCMonthly Deal Count(1)68565353484540 As strategic buyers have watched theirshare prices drastically drop, focus hasshifted to internal initiatives andweathering the storm before continuingthe push towards consolidation. Going forward, private equity buyers’ recordamount of dry powder ( 1.5 trillion) lendsitself to the opportunity to deploy capital inthe high-growth fintech sector at a steepdiscount to recent 36336Annualised Deal Count542Source: Pitchbook.com.(1) North American and European deals only.48566882163415
M&ASelected Deal Activity: M&ATargetSubsectorTargetAcquirerGrowth/VCAcquirer TypeDealValue ( m)Strategic M&A 12Strategic M&A---Data aggregation, portfolio analysis, and reporting for LPsPE Platform---ESOP and 401(k) administrationStrategic M&A---Risk and reporting tools for financial advisorsPE Bolt-On---Diversified AI-enabled financial advisor toolsStrategic M&A---Diversified pension and investment research platform for financial advisorsStrategic M&A 269Strategic M&A---Digital challenger bank with personal finance toolsPE Bolt-On---Lending platform for employers to offer loans to employeesStrategic M&A---Lending performance, analytics, and data providerPE Bolt-On---Patient financing for hospitals and large health systemsPE Platform---Loan administration and debt collection servicesTarget Description and Size MetricsAdministration, accounting, and fiduciary services for UHNWIsPrivate Client BusinessAsset and WealthManagement(Motive)Bankingand LendingMortgage lender document security provider(Insight)(Crestline)Source: Public announcement.16
M&ASelected Deal Activity: M&A (cont.)TargetSubsectorTargetAcquirerGrowth/VCDeal TypeDealValue ( m)PIPE 101Strategic M&A---Back-office processing and point-of-sale system providersPE Bolt-On---Patient and healthcare engagement and payment solutionsStrategic M&A---Automated payment validation solutionsPE Bolt-On 63Strategic M&A---PE Platform 33PE Bolt-On---Diversified financial risk management softwarePE Platform---Healthcare-focused valuation firmStrategic M&A---Mobile insurance policy managementStrategic M&A---Mortgage risk tools and diversified real estate analytics offeringStrategic M&A---Machine-learning focused data capture and digitalisation platformTarget DescriptionDiversified payment processing servicesPayments(GTCR)(RELX)Capital MarketsSoftwareDiversifiedFinancialSoftwareand BPOInsuranceOnline brokerage tools and tax lot accounting(Blackstone)Algorithmic trading and research technology infrastructureSpecialised tax consulting services(Thoma Bravo)FinancialInformationSource: Public announcement.17
M&ADeal Activity Summary: Growth/VC Private equity and VC firms have spent mostof March focusing on stabilising theirportfolio companies due to the strongheadwinds caused by COVID-19.Monthly Deal Count(1)102 However, financial sponsors should soonregain their focus on continuedinvestment in the fintech sector. Much like M&A activity, March private capitalactivity is far below average monthlyvolumes and approximately 50% below 2018and 2019’s record-high averages. Corporate VCs remain increasingly active ona percentage of deal activity, but have seena similar slowdown in deal count asstrategics have watched their share price falldramatically and shifted focus on internaloperations. Despite current slowdown, secondary buyersexpect a potential VC fire sale towards thesecond half of 2020 (and even into 2021) asattractive assets sell for steep discounts fromrecent peaks.Source: Pitchbook.com.(1) North American and European deals ary2020March2020972996636Annualised Deal Count6947531,0021,2191,22718
M&ASelected Deal Activity: Growth/VCTargetSubsectorAsset and Deal TypeDealValue ( m)Target DescriptionConsortium 126Alternatives distributionGrowth 34Reporting and rebalancing tools for Financial AnalystsSeries C 31Retirement-focused robo-advisor focused on small businessesSeries C 9Investment-focused personal finance platformSeries D 152Digital challenger bankSeries B 64Cloud-based mobile banking technologyCorporate 43Peer-to-peer lending marketplaceCorporate 10Online loan comparison toolSeries A 16Small-business focused digital challenger bankSeries A 16AI-focused digital challenger bankUndisclosed 15Property-focused marketplace platform/lenderSeries A 9Student loan provider and financial education providerGrowth/VC(Fidelity)BankingAnd LendingSource: Public announcement.19
M&ASelected Deal Activity: Growth/VC (cont.)TargetSubsectorPaymentsCapital MarketsSoftwareExchangesand ExecutionInsuranceFinancialInformationSource: Public announcement.TargetAcquirerGrowth/VCDeal TypeDealValue ( m)Series B 39Point-of-sale payment solutionsSeries A 18Spend and budgeting software for companiesCorporate---Diversified online payment solutionsCorporate 5Client communication surveillance software for financial institutionsCorporate 244Digital asset trading platform and custodySeries B 12Fractional retail and social investing platformCorporate---Series A 15Fully online-hosted, white-labeled insurance platformSeries A 7Gig economy workforce commercial insurance platformSeries A 7AI-driven insurance pricing platformCorporate---Financial institution focused AI prioritisation for Microsoft TeamsTarget DescriptionFX derivatives trading platform20
Listed Trading AnalysisAsset mcorpSS&CMarket 212022EV/EBITDA – 65.0%3.8%4.3%6.5%5.8%Banking &LendingMeanMedianBlack KnightFISFiservJack nBottomlineFleetcorGlobal 415,163270,183Exchanges&ExecutionMeanMe
Fintech outperforms the broader market Earnings multiples back to “normal”? 74% S&P 500 447% US Fintech 344% EU Fintech-0.5x EU Fintech 1.2x S&P 500 since March 2007 -3.3x US Fintech-13% FTSE 100 since M