Transcription
BREACH DETECTION SYSTEM TEST REPORTCisco Advanced Malware Protection v5.2.2015072320Authors – Dipti Ghimire, Bhaarath Venkateswaran, Ahmed Garhy, Mohamed Saher
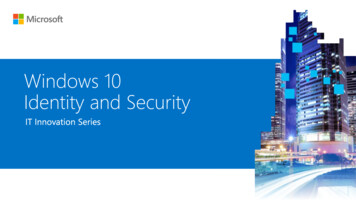
NSS LabsBreach Detection System Test Report – Cisco Advanced Malware ProtectionOverviewNSS Labs performed an independent test of the Cisco Advanced Malware Protection v5.2.2015072320. Theproduct was subjected to thorough testing at the NSS facility in Austin, Texas, based on the Breach DetectionSystem (BDS) Methodology v2.0 available at www.nsslabs.com. This test was conducted free of charge and NSS didnot receive any compensation in return for participation.While the companion comparative reports on security, performance, and total cost of ownership (TCO) willprovide information about all tested products, this individual test report provides detailed information notavailable elsewhere.As part of the initial BDS test setup, devices are tuned as deemed necessary by the vendor. Every effort is made toensure the optimal combination of Security Effectiveness and performance, as would be the aim of a typicalcustomer deploying the device in a live network environment. Figure 1 presents the overall results of the tests.ProductCisco Advanced Malware Protection 9.2%1,000 MbpsHTTP MalwareEmail MalwareSMB MalwareDrive-by ExploitsSocial e 1 – Overall Test ResultsThe Cisco Advanced Malware Protection v5.2.2015072320 received an overall detection rating of 99.2%. TheAdvanced Malware Protection proved effective against all evasion techniques tested. The solution also passed allstability and reliability tests.The solution was tested and rated by NSS at 1,000 Mbps. NSS-Tested Throughput is calculated as an average of the“real-world” protocol mixes (Enterprise Perimeter and Education), and the 21 KB HTTP response-based tests.1Detection rate is defined as the average percentage of malware and exploits detected under test.2
NSS LabsBreach Detection System Test Report – Cisco Advanced Malware ProtectionTable of ContentsOverview. 2Security Effectiveness . 5Exploit and Malware Detection .6Resistance to Evasion Techniques .7Network Device Performance . 8Raw Packet Processing Performance (UDP Traffic) .8Maximum Capacity .9HTTP Capacity with No Transaction Delays .11HTTP Capacity with Transaction Delays .12“Real-World” Traffic Mixes .13Stability and Reliability . 14Management and Configuration . 15Total Cost of Ownership (TCO) . 15Calculating the Total Cost of Ownership (TCO) .16Installation Time .16Purchase Price And Total Cost Of Ownership .17Value: Total Cost of Ownership per Protected Mbps .18Appendix: Product Scorecard . 19Test Methodology . 21Contact Information . 213
NSS LabsBreach Detection System Test Report – Cisco Advanced Malware ProtectionTable of FiguresFigure 1 – Overall Test Results.2Figure 2 – Exploit and Malware Detection Rates .6Figure 3 – Resistance to Evasion Results .7Figure 4 – Raw Packet Processing Performance (UDP Traffic) .8Figure 5 – Maximum Concurrent TCP Connections and Maximum TCP Connections per Second .10Figure 6 – Detection under Load (HTTP Capacity with No Transaction Delay) .11Figure 7 – Detection under Load (HTTP Capacity with Transaction Delay) .12Figure 8 – Detection under Load (“Real World” Traffic) .13Figure 9 – Stability and Reliability Results .14Figure 10 – Number of Users .16Figure 11 – Installation Time (Hours) .16Figure 12 – Total Cost of Ownership (TCO) .17Figure 13 – Total Cost of Ownership per Protected Mbps .18Figure 14 – Scorecard .204
NSS LabsBreach Detection System Test Report – Cisco Advanced Malware ProtectionSecurity EffectivenessThis section aims to verify that the product can detect and log breaches and attempted breaches accurately. Alltests in this section are completed with no background network load.This test utilizes threats and attack methods that exist in the wild and are currently being used by cybercriminalsand other threat actors, based on attacks collected from NSS’ global threat intelligence network. For details on livetesting, refer to the Security Stack Methodology v1.5.2The ability of the product to detect and report successful infections in a timely manner is critical to maintaining thesecurity and functionality of the monitored network. Infection and transmission of malware should be reportedquickly and accurately, giving administrators the opportunity to contain the infection and minimize impact on thenetwork.As response time is critical in halting the damage caused by malware infections, the system under test (SUT)should be able to detect known samples, or analyze unknown samples, and report on them within 48 hours ofinitial infection and command and control (C&C) callback. Any SUT that does not alert on an attack, infection, orC&C callback within the detection window will not receive credit for the detection.The following use cases may be examined to determine if the SUT can identify a security risk within each scenario. 2Web-based malware attacks that rely on social engineering – The user is deceived into clicking a maliciouslink to download and execute malware.Web-based exploits – Also known as “drive-by downloads,” these occur when the user is infected merely byvisiting a web page that hosts malicious code.Socially engineered malware delivered via non-HTTP traffic – Malware is delivered by other common meanssuch as email, a cloaked executable (.jpeg, .exe, .zip), FTP, or an infected USB drive.Blended exploits – Also known as “doc-jacking,” these are typically delivered via common documents, such asMicrosoft Word documents or Excel spreadsheets, containing exploits. These exploits are typically deliveredvia network protocols.Offline infections – Remote users with mobile devices can become infected while outside the protection ofthe corporate network security. When infected devices are subsequently reattached to the corporatenetwork, the infection can ack-test-methodology-v155
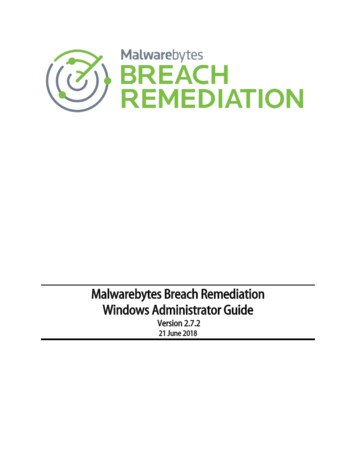
NSS LabsBreach Detection System Test Report – Cisco Advanced Malware ProtectionExploit and Malware DetectionFigure 2 depicts the percentage of malware and exploits detected by Cisco Advanced Malware Protection for eachof the delivery mechanisms used in the test: Drive-by and social exploits – Malicious software that is designed to take advantage of existing deficiencies inhardware or software systems, such as vulnerabilities or bugs HTTP protocol – Malware using HTTP protocol as its transport mechanism; that is, the malware is downloadedthrough a web browser SMTP/IMAP – Malware that uses email (SMTP/IMAP) as its transport mechanism; for example, a maliciousemail attachment SMB – Malware that uses the server message block (SMB) protocol as its transport mechanismFigure 2 – Exploit and Malware Detection Rates6
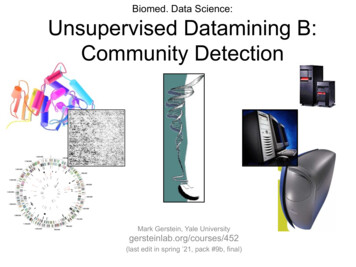
NSS LabsBreach Detection System Test Report – Cisco Advanced Malware ProtectionResistance to Evasion TechniquesEvasion techniques are a means of disguising and modifying attacks at the point of delivery in order to avoiddetection by security products. If a security device fails to correctly identify a specific type of evasion, an attackercould potentially deliver malware that the device normally would detect. Figure 3 provides the results of theevasion tests for Cisco Advanced Malware %Virtual machine100%Sandbox100%HTML obfuscation100%Layered evasions100%Figure 3 – Resistance to Evasion Results7
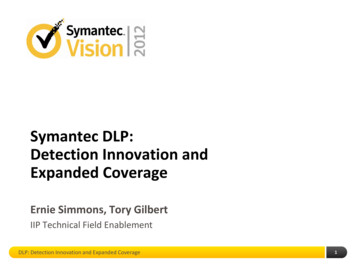
NSS LabsBreach Detection System Test Report – Cisco Advanced Malware ProtectionNetwork Device PerformanceThere is frequently a trade-off between Security Effectiveness and performance; a product’s Security Effectivenessshould be evaluated within the context of its performance, and vice versa. This ensures that detection does notadversely impact performance and that no security shortcuts are taken to maintain or improve performance. TheNSS performance tests are designed to validate that a network device inspection engine can maintain its detectionrate as background traffic increases.Raw Packet Processing Performance (UDP Traffic)This section uses UDP packets of varying sizes generated by test equipment. A constant stream of the appropriatepacket size — with variable source and destination IP addresses transmitting from a fixed source port to a fixeddestination port — is transmitted bidirectionally over the monitored network.Each packet contains dummy data and is targeted at a valid port on a valid IP address on the target subnet. Thepercentage load and frames per second (fps) figures across each inline port pair are verified by network monitoringtools before each test begins. Multiple tests are run and averages are taken where necessary.This traffic does not attempt to simulate any real-world network. No TCP sessions are created during this test, andthere is very little for the detection engine to do. However, each vendor will be required to write a signature todetect the test packets in order to ensure that they are being passed through the detection engine and not “fasttracked” through the network device. The first stage at which one or more attacks is not detected is recorded asthe maximum raw packet processing capacity for the network device.Figure 4 – Raw Packet Processing Performance (UDP Traffic)8
NSS LabsBreach Detection System Test Report – Cisco Advanced Malware ProtectionMaximum CapacityThe use of automated testing and traffic generation appliances allows NSS engineers to create “real-world,” highspeed traffic as the background load for the tests.These tests aim to stress the network device inspection engine and determine how it copes with high volumes ofconcurrent transmission control protocol (TCP) open connections and TCP connections per second. All tests in thissection are repeated at 25%, 50%, 75%, and 100%3 of the maximum rated throughput of the SUT. At each stage,multiple instances of malicious traffic are passed and the number detected is logged. The first stage at which oneor more attacks is not detected is recorded as the maximum capacity for that response size/traffic mix. Maximum concurrent TCP connections – This test determines the maximum concurrent TCP connections ofthe SUT with no data passing across the connections. This type of traffic is not typically found on a normalnetwork, but it provides the means to determine the maximum possible concurrent connections figure. Thefirst stage at which one or more attacks is not detected is recorded as the maximum concurrent TCP openconnections. Maximum TCP connections per second – This test determines the maximum TCP connection rate of the SUTwith one byte of data passing across the connections. This type of traffic is not typically found on a normalnetwork, but it provides the means to determine the maximum possible TCP connection rate. The first stage atwhich one or more attacks is not detected is recorded as the maximum TCP connections. Maximum HTTP connections per second – This test determines the maximum TCP connection rate of thenetwork device with a 1-byte HTTP response size. The response size defines the number of bytes contained inthe body, excluding any bytes associated with the HTTP header. A 1-byte response size is designed to providea theoretical maximum HTTP connections per second rate. The first stage at which one or more attacks is notdetected is recorded as the maximum HTTP connections.Results for the maximum concurrent TCP connections per second, maximum TCP connections, and maximum HTTPconnections per second tests are provided in Figure 5.3The 100% load will actually be less than 100% to allow headroom for malicious traffic.9
NSS LabsBreach Detection System Test Report – Cisco Advanced Malware ProtectionFigure 5 – Maximum Concurrent TCP Connections and Maximum TCP Connections per Second10
NSS LabsBreach Detection System Test Report – Cisco Advanced Malware ProtectionHTTP Capacity with No Transaction DelaysThese tests stress the HTTP detection engine and determine how the SUT copes with network loads of varyingaverage packet size and varying connections per second. By creating genuine session-based traffic with varyingsession lengths, the SUT is forced to track valid TCP sessions, thus ensuring a higher workload than for simplepacket-based background traffic. This provides a test environment that is as close to “real world” as it is possible toachieve in a lab environment, while also ensuring absolute accuracy and repeatability.Each transaction consists of a single HTTP GET request with no transaction delays (that is, the web server respondsimmediately to all requests). All packets contain valid payload (a mix of binary and ASCII objects) and address data.This test provides an excellent representation of a live network (albeit one biased toward HTTP traffic) at variousnetwork loads.All tests in this section are repeated at 25%, 50%, 75%, and 100%4 of the maximum rated throughput of the SUT.At each stage, multiple instances of malicious traffic are passed and the number detected is logged. The first stageat which one or more attacks is not detected is recorded as the maximum HTTP capacity for that responsesize/traffic mix.Figure 6 – Detection under Load (HTTP Capacity with No Transaction Delay)4The 100% load will actually be less than 100% to allow headroom for malicious traffic.11
NSS LabsBreach Detection System Test Report – Cisco Advanced Malware ProtectionHTTP Capacity with Transaction DelaysTypical user behavior introduces delays between requests and reponses; for example, “think time,” as users readweb pages and decide which links to click next. This group of tests is identical to the previous group except thatthese tests include a five-second delay in the server response for each transaction. This delay has the effect ofmaintaining a high number of open connections throughout the test, thus forcing the sensor to utilize additionalresources to track those connections.As with the tests that employ HTTP capacity with no transaction delays, tests are repeated at 25%, 50%, 75%, and100%5 of the maximum rated throughput of the BDS. In order to highlight any differences in performance, Figure 7presents the results for HTTP capacity both with and without transaction delays.Figure 7 – Detection under Load (HTTP Capacity with Transaction Delay)5The100% load will actually be less than 100% to allow headroom for malicious traffic.12
NSS LabsBreach Detection System Test Report – Cisco Advanced Malware Protection“Real-World” Traffic MixesThis test measures the performance of the network device under test in a “real-world” environment by introducingadditional protocols and real content while still maintaining a precisely repeatable and consistent backgroundtraffic load. The average result is a background traffic load that is closer to what may be found on a heavily utilized“normal” production network. All tests are repeated at 25%, 50%, 75%, and 100%6 of the maximum ratedthroughput of the SUT. At each stage, multiple instances of malicious traffic are passed and the number detected islogged. The first stage at which one or more attacks is not detected is recorded as the maximum rated throughputof the BDS. Results are presented in Figure 8.The Advanced Malware Protection performed in line with the throughput claimed by the vendor.Figure 8 – Detection under Load (“Real World” Traffic)6The 100% load will actually be less than 100% to allow headroom for malicious traffic.13
NSS LabsBreach Detection System Test Report – Cisco Advanced Malware ProtectionStability and ReliabilityLong-term stability is important, since a failure can result in serious breaches remaining undetected and thus notremediated. These tests verify the stability of a network device, along with its ability to maintain a minimum levelof detection while under normal load and while identifying malicious traffic. Products that cannot sustain loggingof legitimate traffic or that crash while under hostile attack will not pass.The Advanced Malware Protection is required to remain operational and stable throughout these tests and tooperate at 100% scanning capability, raising an alert each time malicious traffic is detected. If any malicious trafficpasses undetected, caused by either the volume of traffic or by the BDS failing for any reason, the product will fail.Figure 9 presents the results of the stability and reliability tests for the Cisco Advanced Malware Protection.Stability and ReliabilityResultDetection under extended attackPASSAttack detection – normal loadPASSProtocol fuzzing and mutation – detection portsPASSPersistence of dataPASSFigure 9 – Stability and Reliability Results14
NSS LabsBreach Detection System Test Report – Cisco Advanced Malware ProtectionManagement and ConfigurationSecurity devices are complicated to deploy, and essential components such as centralized management consoleoptions, log aggregation, and event correlation/management systems further complicate the purchasing decision.Understanding key comparison points will allow customers to model the overall impact on network service levelagreements (SLAs), estimate operational resource requirements to maintain and manage the systems, and betterevaluate the required skill and competencies of staff.Enterprises should include management and configuration during their evaluation, focusing on the following atminimum: General management and configuration – How easy is it to install and configure network devices and/oragents, and how easy is it to deploy multiple devices throughout a large enterprise network? Product customization – How easy is it to create custom configurations, edit them, and deploy them across anenterprise? Configurations may be policies, alert settings, and so on, depending on the product. Alert handling – How accurate and timely is the alerting, and how easy is it to drill down to locate criticalinformation needed to remediate a security problem? Reporting – How effective is the reporting capability, and how readily can it be customized?Total Cost of Ownership (TCO)Implementation of security solutions can be complex, with several factors affecting the overall cost of deployment,maintenance fees, and upkeep.The following factors should be considered over the course of the useful life of the solution: Product purchase – The cost of acquisition. Product maintenance fees – The recurring fees paid to the vendor (including software and hardware support,maintenance, and other updates). Installation time – The time required to take the device out of the box, configure it, put it into the network,apply updates and patches, and set up desired logging and reporting. Upkeep – The time required to apply periodic updates and patches from vendors, including hardware,software, and other updates. Management – Day-to-day management tasks including device configuration, policy updates, policydeployment, alert handling, and so on.For the purposes of this report, capital expenditure (capex) items are included for a single product only (the cost ofacquisition and installation).15
NSS LabsBreach Detection System Test Report – Cisco Advanced Malware ProtectionCalculating the Total Cost of Ownership (TCO)In procuring a BDS solution for the enterprise, it is essential to factor in both bandwidth and the number of users.NSS has found that the malware detection rates of some BDS network devices drop when they operate atmaximum capacity. NSS research has shown that, in general, enterprise network administrators architect theirnetworks for up to 2 Mbps per employee of sustained throughput. Consequently, an enterprise must deploy 500agents and/or one network device of 1,000 Mbps capacity to support 500 users.UsersMbps per UserNetwork Device ThroughputCentralized Management5002 Mbps1,000 Mbps1Figure 10 – Number of UsersInstallation TimeThis table depicts the number of hours of labor required to install each breach detection solution. The tableaccurately reflects the amount of time that NSS engineers, with the help of vendor engineers, needed to install andconfigure the BDS to the point where it operated successfully in the test harness, ignored legitimate traffic, anddetected prohibited or malicious traffic. This closely mimics a typical enterprise deployment scenario for a singleproduct.The installation cost is based on the time that an experienced security engineer would require to perform theinstallation tasks described above. This approach allows NSS to hold constant the talent cost and measure only thedifference in time required for installation. Readers should substitute their own costs to obtain accurate TCOfigures.ProductInstallationCisco Advanced Malware Protection v5.2.2015072320Figure 11 – Installation Time (Hours)168 hours (sensor) 5 min (per agent)
NSS LabsBreach Detection System Test Report – Cisco Advanced Malware ProtectionPurchase Price And Total Cost Of OwnershipCalculations are based on vendor-provided pricing. Where possible, the 24/7 maintenance and support option with24-hour replacement is utilized, since this is the option typically selected by enterprise customers. Prices are for a1000 Mbps single network BDS and/or 500 software agents, and maintenance only; the cost for a centralmanagement system (CMS) may be extra. For additional TCO analysis, including the CMS, refer to the TCOComparative Report.ProductCisco Advanced Malware ear 1CostYear 2CostYear 3Cost3-YearTCO 77,995 24,574 125,456 43,736 43,736 212,928Figure 12 – Total Cost of Ownership (TCO) Year 1 Cost is calculated by adding installation costs (US 75 per hour fully loaded labor x installation time) purchase price first-year maintenance/support fees.Year 2 Cost consists only of maintenance/support fees and cost of FireAMP agent.Year 3 Cost consists only of maintenance/support fees.This formula provides a TCO consisting of software, hardware, installation, and maintenance costs for a BDS thatincludes 1,000 Mbps of bandwidth and/or 500 agents. Additional management and labor costs are excluded, as areTCO calculations for additional devices or agents, since they are modeled extensively in the TCO ComparativeReport.17
NSS LabsBreach Detection System Test Report – Cisco Advanced Malware ProtectionValue: Total Cost of Ownership per Protected MbpsThere is a clear difference between price and value. The least expensive product does not necessarily offer thegreatest value if it offers significantly lower performance than only slightly more expensive competitors. The bestvalue is a product with a low TCO and high level of secure throughput (Detection Rate x NSS-Tested Throughput).Figure 13 depicts the relative cost per unit of work performed, described as TCO per Protected Mbps.ProductCisco Advanced Malware Protectionv5.2.2015072320Detection Rate3-Year TCONSS-TestedThroughputTCO perProtected Mbps99.2% 212,9281,000 Mbps 215Figure 13 – Total Cost of Ownership per Protected MbpsThe TCO per Protected Mbps was calculated by taking the 3-Year TCO and dividing it by the product of thedetection rate multiplied by the NSS-Tested Throughput. Therefore, 3-Year TCO/ (Detection Rate x NSS-TestedThroughput) TCO per Protected Mbps.18
NSS LabsBreach Detection System Test Report – Cisco Advanced Malware ProtectionAppendix: Product ScorecardDescriptionSecurity EffectivenessDetection RateExploitsDrive-by ExploitsSocial ExploitsMalware (various delivery irtual MachineSandboxHTML ObfuscationLayered EvasionsPerformanceRaw Packet Processing Performance (UDP Traffic)64 Byte Packets128 Byte Packets265 Byte Packets512 Byte Packets1024 Byte Packets1514 Byte PacketsMaximum CapacityMaximum Concurrent TCP ConnectionsMaximum TCP Connections per SecondMaximum HTTP Connections per SecondHTTP Capacity with No Transaction Delays44 KB HTTP Response Size – 2,500 Connections per Second21 KB HTTP Response Size – 5,000 Connections per Second10 KB HTTP Response Size – 10,000 Connections per Second4.5 KB HTTP Response Size – 20,000 Connections per Second1.7 KB HTTP Response Size – 40,000 Connections per SecondHTTP Capacity With Transaction Delays21 KB HTTP Response Size with Delay10 KB HTTP Response Size with Max Capacity (Mbps)1,0001,0001,0001,0001,0001,000Max Capacity15,000,00025,000125,000Max Capacity (Mbps)1,0001,0001,0001,0001,000Max Capacity (Mbps)1,0001,000
NSS LabsBreach Detection System Test Report – Cisco Advanced Malware ProtectionReal-World TrafficReal-World Protocol Mix (Enterprise Perimeter)Real-World Protocol Mix (Education)Stability & ReliabilityDetection Under Extended AttackAttack Detection – Normal LoadProtocol Fuzzing and Mutation – Detection PortsPersistence of DataTCOEase of UseInitial Setup (Hours) – HardwareInitial Setup (Hours) – SoftwareExpected CostsInitial Purchase (hardware as tested)Initial Purchase (software as tested – per agent)Setup Cost ( 75 Hour)Initial Purchase (enterprise management system)Annual Cost of Maintenance & Support (hardware)Annual Cost of Maintenance & Support (software – per agent)Annual Cost of Maintenance & Support (enterprise management)Total Cost of Ownership (TCO)Year 1Year 2Year 33-Year TCOFigure 14 – Scorecard20Max Capacity (Mbps)1,0001,000PASSPASSPASSPASS80.08333 77,995 0 3,725See Comparative 24,536 38See Comparative 125,456 43,736 43,736 212,928
NSS LabsBreach Detection System Test Report – Cisco Advanced Malware ProtectionTest MethodologyBreach Detection Systems (BDS): v2.0A copy of the test methodology is available on the NSS Labs website at www.nsslabs.com.Contact InformationNSS Labs, Inc.206 Wild Basin RoadBuilding A, Suite 200Austin, TX 78746 USAinfo@nsslabs.comwww.nsslabs.comThis and other related documents are available at: www.nsslabs.com. To receive a licensed copy or report misuse,please contact NSS Labs. 2015 NSS Labs, Inc. All rights reserved. No part of this publication may be reproduced, copied/scanned, stored on a retrievalsystem, e-mailed or otherwise disseminated or transmitted without the express written consent of NSS Labs, Inc. (“us” or
NSS Labs Breach Detection System Test Report – Cisco Advanced Malware Protection 2 Overview NSS Labs performed an independent test of the Cisco Advanced Malware Protection v5.2.2015072320. The product was subjected to thorough testing at the NSS