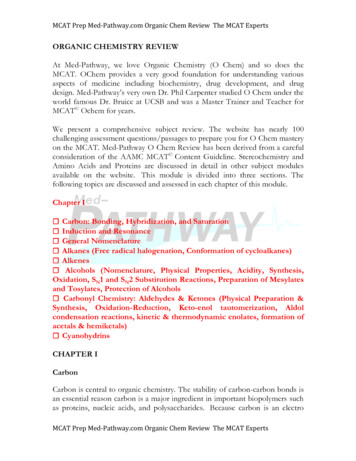
Transcription
Pathway Analysis :An Introduction
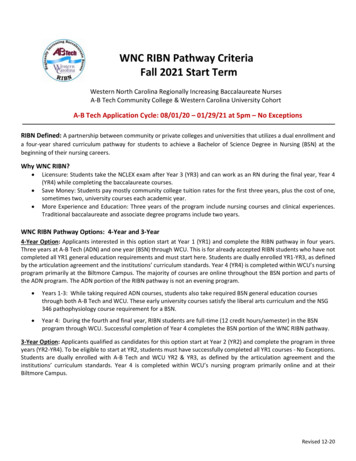
ExperimentsLiterature and other KBDataKnowledgeStructure in Data throughstatisticsStructure in Knowledge throughGO and other OntologiesGain insight into DataPathway Analysis
Why Pathway Analysis? Logical next step in any high-throughput experiment–––––––––Treat samplesCollect mRNALabelMicroarray ExperimentHybridizeScanNormalizeSelect differentially regulated genes Understand the biological phenomena involved High-throughput experiments per se do not producebiological findings Genes do not work alone, but in an intricate network ofinteractions Helps interpret the data in the context of biologicalprocesses, pathways and networks Global perspective on the data and problem at hand
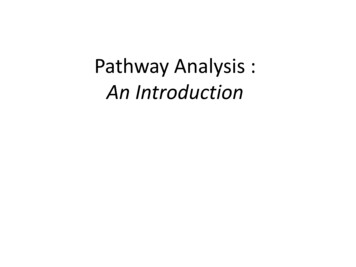
Trends in BioinformaticsSequence ComparisonTodayFunctional ComparisonTomorrowPathway DiscoveryBridge to the Future and fullyunderstanding of molecular basis ofdisease
Remember everything is a relationship(connected) what we are trying to dohere is find that relationship(connection)
What do we get out of PA? In-depth and contextualized findings to helpunderstand the mechanisms of disease inquestion Identification of genes and proteins associatedwith the etiology of a specific disease Prediction of drug targets Understand how to intervene therapeuticallyin disease processes Conduct targeted literature searches
What do we get out of PA? cont Data integration: integrate diverse biologicalinformation– Scientific literature, knowledge databases– Genome sequences– Protein sequences, motifs and structures Functional discovery: assign function to genes– Only 5% of known genes have assigned functions– Without understanding the function, no drug discovery can be done
Werner T. Curr Opion Biotechnology 2008
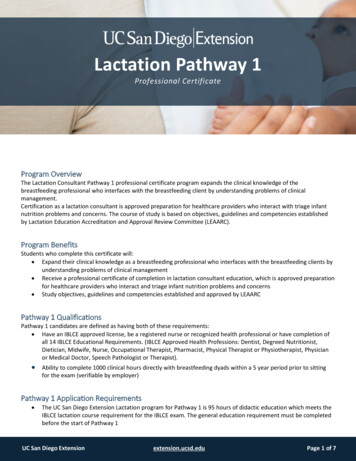
Available Tools for Pathway Analysis (non-exhaustive list) GeneGo/MetaCore (www.genego.com)Ingenuity Pathway Analysis (www.ingenuity.com)Pathway Studio (www. ariadnegenomics.com)GenMAPP (www. genmapp.com)WikiPathways (www. wikipathways.org)cPath (cbio.mskcc.org/cpath)BioCyc (www.biocyc.org)Pubgene (www.pubgene.org)PANTHER (www. pantherdb.org)WebGestalt (bioinfo.vanderbilt.edu/webgestalt/)ToppGene Suite(/toppgene.cchmc.org/)DAVID (david.abcc.ncifcrf.gov/) Pathway Painter(pathway.painter.gsa-online.de/)
Available Databases (non-exhaustive list)
Why Pathway Analysis Software? A learning tool– Study a group of gene products. A data analysis tool.– Which pathways are particularly affected?– What disease has similar biomarkers? A hypothesis generation tool– Can provide insight into mechanisms of regulation of your genes.Which is the likely causative agent for the observed changes?What is likely to happen as a result of these changes?– Suggest effects of gene knock-in or knock-outs.– Suggest side-effects of drugs.– Can highlight new phenomena that needs further investigation.What does the program not explain?
Caveat or how far the tools will takeyou in your quest for knowledge Tools are new Databases always evolving New Discoveries happen all the time
Caveats : Application usedSNPs which showed association with T2D (Po0.003) were included in this study and were mapped backed to regions on the genome, andthe predicted candidate genes were used for analysis.The top-10 ranking KEGG pathways per method are shown.Elbers et. al 2009
Caveats : Pathway DB usedSNPs which showed association with T2D (Po0.003) were included in this study and were mapped backed to regions on the genome andthe predicted candidate genes were used for analysis. The highest 10 ranking pathways per method are shown for Webgestalt ‘‘BioCarta’’ and PANTHER.Elbers et. al 2009
Caveats: Why Use of different databases– Eg. KEGG, BioCarta, Properietary Use of different updates– Use of different database updates Use of different statistical tests Use of different definitions/classification– Ex. Some use “inflammation” while in others pathwayis divided into inflammation related pathways like“Jak-STAT signaling” and “cytokine-cytokine receptorinteraction” pathways. While some use hybrid modelslike GO hybrid (IPA) and others use GO (Metacore)
Biological Pathway Building ProcessViswanathan G, et al. PLoS2008
Stages in Pathway Analysis 1st Stage Analysis– Data Driven Objective (DDO)– Used mainly in determining relationship information of genes orproteins identified in a specific experiment (e.g. microarray study)– Focused 2nd Stage Analysis– Knowledge Driven Objective (KDO)– Used mainly in developing a comprehensive pathway knowledge basefor a particular domain of interest (e.g. cell type, disease, system)– Intergration Repeat 1st Stage after generating new leads and hypothesis
Basic Concepts Node– Symbolizes a list of, for example, genes.– This is essentially a one-dimensional representation of the data Pathway– Linked list of interconnected nodes.– This is essentially a two-dimensional representation of the data Network– A network of cellular functions and regulations involvinginterconnected pathways– This is essentially a multi-dimensional representation of thedata
Pathway Creation Algorithms inMetaCore Analyze Network: Creates a list of possible networks, rankedaccording to how many objects in the network correspond to theuser's list of genes, how many nodes are in the network, how manynodes are in each smaller network. Analyze Networks (Transcription Factors): For every transcriptionfactor (TF) with direct target(s) in the root list, this algorithmgenerates a sub-network consisting of all shortest paths to this TFfrom the closest receptor with direct ligand(s) in the root list. Shortest paths: Uses Dijkstra’s shortest paths algorithm to find theshortest directed paths between the selected objects. Self regulation :Finds the shortest directed paths containingtranscription factors between the selected objects
Direct interactions: Draws direct interactions between selectedobjects.No additional objects are added to the network Auto expand : Draws sub-networks around the selected objects,stopping the expansion when the sub-networks intersect. Transcription regulation : Generates sub-networks centered ontranscription factors. Sub-networks are ranked by a P-value andinterpreted in terms of Gene Ontology. Analyze network (receptors) :For every receptor with directligand(s) in the root list, this algorithm generates a sub-networkconsisting of all shortest paths from that receptor to the closest TFwith direct target(s) in the root list.
An Example to illustrate the Stages inPathway Analysis 1st Stage Analysis– Data Driven Objective (DDO)– Used mainly in determining relationship information of genes orproteins identified in a specific experiment (e.g. microarray study)– Focused topic of interest 2nd Stage Analysis– Knowledge Driven Objective (KDO)– Used mainly in developing a comprehensive pathway knowledge basefor a particular domain of interest (e.g. cell type, disease, system)– Broad topic of interest Repeat 1st Stage after generating new leads and hypothesis
ExampleMicroRNA network interactions in REH/MSC cells
miRNA’s are 22-nucleotide non-coding RNAs that regulate gene expression through basepairing with target mRNAEndogenous Regulatory FunctionsInvertebratesdevelopmental timingneuronal differentiationcell proliferation, growth control, programmed cell deathMammalsembryogenesisstem cell maintenancehematopoietic cell differentiationbrain development
Background Experiments were performed to analyze the effect of low oxygenconditions and the interaction with the microenvironment in theexpression pattern of microRNA’s in REH cells. In this project we look at the possible interactions between themeasured microRNA’s with other molecules related to thepathogenesis of lymphocytic leukemia. In this initial stage we plan to put this complex system of microRNAinteractions in context with its surrounding interactions. It was discerned from the current analysis that the anti-apoptoticaction of microRNA 21 may be due to its interaction with Bcl-2 andMCL-1 in MSC cells. However, this needs to be further explored. In this initial report we looked at all the tested microRNAs in thecontext of its associated biological networks.
Experimental Details Briefly, REH cells were cultured alone or co-cultured withN.BM MSC (or H-Tert immortalized MCS) for 24 h and 48 hunder different pO2 conditions. At the end of 24 h and 48 hREH cells and MCS cells were sorted by Flow Cytometry andeach cell population was lysed with TRIZOL to extract totalRNA separately.MicroRNA assay details:The biotin-labeled cDNA targets are prepared by a simplereverse transcription into first strand cDNA. Total RNA isprimed for reverse transcription by a random Octomerconjugated with two biotins and a 5′ poly (A) tail. Thisprocedure results in an equal copy number of biotin–cDNAtarget to the templates of miRNA (see figure on left).Two 40 mer oligo probes, one for the mature miRNA and theother for precursor oligo, were designed from the sensestrand of both arms of the hairpin structure of the microRNAprecursor sequence collected from the Sanger Database. Theoligo probes were modified at the 5′ end with Amine-C6linker and ordered from Integrated DNA technology (IDT)(Coralville, IA, USA) at 50 or 100 μM stock concentration inH2O (see figure on left).REH: pre-B Acute lymphoblastic leukemia cell lineMSC: Mesenchymal stroma cell line
1: 1st Stage AnalysisNETWORK RELATIONSHIPS BASEDON THE EXPERIMENTAL INPUT
microRNA interaction partners Hub interactions
microRNA 21 and its relationship to Bcl-2 Why BCL-2 Inhibits BCL-2activity
microRNA 21, Mcl-1, interactions Why Mcl-1 Mir21 indirectlyinteracts withMcl-1
2: 1st Stage AnalysisGO ENRICHMENT FOR THEMEASURED MICRORNA
GO enrichment for the measured microRNA#Process1 release of cytochrome c from mitochondria2 general transcription from RNA polymerase IIpromoter3 cell death4 death5 regulation of gene expression6 apoptotic mitochondrial changes7 multi-organism process8 regulation of macromolecule metabolic process9 regulation of metabolic process10 regulation of macromolecule biosyntheticprocess11 regulation of cellular biosynthetic process12 regulation of biosynthetic 4.621.03E-061.06E-06
3: 1st Stage AnalysisDISEASE REPRESENTATION FOR THEMEASURED MICRORNA
Network-disease associations#Disease123456789101112Lymphoma, Intermediate-GradeLymphoma, DiffuseLymphoma, Small-CellLymphoma, Mantle-CellLymphoma, Small Cleaved-Cell, DiffuseDecompression SicknessBarotraumaVacciniaPoxviridae InfectionsLeukemia, B-CellLymphoma, B-CellLymphoma, 9E-079.68E-073.27E-06
4: 1st Stage AnalysisPOSSIBLE THERAPEUTIC TARGETS ANDOTHER INTERACTIONS FOR THEMICRORNA NETWORK
No directactivators/inhibitors formiR21 However,indirectactivators/inhibitors formiR21
Questions What new things have we learned? What type of things should we expect to learnin general? What new experiments do these suggest? How can this new knowledge be exploited?
Stages in Pathway Analysis 1st Stage Analysis– Data Driven Objective (DDO)– Used mainly in determining relationship information of genes orproteins identified in a specific experiment (e.g. microarray study)– Focused topic of interest 2nd Stage Analysis– Knowledge Driven Objective (KDO)– Used mainly in developing a comprehensive pathway knowledge basefor a particular domain of interest (e.g. cell type, disease, system)– Broad topic of interest Repeat 1st Stage after generating new leads and hypothesis– On and on we go
Demo Search and ExploreBuilding pathwaysAnalysisCanonical Pathways
A caveat Not every gene belongs to a pathway in thedatabase Pathways generated are a statisticalprobability rather than a biological certainty Context context context it matters a lot inpathway analysis Findings need to be proved experimentally
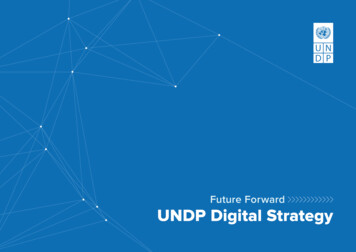
Putting it togetherCompoundChemicalproperties,QSAR, etc Network AnalysisExperimental Data (Optional)Interconnecting compound/metaboliteswith their predicted targets andother associated network objects.Import and overlayany experimental dataPredictedMetabolitesDB SimilaritySearchSimilar DBCompoundsLists of Targets (genes/proteins)for the input molecule and for metabolitesBased on the known targetsfor the Similar CompoundsFunctional Enrichment AnalysisBased on the Predicted Targets:-Drug target networks-Toxicity networks-Canonical Pathway Maps-Process networks-GO processes-Disease NetworksIntegrative Systems-Level Summaryof Predicted Primary and Secondary Effects of a query Compound
Trends in Bioinformatics Sequence Comparison Today Functional Comparison Tomorrow Pathway Discovery Bridge to the Future and fully understanding of molecular basis of disease. Remember everythi