Transcription
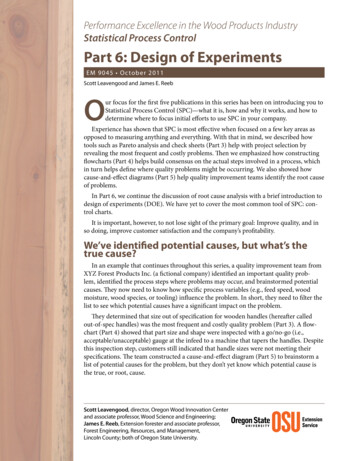
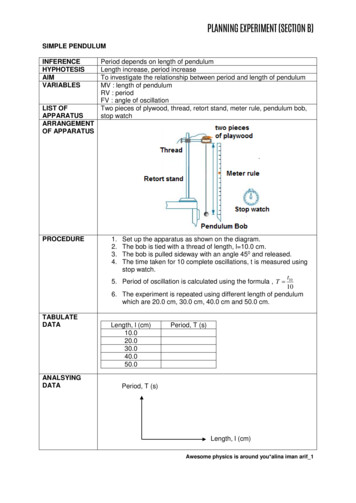
PLANNING EXPERIMENT (SECTION B)SIMPLE PENDULUMINFERENCEHYPHOTESISAIMVARIABLESLIST OFAPPARATUSARRANGEMENTOF APPARATUSPROCEDURETABULATEDATAANALSYINGDATAPeriod depends on length of pendulumLength increase, period increaseTo investigate the relationship between period and length of pendulumMV : length of pendulumRV : periodFV : angle of oscillationTwo pieces of plywood, thread, retort stand, meter rule, pendulum bob,stop watch1.2.3.4.Set up the apparatus as shown on the diagram.The bob is tied with a thread of length, l 10.0 cm.The bob is pulled sideway with an angle 450 and released.The time taken for 10 complete oscillations, t is measured usingstop watch.t5. Period of oscillation is calculated using the formula , T 10106. The experiment is repeated using different length of pendulumwhich are 20.0 cm, 30.0 cm, 40.0 cm and 50.0 cm.Length, l (cm)10.020.030.040.050.0Period, T (s)Period, T (s)Length, l (cm)Awesome physics is around you*alina iman arif 1
PLANNING EXPERIMENT (SECTION B)INERTIAINFERENCEHYPHOTESISAIMVARIABLESLIST OFAPPARATUSARRANGEMENTOF APPARATUSPROCEDURETABULATEDATAANALSYINGDATAInertia depends on massmass increase, period increaseTo investigate the relationship between period and massMV : massRV : periodFV : length of hacksaw bladeG-clamp, jigsaw blade, plasticine, triple beam balance, stop watch1.2.3.4.Set up the apparatus as shown on the diagram.20 g of plasticine is fixed at one end of a jigsaw blade.Displace the blade horizontally and release so that it oscillates.The time taken for 10 complete oscillations, t is measured usingstop watch.t5. Period of oscillation is calculated using the formula , T 10106. The experiment is repeated using different mass of plasticinewhich are 40 g, 60 g, 80 g and 100 g.Mass, m (g)20406080100Period, T (s)Period, T (s)Mass, m (g)Awesome physics is around you*alina iman arif 2
PLANNING EXPERIMENT (SECTION B)VELOCITYINFERENCEHYPHOTESISAIMVARIABLESLIST OFAPPARATUSARRANGEMENTOF y depends on heightHeight increase, velocity increaseTo investigate the relationship between height and velocityMV : heightRV : velocityFV : length of runwayTrolley, friction-compensated runway, ticker-timer, ticker-tape, a.c. powersupply, wood blocks, meter rule1.2.3.4.Set up the apparatus as shown on the diagram.The runway is raised up by wooden blocks to a height 20.0 cm.Switch on the ticker-timer and released the trolley.The final velocity, v is calculated from the ticker-tape when thetrolley reach the end of the runway.5. The experiment is repeated by rising the runway and placing thetrolley at height 30.0 cm, 40.0 cm, 50.0 cm and 60.0 cm.Height, h (cm)2030405060Velocity, v (ms-1)Velocity, v (ms-1)Height, h (cm)Awesome physics is around you*alina iman arif 3
PLANNING EXPERIMENT (SECTION B)ACCELERATION (I)INFERENCEHYPHOTESISAIMVARIABLESLIST OFAPPARATUSARRANGEMENT eration depends on massmass increase, acceleration decreaseTo investigate the relationship between mass and accelerationMV : mass // number of trolleyRV : accelerationFV : force acting on the objectTrolley, friction-compensated runway, ticker-timer, ticker-tape, a.c. powersupply, wood blocks, meter rule, elastic cord, weighing scale1. Set up the apparatus as shown on the diagram.2. Switch on the ticker-timer. Apply a force by stretching an elasticband to a fixed length and the length is maintain as the trolleyruns down the runway.3. Cut the ticker tape into strips containing 10 ticks each.4. Acceleration of the trolley is calculated by using the formula,v ua t5. The experiment is repeated by using 2 trolleys, 3 trolleys,4 trolleys and 5 trolleys.Mass of trolley, m (g) orNo. of trolley12345Accelerations, a (ms-2)Accelerations, a (ms-2)Mass of trolley, m (g) orNo. of trolleyAwesome physics is around you*alina iman arif 4
PLANNING EXPERIMENT (SECTION B)ACCELERATION (II)INFERENCEHYPHOTESISAIMVARIABLESLIST OFAPPARATUSARRANGEMENT OFAPPARATUSPROCEDURETABULATEDATAANALSYINGDATAForce depends on accelerationforce increase, acceleration increaseTo investigate the relationship between force and accelerationMV : forceRV : accelerationFV : mass of the objectTrolley, friction-compensated runway, ticker-timer, ticker-tape, a.c. powersupply, wood blocks, meter rule, elastic cord1. Set up the apparatus as shown on the diagram.2. Switch on the ticker-timer. Apply a force by stretching an elasticband to a fixed length and the length is maintain as the trolleyruns down the runway.3. Cut the ticker tape into strips containing 10 ticks each.4. Acceleration of the trolley is calculated by using the formula,v ua t5. The experiment is repeated by using 2 cords, 3 cords,4 cords and 5 cords.Force, F (N)12345Accelerations, a (ms-2)Accelerations, a (ms-2)Force, F (N)Awesome physics is around you*alina iman arif 5
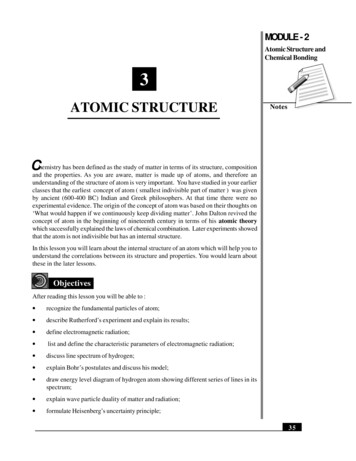
PLANNING EXPERIMENT (SECTION B)HOOKE’S LAW (EXTENSION OF THE SPRING)INFERENCEHYPHOTESISAIMVARIABLESLIST OFAPPARATUSARRANGEMENTOF on of the spring depends on force / weightforce / weight increase, extension of the spring increaseTo investigate the relationship between extension of the spring and force/ weightMV : force / weightRV : extension of the springFV : spring constant / diameter of the springSpring, slotted weight, retort stand, meter rule, clamp1. Set up the apparatus as shown on the diagram.2. Measured the initial length of the spring, lo.3. Slotted weight of 20 g is hung from the spring. The length of thespring, l is record.4. The extension of the spring, x is calculated by using the formula,x l lo5. The experiment is repeated by using slotted weight 40 g, 60 g,80 g and 100 g.Mass of load(g)20406080100Force, F (N)Extension of the spring,x (cm)Extension of the spring, x (cm)Force, F (N)Awesome physics is around you*alina iman arif 6
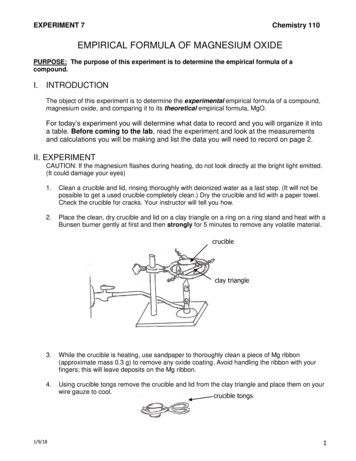
PLANNING EXPERIMENT (SECTION B)SOLID PRESSURE (FORCE & PRESSURE)INFERENCEHYPHOTESISAIMVARIABLESLIST OFAPPARATUSARRANGEMENTOF e depends on surface areaThe smaller the surface area the greater the pressure (depth of sinking)To investigate the relationship between surface area and pressure(depth of sinking)MV : surface areaRV : depth of sinkingFV : Weight / force / massPlasticine, slotted weight , wooden rod and meter rule1. Set up the apparatus as shown on the diagram.2. Start the experiment with a wooden rod has surface area 1 cm2.3. Placed the load of mass 200 g on the top of wooden rod asshown on diagram.4. Measure the depth of sinking made on the plasticine by usingmeter rule.5. Repeat the experiment 4 times with surface area of rod 2 cm2,3 cm2, 4 cm2 and 5cm2.Surface area , A (cm2)12345Depth of depression, d (cm)Depth of depression, d (cm)Surface area, A (cm2)Awesome physics is around you*alina iman arif 7
PLANNING EXPERIMENT (SECTION B)LIQUID PRESSURE (DENSITY & PRESSURE)INFERENCEHYPHOTESISAIMVARIABLESLIST OFAPPARATUSARRANGEMENTOF e depends on density of liquiddensity increase, different height in manometer increaseTo investigate the relationship between density and different height inmanometerMV : density of liquidRV : different height in manometerFV : depth of liquidMeter rule, manometer, rubber tube, thistle funnel, measuring cylinder,thin rubber sheet, salt water, coloured solution, retort stand1. Set up the apparatus as shown on the diagram.2. The thistle funnel is lowered into the salt water with density 0.5gcm-3 at a depth 20.0 cm.3. Observed and measure the different level, h at manometerthrough meter rule.4. The experiment is repeated by using different density of saltwater which are 1.0 gcm-3, 1.5 gcm-3, 2.0 gcm-3 and 2.5 gcm-3.Density, ϸ(gcm-3)0.51.01.52.02.5Differentlevel, h (cm)Different level, h (cm)Density, ϸ (gcm-3)Awesome physics is around you*alina iman arif 8
PLANNING EXPERIMENT (SECTION B)LIQUID PRESSURE (DEPTH & PRESSURE)INFERENCEHYPHOTESISAIMVARIABLESLIST OFAPPARATUSARRANGEMENTOF e (different height in manometer) depends on depth of liquiddepth increase, pressure (different height in manometer) increaseTo investigate the relationship between depth of liquid and pressure(different height in manometer)MV : depth of liquidRV : different height in manometerFV : density of liquidMeter rule, manometer, rubber tube, thistle funnel, measuring cylinder,thin rubber sheet, salt water, coloured solution, retort stand1. Set up the apparatus as shown on the diagram.2. The thistle funnel is lowered into the salt water with density0.5 gcm-3 at a depth 0.5 cm.3. Observed and measure the different level, h at manometerthrough meter rule.4. The experiment is repeated by lowered the thistle funnel atdifferent depth which are 1.0 cm, 1.5 cm, 2.0 cm and 2.5 cm.Depth, y (cm)0.51.01.52.02.5Different level, h (cm)Different level, h (cm)Depth, y (cm)Awesome physics is around you*alina iman arif 9
PLANNING EXPERIMENT (SECTION B)BUOYANT FORCEINFERENCEHYPHOTESISAIMVARIABLESLIST OFAPPARATUSARRANGEMENTOF APPARATUSPROCEDUREbuoyant force depends on volume of water displacedvolume of water displaced increase, buoyant force increaseTo investigate the relationship between volume of water displaced andbuoyant forceMV : volume of water displaced (height of rod immersed)RV : buoyant forceFV : density of liquid, cross-sectional area of rodMeter rule, retort stand, spring balance, aluminium rod, beaker, water,string1. Set up the apparatus as shown on the diagram.2. Record the weight of the aluminium rod in the air as W o fromthe spring balance.3. The aluminium rod is slowly lowered into water until height ofrod immersed is h 2.0 cm.4. Record the reading of spring balance as W.5. Buoyant force is calculated by using formula, Fb W o – W6. The experiment is repeated by lowered the aluminium rod atdifferent height which are 4.0 cm, 6.0 cm, 8.0 cm and 10.0 cm.TABULATE DATAheight of rod immersed, h (cm)2.04.06.08.010.0ANALSYING DATABuoyant force, NBuoyant force, NHeight of rodimmersed, h (cm)Awesome physics is around you*alina iman arif 10
PLANNING EXPERIMENT (SECTION B)BUOYANT FORCE (VOLUME WATER DISPLACED)INFERENCEHYPHOTESISAIMVARIABLESLIST OFAPPARATUSARRANGEMENTOF APPARATUSPROCEDUREvolume of water displaced depends on weightweight increase, volume of water displaced increaseTo investigate the relationship between weight and volume of waterdisplacedMV : weightRV : volume of water displacedFV : density of liquid, cross-sectional area of tubeTest tube, measuring cylinder, sand, water, beam balance, ball bearing1. Set up the apparatus as shown on the diagram.2. Record the volume of water, V1 a shown by the measuringcylinder.3. Put 5 g of ball bearing in the test tube.4. Record the volume of water as a V2.5. Calculated the volume of water displaced, V V2 – V16. The experiment is repeated by using different mass of ballbearing which are 10 g, 15 g, 20 g and 25 g.TABULATE DATAMass of ballbearing, g510152025ANALSYING DATAWeight, NVolume of water displaced,cm3Volume of water displaced, cm3Weight, NAwesome physics is around you*alina iman arif 11
PLANNING EXPERIMENT (SECTION B)HEAT (COOLING RATE)INFERENCEHYPHOTESISAIMVARIABLESLIST OFAPPARATUSARRANGEMENTOF APPARATUSPROCEDURERate of cooling depends on volume of waterVolume of water increase, rate of cooling increaseTo investigate the relationship between rate of cooling and volume ofwaterMV : volume of waterRV : temperature changeFV : time taken, power of heaterThermometer, beaker, wire gauze, Bunsen burner, tripod stand, water,stopwatch, measuring cylinder1.2.3.4.5.Set up the apparatus as shown on the diagram.Filled 50 cm3 of water into a beaker and heated to 50 oC.The bunsen burner is removed and the stopwatch is started.Record the temperature change, Ѳ after 30 seconds.The experiment is repeated by using different volume of waterwhich are 100 cm3, 150 cm3, 200 cm3 and 250 cm3.TABULATE DATAVolume of water,cm350100150200250ANALSYING DATATemperaturechange, Ѳ, oCTemperature change, Ѳ, oCVolume of water, cm3Awesome physics is around you*alina iman arif 12
PLANNING EXPERIMENT (SECTION B)HEAT (BOILING POINT)INFERENCEHYPHOTESISAIMVARIABLESLIST OFAPPARATUSARRANGEMENTOF APPARATUSPROCEDUREBoiling point depends on mass of impurityMass of impurity increase, boiling point increaseTo investigate the relationship between mass of impurity and boilingpointMV : mass of impurityRV : boiling pointFV : power of heater, volume of waterSalt, water, immersion heater, thermometer, beaker, power supply1. Set up the apparatus as shown on the diagram.2. Add 5 g of salt into the beaker with 500 ml of water.3. Switch on the immersion heater until the water is boiling with aconstant temperature.4. Record the boiling point using thermometer.5. The experiment is repeated by adding mass of salt, 10 g, 15 g,20 g and 25 g.TABULATE DATAMass of salt, g510152025ANALSYING DATABoiling point oCBoiling point oCMass of salt, gAwesome physics is around you*alina iman arif 13
PLANNING EXPERIMENT (SECTION B)HEAT (HEAT CAPACITY)INFERENCEHYPHOTESISAIMVARIABLESLIST OFAPPARATUSARRANGEMENTOF APPARATUSPROCEDURETemperature depends on massmass increase, temperature decreaseTo investigate the relationship between mass of object andtemperatureMV : mass of liquidRV : increase in temperatureFV : time taken of heating, specific heat capacity of liquidBeaker, polystyrene cup, slotted weight, Bunsen burner, thermometer,water, tripod stand1. Set up the apparatus as shown on the diagram.2. Fill a polystyrene cup with 200 cm3 of water. The initialtemperature, Ѳ1 is recorded.3. A 100 g slotted weight is heated in boiling water until 100oC.4. The slotted weight is quickly transferred from beaker to thepolystyrene cup.5. The highest temperature reached, Ѳ2 is recorded.6. The rise in temperature is determined by using the formulaѲ Ѳ2 – Ѳ1.7. The experiment is repeated by using slotted weight of mass200 g, 300 g, 400 g and 500 g.TABULATE DATAMass, m (g)Temperaturechange, Ѳ, ( oC)50100150200250ANALSYING DATATemperature change, Ѳ, ( oC)Mass, m (g)Awesome physics is around you*alina iman arif 14
PLANNING EXPERIMENT (SECTION B)GAS LAW (BOYLE’S LAW)INFERENCEHYPHOTESISAIMVARIABLESLIST OFAPPARATUSARRANGEMENTOF APPARATUSPROCEDUREvolume of air depends on pressure of airvolume of air increase, pressure of air decreaseTo investigate the relationship between volume of air and pressure ofairMV : volume of airRV : pressure of airFV : mass of air, temperature of airSyringe, rubber tube, Bourdon gauge, piston1. Set up the apparatus as shown on the diagram.2. Piston is push until the volume of air is 80 cm3.3. Observed and record the pressure of air through bourdongauge.4. The experiment is repeated by pushing the piston at differentvolume of air which are 70 cm3, 60 cm3, 50 cm3 and 40 cm3.TABULATE DATAVolume of air, V(cm3)8070605040ANALSYING DATAPressure of air, P(Pa)Pressure of air, P (Pa)Volume of air, V (cm3)Awesome physics is around you*alina iman arif 15
PLANNING EXPERIMENT (SECTION B)GAS LAW (CHARLES’ LAW)INFERENCEHYPHOTESISAIMVARIABLESLIST OFAPPARATUSARRANGEMENTOF APPARATUSPROCEDUREVolume of air depends on temperaturetemperature increase, volume of air increaseTo investigate the relationship between volume of air and temperatureMV : temperatureRV : volume of air (length of air column)FV : mass of air, pressure of airThermometer, meter rule, retort stand, concentrated sulphuric acid,water, rubber bands, capillary tube, Bunsen burner, wire gauge1. Set up the apparatus as shown on the diagram.2. Heat the water and stir continuously until the temperaturereaches 30oC.3. Observed and record the length of air column, L using meterrule.4. The experiment is repeated by heating the water totemperature 40oC, 50oC, 60oC and 70oC.TABULATE DATATemperature, oC3040506070ANALSYING DATAVolume of air, cm3Volume of air, cm3Temperature, oCAwesome physics is around you*alina iman arif 16
PLANNING EXPERIMENT (SECTION B)GAS LAW (PRESSURE LAW)INFERENCEHYPHOTESISAIMVARIABLESLIST OFAPPARATUSARRANGEMENTOF APPARATUSPROCEDUREpressure of air depends on temperature of airtemperature of air increase, pressure of air increaseTo investigate the relationship between pressure of air andtemperature of airMV : temperature of airRV : pressure of airFV : mass of air, volume of airBourdon gauge, round bottom flask, rubber tube, thermometer, water,bunsen burner, wire gauge1. Set up the apparatus as shown on the diagram.2. Heat the water and stir continuously until the temperaturereaches 30oC.3. Observed and record the pressure of air using bourdon gauge.4. The experiment is repeated by heating the water totemperature 40oC, 50oC, 60oC and 70oC.TABULATE DATATemperature of air, oC3040506070ANALSYING DATAPressure of air, PaPressure of air, PaTemperature of air, oCAwesome physics is around you*alina iman arif 17
PLANNING EXPERIMENT (SECTION B)LIGHT (REFRACTION)INFERENCEHYPHOTESISAIMVARIABLESLIST OFAPPARATUSARRANGEMENTOF APPARATUSPROCEDURETABULATEDATAANALSYINGDATAAngle of refraction depends on angle of incidenceAngle of incidence increase, angle of refraction increaseTo investigate the relationship between angle of incidence and angle ofrefractionMV : Angle of incidenceRV : angle of refractionFV : refractive index of glass block, density of the glass blockGlass block (or semicircular glass block), ray box, protractor, white paper,pencil, meter rule, single slid slide1. Set up the apparatus as shown on the diagram.2. Direct a narrow beam from the ray box at an angle of incidence,i 100.3. The refracted ray is marked and the refracted angle, r is measuredusing a protractor.4. The experiment is repeated for values of i 200, 300, 400 and 500.Angle of incidence, i (0)1020304050Angle of refracted, r (0)Angle of refracted, r (0)Angle of incidence, i (0)Awesome physics is around you*alina iman arif 18
PLANNING EXPERIMENT (SECTION B)LIGHT (IMAGE DISTANCE)INFERENCEHYPHOTESISAIMVARIABLESLIST OFAPPARATUSARRANGEMENTOF APPARATUSPROCEDURETABULATEDATAANALSYINGDATAImage distance depends on object distanceObject distance increase, image distance decreaseTo investigate the relationship between object distance and image distanceMV : object distanceRV : image distanceFV : focal length of convex lens, power of lensConvex lens (focal length 10.0 cm), light bulb, lens holder, screen, powersupply, meter rule1. Set up the apparatus as shown on the diagram.2. Placed the convex lens at a distance, u 12.0 cm from the lightbulb.3. Switch on the power supply. The screen is adjusted until sharpimage of the filament is formed.4. The image distance, v is measured using meter rule.5. The experiment is repeated for object distance, u 16.0 cm,20.0 cm, 24.0 cm and 28.0 cm.object distance, cm12.016.020.024.028.0image distance, cmimage distance, cmobject distance, cmAwesome physics is around you*alina iman arif 19
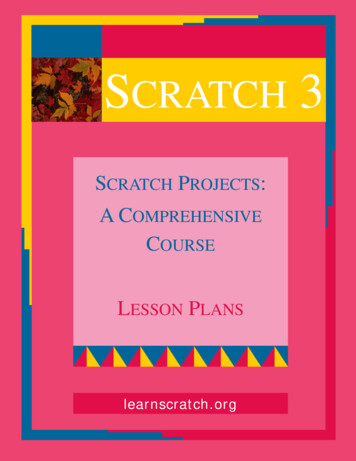
PLANNING EXPERIMENT (SECTION B)INTERFERENCE OF SOUNDKeyword :axDλ distance between two speakers distance between two consecutive loud or soft sound distance between the source and sound heard wavelengthINFERENCEHYPHOTESISAIMVARIABLESLIST OFAPPARATUSARRANGEMENTOF APPARATUSPROCEDUREx depends on aa increase, x decreaseTo investigate the relationship between a and xMV : a, distance between two speakersRV : x, distance between two consecutive loud or soft soundFV : D, distance between the speakers and the sound heardAudio signal generator, loudspeakers, meter rule1.2.3.4.Set up the apparatus as shown on the diagram.Adjust the separation, a of the two loudspeakers to 1.0 mSwitch on the generator.An observer stands 5.0 m in front of the loudspeakers and walk in astraight line parallel to the loudspeakers.5. The distance between two consecutive loud sounds heard, x ismeasured by the meter rule.6. Repeat the experiment by adjusting the distance between twoloudspeakers which is 1.2 m, 1.4 m. 1.6 m and 1.8 m.Awesome physics is around you*alina iman arif 20
PLANNING EXPERIMENT (SECTION B)TABULATEDATADistance, a/m1.01.21.41.61.8Distance, x/mANALSYINGDATAAwesome physics is around you*alina iman arif 21
PLANNING EXPERIMENT (SECTION B)WAVE (DEPTH AND WAVELENGTH)INFERENCEHYPHOTESISAIMVARIABLESLIST OFAPPARATUSdepth affects wavelengthDepth increases, wavelength increasesTo investigate the relationship between depth and wavelengthMV : depth, h or number of PerspexRV : wavelength, λFV : frequencyd.c. power supply, ripple tank and accessories, lamp, meter rule, whitepaper, 5 pieces of Perspex / glass, stroboscopeARRANGEMENTOF APPARATUSPROCEDURETABULATEDATA1. The current was switched on.2. The put one piece of Perspex in the ripple tank.3. Mark the position of wave on the white paper as seen through theStroboscope.4. Measure the wavelength with meter rule.5. The procedure was repeated for different depth by putting pieces ofPerspex on top of the previous Perspex in the ripple tank; 2,3,4 and5 number of Perspex.Depth / cm or number ofPerspex12345Wavelength /cmANALSYINGDATAAwesome physics is around you*alina iman arif 22
PLANNING EXPERIMENT (SECTION B)ELECTRICITY (RESISTANCE AND LENGTH OF WIRE) (I)INFERENCEHYPHOTESISAIMVARIABLESLIST OFAPPARATUSARRANGEMENTOF APPARATUSPROCEDURETABULATEDATAResistance depends on the length of wireThe longer the wire, the higher the resistanceTo investigate the relationship between length of wire and its resistanceMV : length of wire, lRV : resistance, RFV : cross section area, A // diameter of wireConstantan wire, dry cells, rheostat, voltmeter, ammeter, meter rule,connecting wires, switch and jockey1.2.3.4.5.6.Turn on the switch.Place the jockey at length of wire, l 20.0 cm.Adjust the rheostat until the ammeter shows, I 0.5 A .Measure the potential difference, V.Calculate resistance, R using the formula, R V/I.Repeat the experiment for different lengths, l 40.0 cm, 60.0 cm,80.0 cm and 100.0 cm.length of wire, l / cm20.040.060.080.0100.0resistance, R / ΩANALSYINGDATAAwesome physics is around you*alina iman arif 23
PLANNING EXPERIMENT (SECTION B)ELECTRICITY (RESISTANCE AND LENGTH OF WIRE) (II)INFERENCEHYPHOTESISAIMVARIABLESLIST OFAPPARATUSARRANGEMENTOF nce depends on length of conductorLength of conductor increase, resistance increaseTo investigate the relationship between resistance and length ofconductorMV : length of conductorRV : resistanceFV : cross-sectional area of the conductor, diameter of the conductor,resistivity of the conductor, temperatureDry cell, switch, ammeter, constantan wire, voltmeter, wire connecting,meter rule1. Switched on the switch and start the experiment with length ofconstantan wire with length 10.0 cm as shown on diagram above.2. Observe and record the reading of ammeter and voltmeter.V3. Resistance is calculated by using the formula R .I4. Repeat the experiment 4 times with different length of constantanwire which are 15.0 cm, 20.0 cm. 25.0 cm and 30.0 cm.Length , l (cm)10.015.020.025.030.0R (Ω)R (Ω)Length , l (cm)Awesome physics is around you*alina iman arif 24
PLANNING EXPERIMENT (SECTION B)ELECTRICITY (OHM’S LAW)INFERENCEHYPHOTESISAIMVARIABLESLIST OFAPPARATUSARRANGEMENTOF APPARATUSPROCEDURETABULATEDATAThe current flowing through the bulb is influenced by the potentialdifference across itThe higher the current flows through a wire, the higher the potentialdifference across it.To investigate the relationship between current and potential difference fora constantan wire.MV : current, IRV : potential difference, VFV : length of the wire // cross sectional areaConstantan wire, dry cells, rheostat, voltmeter, ammeter, meter rule,connecting wires1. Set up the apparatus as shown in the figure.2. Turn on the switch and adjust the rheostat so that the ammeterreads the current, I 0.2 A.3. Read and record the potential difference, V across the wire throughvoltmeter.4. Repeat experiment for I 0.3 A, 0.4 A, 0.5 A and 0.6 A.Current, I /A0.20.30.40.50.6Volt, V / VANALSYINGDATAAwesome physics is around you*alina iman arif 25
PLANNING EXPERIMENT (SECTION B)ELECTROMAGNETISME (CURRENT AND NO. OF TURNS)INFERENCEHYPHOTESISAIMVARIABLESLIST OFAPPARATUSARRANGEMENTOF APPARATUSPROCEDURETABULATEDATAStrength of the magnetic field depends on currentWhen current increase, number of paper clips attracted increaseTo investigate the relationship between current and number of paper clipsattractedMV : Current, IRV : Number of paper clips attracted, NFV : Number of turns of wire in the solenoidLong iron rod, wooden clamp, insulated (PVC) copper wire, low-voltagehigh current d.c supply, ammeter, rheostat, retort stand, paper clips, beaker1. Arrange the apparatus as shown in the diagram above.2. The switch is closed and the rheostat is adjusted so that thecurrent, I 0.5 A.3. The beaker is withdrawn and the current is switch off.4. The paper clips which fall onto the table a collected and counted.5. The experiment is repeated with different value of currentswhich is I 1.0 A, 1.5 A, 2.0 A and 2.5 A.Current, I / A0.51.01.52.02.5Number of paper clips attracted, NANALSYINGDATAAwesome physics is around you*alina iman arif 26
PLANNING EXPERIMENT (SECTION B)ELECTROMAGNETISME (INDUCED CURRENT)INFERENCEHYPHOTESISAIMVARIABLESLIST OFAPPARATUSARRANGEMENTOF APPARATUSPROCEDURETABULATEDATAANALSYINGDATAInduced current depend on the height of magnet bar releaseThe induced current increases when the height of magnet bar releaseincreasesTo investigate the relationship between height of magnet bar release andthe induced current.MV : height of magnet bar releaseRV : induced currentFV : number of the turns in the coils.Bar magnet, cardboard tube, ammeter, insulated copper wire and meterrule.1. Set up the apparatus as shown on the diagram.2. Release the bar magnet at height, h 5.0 cm above the top endof the solenoid.3. Observe and record the reading of induced current through theammeter.4. Repeat the experiment 4 times with different height of magnet barrelease which are 10.0 cm, 15.0 cm, 20.0 cm and 25.0 cm.height of magnet bar release, h (cm)5.010.015.020.025.0induced current, I (A)I (A)h (cm)Awesome physics is around you*alina iman arif 27
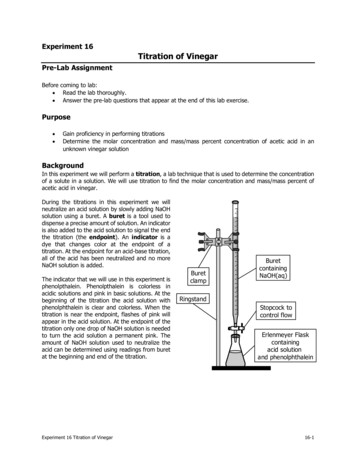
PLANNING EXPERIMENT (SECTION B)ELECTROMAGNETISME (TRANSFORMER)INFERENCEHYPHOTESISAIMVARIABLESLIST OFAPPARATUSARRANGEMENTOF APPARATUSPROCEDURETABULATEDATAANALSYINGDATAOutput voltage depends on the number of turns of wire in the secondarycoliThe number of turns of wire in the secondary coil increase, outputvoltage increaseTo investigate the relationship between output voltage and the number ofturns of wire in the secondary coilMV : number of turns of wire in the secondary coilRV : output voltageFV : number of turns of wire in the primary coilac voltage, primary coil, secondary coil, soft iron core, output voltage,number of turns of secondary coil, number of turns of primary coil1. Use 900 turns copper coil as the primary coil and 100 turns ofsecondary coil of the transformer.2. The switch is on and the output voltage is measured by using avoltmeter.3. Repeat the experiment 4 times with different number of turns ofsecondary coil which are 200 turns, 300 turns, 400 turns and 500turns.Ns100200300400500V (V)V (V)NsAwesome physics is around you*alina iman arif 28
FV : spring constant / diameter of the spring LIST OF APPARATUS Spring, slotted weight, retort stand, meter rule, clamp ARRANGEMENT OF APPARATUS PROCEDURE 1. Set up the apparatus as shown on the diagram. 2. Measured the initial length of the spring, l o. 3. Slotted weight of 20 g is hung from the spring. T