Transcription
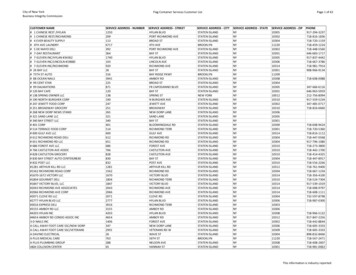
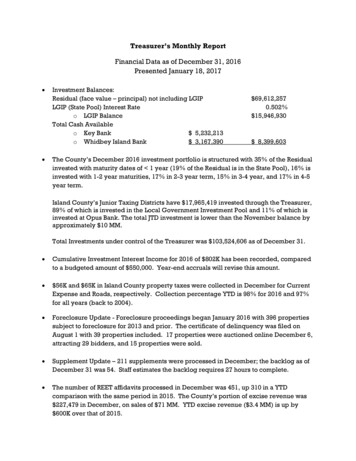
Treasurer’s Monthly ReportFinancial Data as of December 31, 2016Presented January 18, 2017 Investment Balances:Residual (face value – principal) not including LGIPLGIP (State Pool) Interest Rateo LGIP BalanceTotal Cash Availableo Key Bank 5,232,213o Whidbey Island Bank 3,167,390 69,612,2570.502% 15,946,930 8,399,603The County’s December 2016 investment portfolio is structured with 35% of the Residualinvested with maturity dates of 1 year (19% of the Residual is in the State Pool), 16% isinvested with 1-2 year maturities, 17% in 2-3 year term, 15% in 3-4 year, and 17% in 4-5year term.Island County’s Junior Taxing Districts have 17,965,419 invested through the Treasurer,89% of which is invested in the Local Government Investment Pool and 11% of which isinvested at Opus Bank. The total JTD investment is lower than the November balance byapproximately 10 MM.Total Investments under control of the Treasurer was 103,524,606 as of December 31. Cumulative Investment Interest Income for 2016 of 802K has been recorded, comparedto a budgeted amount of 550,000. Year-end accruals will revise this amount. 56K and 65K in Island County property taxes were collected in December for CurrentExpense and Roads, respectively. Collection percentage YTD is 98% for 2016 and 97%for all years (back to 2004). Foreclosure Update - Foreclosure proceedings began January 2016 with 396 propertiessubject to foreclosure for 2013 and prior. The certificate of delinquency was filed onAugust 1 with 39 properties included. 17 properties were auctioned online December 6,attracting 29 bidders, and 15 properties were sold. Supplement Update – 211 supplements were processed in December; the backlog as ofDecember 31 was 54. Staff estimates the backlog requires 27 hours to complete. The number of REET affidavits processed in December was 451, up 310 in a YTDcomparison with the same period in 2015. The County’s portion of excise revenue was 227,479 in December, on sales of 71 MM. YTD excise revenue ( 3.4 MM) is up by 600K over that of 2015.
Distribution of Investment Maturity Dates - Island County Residual Portfolio - December 20164 - 5 Years, 14,852,000 ,17% 1 Year, 30,038,243 , 35%3 - 4 Years, 12,500,000 ,15%LGIP (Overnight) 15,946,930,19% of Portfolio 1 Year1 - 2 Years2 - 3 Years, 14,755,000 ,17%2 - 3 Years1 - 2 Years, 13,413,944 ,16%3 - 4 Years4 - 5 Years
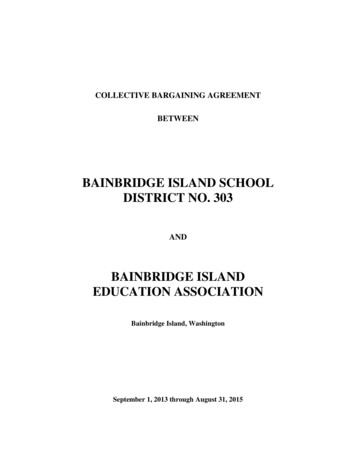
ISLAND COUNTY INVESTMENT PORTFOLIO BY TYPEAs of December 31, 2016Prepared January 23, 2017Certificates of Deposit 1,520,0001FAMCA (Farmer Mac)2,412,0002FFCB4,500,0003FHLB14,243,9444FHLMC (Freddie Mac)9,000,0005FNMA23,675,0006Municipal Bonds13,175,0007Local Government Investment Pool15,946,930Money Market (Opus Bank)29,3138Resolution Funding Corp1,057,000Total - Residual 8.64%0.03%1.24%100.00%Notes:1 Federal Agricultural Mortgage Corporation is a government-sponsored enterprise providing a secondary market foragricultural real estate mortgage loans, rural housing mortgage loans, and rural utility cooperative loans. It wasestablished in the Agricultural Credit Act of 1987 and is overseen by the Farm Credit Administration.2 Federal Farm Credit Bank was created by an Act of Congress in 1916 to create to support agricultural and ruralcommunities with reliable, consisten credit and financial services. It is regulated and examined by the Farm CreditAdministration, an independent agency in the Executive Branch of the US Government.3 Federal Home Loan Bank was chartered in 1932 by the US Congress to improve the availability of funds tosupport home ownership. It purchases mortgages.4 Freddie Mac was chartered by Congress in 1970 to stabilize the nation's residential mortgage markets and expandopportunities for homeownership and affordable rental housing. It purchases mortgage loans and mortgagerelated securities for investment.5 Fannie Mae is the leading source of residential mortgage credit in the US secondary market to provide reliable,large-scale access to affordable mortgage credit in all communities across the country at all times so people canbuy, refinance, or rent homes.6 A municipal bond is debt issued by a local government or its agencies. Municipal bonds may be generalobligations of the issuer or secured by specified revenues (e.g., property taxes or specific fees or tolls). Incomefrom municipal bonds may be tax exempt or taxable. If they are tax exempt they are very attractive to certainindividual investors for the tax benefits.7 The Local Government Investment Pool is a money market fund operated for the participation of eligiblegovernmental entities with surplus funds - it is comprised of public funds placed in the custody of the Office of theState Treasurer for investment and reinvestment as defined by RCW 43.250.020. The pool seeks to providecurrent income by investing in high-quality, short term money market instruments and offers daily contributions andwithdrawals to optimize liquidity and returns.8 Resolution Funding Corporation is a government agency established by Congress in 1989 to issue bailout bondsand raise funds for the activities of Resolution Trust Corporation (a government agency established in 1989 anddisbanded in 1996 that administered federal savings and loan institutions that were insolvent between 1989 andAugust 1992 by either bailing them out or merging them), as well as to administer struggling institutions inheritedfrom the disbanded Federal Savings and Loan Corporation. Interest payments are guaranteed by the US
Certificates of DepositResolution Funding Corp 2%1%Money Market (Opus Bank)0%FAMCA (Farmer Mac)3%Island County ResidualInvestments by TypeDecember 31, 2016Federal FarmCredit Bank5%Local Government InvestmentPool19%Federal Home Loan Bank17%Municipal Bonds (State andLocal)15%Certificates of DepositFHLMC (Freddie Mac)10%FAMCA (Farmer Mac)Federal Farm Credit BankFederal Home Loan BankFHLMC (Freddie Mac)FNMA (Fannie Mae)Municipal Bonds (State and Local)Local Government Investment PoolMoney Market (Opus Bank)FNMA (Fannie Mae)28%Resolution Funding Corp
ISLAND COUNTY INVESTMENT PORTFOLIOAs of December 31, 2016Prepared April 18, 2017Island County Residual*State Pool (LGIP)Opus Bank Money MarketLong Term Investments (Fixed Income) Total Junior Taxing District FundsState Pool (LGIP)Opus Bank Money MarketTotal Investment PortfolioReport of Investments by Fund is attached*County portion of IC ResidualJTD portion of IC Residual tal 15,990,419.001,975,000.0017,965,419.00 103,524,606.19 56,118,037.3829,441,149.8185,559,187.19Total 65.6%34.4%
INVESTMENTS BY FUND SUMMARY REPORTEffective report date:Fund IDCASHRSaturday, December 31, 2016Fund Name- RESIDUALTotal for Fund Type CPrincipalInterest toMaturity85,559,187.19 4,207,814.0685,559,187.19 4,207,814.06CM1EX- Cemetery District #135,000.00177.69CM2EX- Cemetery District #280,000.00291.92FD2EX- Fire Dist. #21,365,000.00-1,406.72POMMT- Port of Mabana31,000.00157.81POSMT- Port of South Whidbey411,000.00160.50WSWMT- Swantown Water Mtnce.150,000.00761.52WTRQU- Water Quality Fund300,000.001,523.042,372,000.001,665.76Total for Fund Type DWPCCT- PENN COVE WATER CONST.985,000.005,013.12WPCMT- Penn Cove Water & Sewer Dist.810,000.004,121.191,795,000.009,134.31Total for Fund Type D14PK2MT- SW Park & Rec. Maintenance270,000.00101.68PK2RE- SW Park & Rec Reserve203,700.00183.82Total for Fund Type D15WCACA- Camano Vista Water CapitalTotal for Fund Type D3FD1CA- Fire Dist. #1 Capital ImprovementFD1EX- Fire Dist. #1FD1HC- Fire Dist #1 HealthcareFD1RE- Fire Dist #1 Reserve FundFD1TR- Fire Dist #1 Trust FundTotal for Fund Type D6FD3EX- Fire Dist. #3Total for Fund Type D7FD5CA- FIRE DIST #5 CAPITAL PROJECTSMonday, April 24, .002,589.58Page 1 of 2
INVESTMENTS BY FUND SUMMARY REPORTEffective report date:Fund IDSaturday, December 31, 2016Interest toMaturityFund NamePrincipalFD5EX- Fire Dist. #51,227,500.003,824.56FD5TR- FIRE DIST. #5 TRUST FUND18,276.0063.99Total for Fund Type D82,100,776.006,478.12201AS- SD #201 ASB303,000.00122.55201BR- SD #201 Bond Redemption468,000.001,116.17201GE- SD #201 General1,267,000.00512.46201TV- SD #201 Transportation Vehicle263,000.00638.25Total for Fund Type S1206CA- SD #206 Capital Project Fund #2206GE- SD #206 General206NT- SD #206 Non-Expandable TrustTotal for Fund Type S6Grand TotaMonday, April 24, 524,606.19 4,238,582.90Page 2 of 2
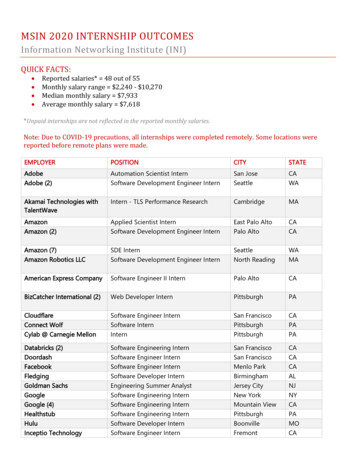
Island County Residual Investments by Broker/BankAs of December 31, 2016Prepared April 24, 2017Alamo CapitalFirst Empire SecuritiesFirst Liberties FinancialGreat Pacific SecuritiesKeyBank Capital MarketsMulti-Bank SecuritiesMutual SecuritiesOpus BankPiper JaffrayState Treasurer Local Government Investment PoolStifel Nicolaus & Co.Time Value InvestmentsVining Sparks InvestmentWells Fargo SecuritiesWhidbey Island BankTotal - Residual 0.001,500,000.001,000,000.00 85,559,187.19
Reconciliation of Investment Pool (Residual) as of December 31, 2016Island County, WAPrepared April 18, 2017Island County Residual - per Investment ReportsState Pool (LGIP)Long-Term Investments (includes Opus Bank Money Market) Junior Taxing District Funds - Per Investment ReportsState PoolLong-Term Investments (Opus Bank Money Market)Total 15,990,419.001,975,000.0017,965,419.00 103,524,606.19Note 1Island County Residual - Per Financial Accounting Records:County Funds' Uninvested Balances - Cash 62,691,069.04Less: Unamortized Premium/Discount @ 12/31/16(259,539.89)Less: Interest Receivable @ 12/31/16(4,472.91)Plus: Adjustment to FMV @ 12/31/16734,443.15 Solid Waste Uninvested Balance - Contingency - Cash (Reserve)JTD Funds' Uninvested Balances - CashLess: Cash in Bank - Key Bank (G/L Balance)Cash in Bank - Whidbey Island Bank (G/L Balance)Cash in Bank - Solid Waste Contingency portion of KB Balance (G/L) ent Portfolio 15,946,929.7669,612,257.4385,559,187.19 Note 1
Analysis of Investment Income 2016Island County, WAPrepared April 18, 2017Investment Interest Income, 2016Reversal of 2015 YE Accrual, January 2016 Receipt of Investment Interest Income(net of distributions to JTD)Amortization of premium paid on investments (netof discount received on investments)Accrual of 2016 Interest earned, not rec'dprior to year end (to be reversed 1/17)Accrual of 2016 Interest earned to be paidat maturity of investmentsInvestment Interest Income .31910,067.90Investment Gain/Loss, 2016Miscellaneous Gain/Loss Investments Matured/Sold in 2016* Miscellaneous Gain/Loss Investments, UnrealizedMiscellaneous Investment Loss 56,543.12459,951.89516,495.01Adjustment to Fair Market Value, 2016Beginning Balance, 1/1/16 Adjustments due to Maturity or Sale during 2016Adjustment to Fair Market Value as of 12/31/16Ending Balance, 12/31/2016 (350,739.94)76,248.68(459,951.89)(734,443.15)Note* The Loss on investments matured/sold in 2016 is reversals of previously unrecognizedmarket gain/loss adjustments. There were no "losses" on investments matured orsold in 2016, only reversals of market adjustments from the prior year. These willbe characterized as adjustments to interest earned starting January 1, 2017.
Long-Term Investments (includes Opus Bank Money Market) 69,612,257.43 85,559,187.19 Note 1 Junior Taxing District Funds - Per Investment Reports State Pool 15,990,419.00 Long-Term Investmen