Transcription
Lincoln Vital Signs2019 ReportBe Informed. Get Involved.
VERSION 1.0Prepared ByThe University of Nebraska Public Policy Center is a university-wide, multidisciplinary research andoutreach center committed to addressing complex issues by linking academic research, stakeholderopinions, and practical experience through innovative and creative solutions.ppc.nebraska.edu 402.472.5678 ppc@nebraska.eduNancy Shank, PhD, MBA, Associate DirectorStacey Hoffman, PhD, Research ManagerTarik Abdel-Monem, JD, MPH, Senior Research SpecialistTaylor Smith, MPA, Graduate Research AssistantThe authors gratefully acknowledge the assistance of their colleagues at the Public Policy Center:Stacie Kotschwar, PhD; Lindsey Button, MSc; Alyssa Sloane; and Khadijah Davis.2019 Lincoln Vital Signs Reporti
Table of ContentsTOC MainAcknowledgements. iiiExecutive Summary. 1About the Report. 2Prosper Lincoln. 3Community Profile. 5Basic Needs.31Education.48Health.59Safety and Security.76Appendices.83List of Tables.84List of Maps.85List of Figures.86Data Indicators/Sources.922019 Lincoln Vital Signs Report : Table of Contentsii
AcknowledgementsSponsorsThe following organizations contributed leadership and financial support:Buffett Early Childhood Fund, Eric BuchananCity of Lincoln, Jennifer Brinkman & Adelle BurkCommunity Health Endowment, Lori SeibelCooper Foundation, Victoria GrassoDuncan Family Trust, Connie DuncanFoundation for Lincoln Public Schools, Wendy VanHarbor of Dreams, Ashley RinakerLancaster County, Sara HoyleLincoln Partnership for Economic Development, Pat HavertyLincoln Community Foundation, Barbara Bartle & Michelle PaulkNebraska Children and Families Foundation, Betty MedingerThe Peter Kiewit Foundation, Jeff KutashUnited Way of Lincoln and Lancaster County, Linda Robinson RutzUniversity of Nebraska Foundation, Jaci KleinWoods Charitable Fund, Tom Woods2019 Lincoln Vital Signs Report : Acknowledgementsiii
AcknowledgementsSpecial ThanksThe following individuals assisted in the collection, analysis, or presentation of this report:Ryan Caldwell, Institutional Effectiveness and Analytics, University of Nebraska-LincolnJason Casey, Institutional Effectiveness and Analytics, University of Nebraska-LincolnJeff Chambers, Center on Children, Families, and the LawLauri Cimino, Nebraska Department of Education – Step Up to QualityChief Michael Despain, Lincoln Fire and RescueKatie Flood, Lincoln Police DepartmentPat Haverty, Lincoln Partnership for Economic DevelopmentRaju Kakarlapudi, Lincoln-Lancaster County Health DepartmentClaire Lindquist, Lincoln Police DepartmentErin Rourke, Region V SystemsBryan Seck, Prosper Lincoln/Lincoln Partnership for Economic DevelopmentMichelle Suarez, Prosper Lincoln/Nebraska Children and Families FoundationElizabeth Svoboda, Buffet Early Childhood InstituteSergeant John Walsh, Lincoln Police DepartmentTeresa Wanser, Lincoln Public SchoolsGreg Welch, Buffet Early Childhood InstituteMarcia White, Community Health Endowment2019 Lincoln Vital Signs Report : Acknowledgementsiv
Executive SummarySince 2014, Lincoln Vital Signs, authored by the University of Nebraska Public Policy Center, has been acommunity-wide data resource. The 2019 Lincoln Vital Signs report is sponsored by Lincoln’s and Nebraska’slargest public and private charitable organizations. Lincoln Vital Signs 2019 continues the tradition of providingcredible, reliable information about Lincoln, compared to its recent past and to other communities in the UnitedStates. Data from the report are used by organizations and individuals to inform decisions, spark connections,and spur collaboration. You can view the report, along with new interactive graphs, at lincolnvitalsigns.org.Lincoln Vital Signs presents data in chapters covering: Community Profile, Economy & Workforce, Basic Needs,Education, Health, and Safety & Security.In 2019, Lincoln Vital Signs finds:1. Lincoln is prospering and growing stronger.2. Persistent weaknesses stymie progress.The opportunities and challenges identified in past Lincoln Vital Signs reports led to the creation of ProsperLincoln (prosperlincoln.org), promoting collective impact action in: Early Childhood, Innovative Workforce,Affordable Housing, Strong Neighborhoods, and Civic Investments.Learn more at lincolnvitalsigns.org2019 Lincoln Vital Signs Report : Executive Summary1
About the ReportBe informed. Get Involved.Lincoln Vital Signs 2019 presents over 100 charts, graphs, and maps to illustrate trends in our community.When looked at holistically, the data suggest areas of improvement and continued challenges.The 2019 Lincoln Vital Signs Report Finds:1. Lincoln is prospering and growing stronger.Already strong, Lincoln is flourishing. Adults are educated and engaged in work. New and existingbusinesses are creating jobs. Buildings and civic spaces are appearing. Our streets are safe. Greaterproportions of our youth are from diverse backgrounds. Working together, Lincoln has bent thetrajectories of homelessness, need for crisis services, and lack of access to high quality childcare.2. Persistent weaknesses stymie progress.In a time of growth, not everyone is prospering. Most Lincoln families have not regained pre-GreatRecession income levels. Lincoln’s low cost of living does not offset our lower incomes. Personsfrom racial and ethnic minority populations struggle to achieve equity in educational attainment,employment, and income. We have unprecedented geographic concentrations of extreme povertyand poor health.Learn more at lincolnvitalsigns.org2019 Lincoln Vital Signs Report : Lincoln Vital Signs & Prosper Lincoln2
Prosper LincolnLincoln Vital Signs: Helping Lincoln ProsperLincoln Vital Signs helped Lincoln become aware of our opportunities and challenges and led to acommunity-wide agenda-setting process, Prosper Lincoln (prosperlincoln.org). Thousands of people wereinvolved in setting the 2017-2019 community agenda (Early Childhood, Employment Skills, and Innovation).The results of 2017-2019 have been impressive, including: hundreds of new high-quality early childhoodplacements; 600,000 raised to support access to early childhood programs for low-income families; localcompanies mobilizing to support access to high-quality early childhood care for young families; hundreds ofbusinesses connecting with public agencies to recruit employees; thousands of university and high schoolstudents connecting to internships and careers offered by local employers; and businesses implementingnew practices to remove barriers and recruit valued employees.From 2020-2024, Prosper Lincoln is deepening and broadening of the work with five areas of focus:1. Early Childhood - All children will have access to high quality early childhood care and educationleading to a more available workforce today and a smarter workforce tomorrow.2. Innovative Workplace - People will have careers and employers retain skilled talent in a culture ofinnovation to fuel economic success for businesses and lift workers out of poverty.3. Affordable Housing - All residents will live in affordable housing leading to healthier and more stable families.4. Strong Neighborhoods - Neighborhoods will thrive through investments in people and places creatingrobust and attractive places for residents to live.5. Civic Investment - Major new civic investments will create sustainable opportunities to work, live, andplay resulting in a stronger and more vibrant city.2019 Lincoln Vital Signs Report : Lincoln Vital Signs & Prosper Lincoln3
2019 Lincoln Vital Signs Report : Lincoln Vital Signs & Prosper Lincoln4
Community ProfileLincoln is a growing community. In the past decade, Lincoln’s overall population has grown by33,391 residents, or 13%. Since 2009, Lincoln’s growth rate of the retirement-age population hasoutpaced that of the working age and younger populations. Lincoln is becoming more racially andethnically diverse: Lincoln’s White non-Hispanic/Latinx population has dropped from comprising 85%of Lincoln’s overall population in 2009 to now comprising 79%. Compared to other cities across theUnited States, Lincoln is in the top third for overall well-being.2019 Lincoln Vital Signs Report : Community Profile5
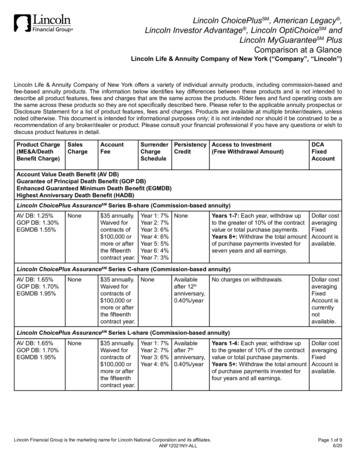
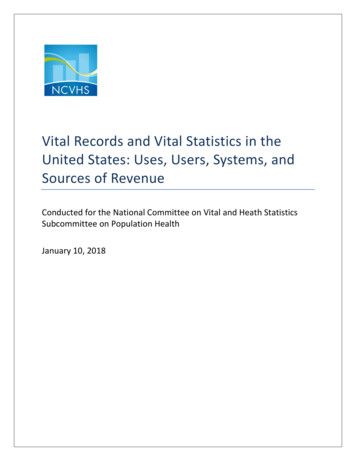
PopulationPopulation GrowthLincoln's population has grown 13% Since 2009Lincoln’s growth rate has been low for the past decadeFigure 1Figure 2Similar to other urbanized communities in Nebraska, Lincoln hasexperienced population growth over the past decade. Since 2009, Lincoln’s population has grown annually at a rate of 1%to 2% per year. Lincoln now has more than 287,000 residents;33,391 more since 2009. From 2006 to 2007, Lincoln’s growth rate was over 5% per year. Lincoln’s population has grown 13% since 2009.2019 Lincoln Vital Signs Report : Community Profile6
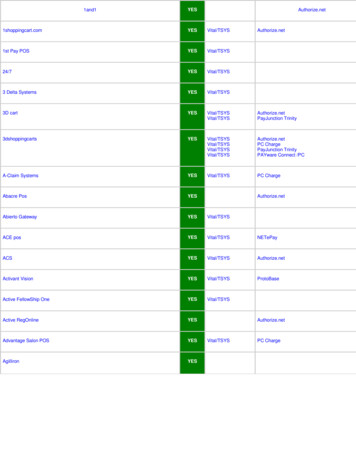
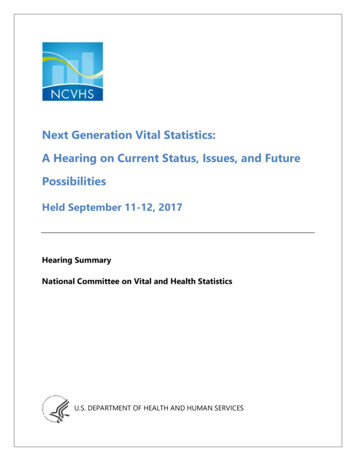
Population by Age GroupPopulation Growth by Age GroupLincoln’s 65 age group has grown the most since 2009Lincoln’s 65 age group is growing at a faster rate than otherage groupsFigure 3Table 1 The 65 years and over age group has added more persons than anyother age group in the past decade, with 11,156 more persons, since2009. Since 2009, the 65 years and over age group has shown the fastestrate of growth compared to other age groups (42% growth vs.around 10% growth for other age groups).2019 Lincoln Vital Signs Report : Community Profile7
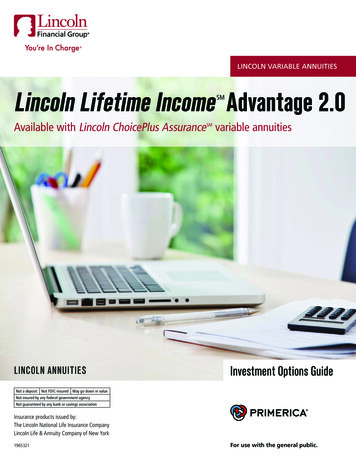
Birth & Death RatesLincoln NewcomersLincoln’s natural growth rate is higher than the U.S. overallLincoln’s growth is attributable to people moving to LincolnFigure 4Figure 5 Lincoln’s natural growth rate (birth rate minus death rate) addedless than 1% to Lincoln’s population in 2016 (the most recent yearavailable).Over the last decade, on average, almost 10% of Lincoln’s populationmoved to the city in the previous 12 months. In 2018, newcomers toLincoln had moved from: Lincoln has a higher growth rate than the U.S. as a whole. Other places in Nebraska (4.5%) Lincoln rate is 6.1 per 1,000 persons. U.S. rate is 3.7 per 1,000 persons. Other places in the United States outside Nebraska (4.7%) Other places in the world outside the United States (0.6%).2019 Lincoln Vital Signs Report : Community Profile8
Newcomer DemographicsNewcomer Educational AttainmentLincoln newcomers are young, White adults with higherrates of povertyNewcomers are as educated as the rest of Lincoln’s populationTable 2Figure 6For the past five years, on average, almost half (44%) of newcomers toLincoln have been young adults between 18 and 24 years of age. The educational attainment of newcomers to Lincoln in 2018 issimilar to the rest of Lincoln’s population. The influx of young people may be attributable to Lincoln’s multiplepost-secondary institutions. Approximately 70% of newcomers to Lincoln were White nonHispanic/Latinx. The proportion of White non-Hispanic/Latinx newcomers hasremained steady since 2011.Newcomers to Lincoln have twice the percentage of people livingbelow the poverty threshold (28%) than those who have lived inLincoln longer than one year (13%).12019 Lincoln Vital Signs Report : Community Profile9
Race/EthnicityRace/Ethnicity by AgeLincoln is becoming more diverseLincoln’s children/youth are more ethnically/racially diversethan the adult populationFigure 7Table 3 The majority (79%) of Lincoln’s population identifies as White nonHispanic/Latinx.Lincoln’s child/youth age group (younger than 18 years of age) ismore diverse than the adult population (18 years or older). The past decade has seen Lincoln steadily becoming a moreethnically and racially diverse community. Within the age group younger than 18 years of age, the White-alonepopulation comprised about two-thirds of the population in 2017(70%). From 2009 to 2018, Lincoln’s non-White population hasincreased 56% while the White-alone population has increased5%. In contrast, within the age group 18 years or older, the White-alonepopulation comprised more than four-fifths of the population (84%). Lincoln’s Hispanic/Latinx population has more than doubled(from 13,729 persons to 22,339 persons).2019 Lincoln Vital Signs Report : Community Profile10
Well-Being RankingsWell-Being ComponentsLincoln ranks in the top third of cities in the U.S. forwell-beingLincoln ranks in the top 15% of cities for financial well-being,and in the top 25% of cities for community well-beingFigure 8Figure 9The Gallup-Healthways Well-Being Index is based on phone surveysof people living in more than 180 Metropolitan Statistical Areas(MSAs).Beginning with the 2014-15 survey, well-being dimensions include:purpose, social, financial, community, and physical.2 Of the MSAs whose residents were surveyed as part of the 2016-17Gallup-Healthways Well-Being Index , the Lincoln MSA (consistingof Lancaster and Seward counties) was ranked 58th in overall wellbeing. In the past three years, Lincoln’s rankings have been similar toNebraska’s when adjusted for the number of places used in thecomparison (50 for states, 186 for communities in 2017).2019 Lincoln Vital Signs Report : Community Profile Lincoln ranks well on the financial well-being (rank 25) andcommunity well-being (rank 45). Lincoln falls just outside of the top third of rankings on purpose wellbeing (rank 64). Lincoln has previously ranked poorly on physical well-being (rank 103), but is improving. Lincoln has ranked poorly on the social well-being (rank 154) overthe past two years.11
Community Profile Notes1. In 2018, the poverty threshold was 25,465 for a family of four that included two related children less than 18years of age.2. The specific dimensions on which communities and states are ranked changed with the 2014-15 survey. Thereare no community-level data for Lincoln in 2014. For more information about the Gallup-Healthways Well-BeingIndex , go to http://www.well-beingindex.com/about2019 Lincoln Vital Signs Report : Community Profile12
Economy and WorkforceLincoln has an active and educated workforce: high rates of workforce participation, lowunemployment, over half of adults with post-secondary degrees, and high marks for quality fromlocal businesses. However, most Lincoln households have not regained pre-Great Recessionincomes, even when adjusting for inflation, though Lincoln’s most affluent households are thriving.Declining or stagnant measures for entrepreneurship and STEM jobs signal signs of weakness inLincoln’s economy. The high percentage of children with all parents in the workforce signals the needfor high quality childcare, but costs may consume a significant proportion of a household income.2019 Lincoln Vital Signs Report : Economy and Workforce13
UnemploymentMultiple JobholdersLincoln’s unemployment rate continues to be lowNebraska has a high rate of multiple jobholdersFigure 10Figure 11 Lincoln’s unemployment rate continues to be lower than the U.S. rate.The most recent multiple jobholder data for Nebraska is 2016.Statewide data are the smallest geographic data available. Lincoln’s current unemployment rate is the lowest it has been in 15years. The rate of multiple jobholders in Nebraska has averaged nearly9% over the past decade, and has been significantly higher than thenational average of 5% since 2009. The rate of multiple jobholders in Nebraska peaked in 2006 at 9.9%,decreasing to 8.9% in 2016.2019 Lincoln Vital Signs Report : Economy and Workforce14
Workforce ParticipationParents in WorkforceWorkforce participation in Lincoln is highMost parents workFigure 12Figure 13 In Lincoln, a higher percentage of persons over the age of 16participate in the workforce than is the average nationally, exceedingthe national rate by at least 7% over the past decade. In Lincoln, 75% of children under 6 years of age have all parentsin the workforce; for children from 6 through 17 years of age, thepercentage is nearly 82%. In 2018, Lincoln’s workforce participation was 72%, while thenational rate was 63%. All parents in the workforce is defined as two-parent families,both of whom work, and one-parent families with that parentworking. Lincoln has a much higher percentage of families with all parents inthe workforce than the national average. Nebraska, along with other upper Great Plains states, regularly ranksas one of the top states for percentage of children with all parents inthe workforce.2019 Lincoln Vital Signs Report : Economy and Workforce15
Workforce Participation by Race/EthnicityUnemployment by Race/EthnicityThose identifying as Hispanic/Latinx and Black/AfricanAmerican have the highest workforce participation ratesThose identifying as Blacks/African-American and Hispanic/Latinx have the highest rates of unemploymentFigure 14Figure 15The workforce participation rate is the percentage of people in theworking age population (those 16 years or older) who are eitheremployed or actively seeking employment.The unemployment rate is the percentage of people in the workforcewho are not employed, and are actively seeking employment. Workforce participation rates vary by race and ethnicity. Hispanics/Latinx have the highest workforce participation rates,followed by Blacks/African Americans.2019 Lincoln Vital Signs Report : Economy and Workforce Unemployment rates vary by race and ethnicity. Blacks/African-Americans have a rate of unemployment that is threetimes that of Lincoln as a whole.16
Childcare CostsChildcare Infant CostChildcare costs continue to increaseChildcare costs are a significant percentage of income forfamiliesFigure 16Figure 17The cost of childcare is often a significant proportion of workingparents’ income and, in some cases, may be a barrier to participationin the workforce.In 2017, the annual cost of childcare for an infant was: 11% of the median family income of a typical married couple. In 2019, the annual cost of care for an infant in a childcare centerwas more than resident tuition and fees at the University ofNebraska-Lincoln.Childcare workers have low wages. In 2018, the average annualincome of a childcare worker in Lincoln was 23,880.¹2019 Lincoln Vital Signs Report : Economy and Workforce 35% of the median income of a typical single mother.17
Cost of LivingPer Capita IncomeLincoln’s living costs are lower than in the U.S. as a whole,as is per capita incomeLincoln’s low cost of living does not fully compensate forworkers’ lower per capita incomesFigure 18Figure 19 Living in Lincoln costs less, on average, than does living in otherparts of the United States.Adjusting per capita income by cost of living provides an indicatorof relative buying power and recognizes that a dollar of income inLincoln has more buying power than a dollar of income in other areasof the U.S. Lincoln’s per capita income is less, on average, than the U.S. as awhole. Over the past five years, Lincoln’s per capita income has stayedabout the same as cost of living has risen.2019 Lincoln Vital Signs Report : Economy and Workforce Since 2011, adjusting for Lincoln’s low cost of living has not madeup for Lincoln’s low per capita income. In 2018, Lincoln trailed the national average per capita income by 3,682.18
Household IncomeMedian vs. Mean Household IncomeMost Lincoln household incomes have not regainedpre-Great Recession levelsThe gap between low income and high income earners hasbeen steady over the past decadeFigure 20Figure 21Most demographers use median income as the preferred measure ofaverage household income, rather than the mean. This is because veryhigh incomes skew the mean, inflating what the income is for mosthouseholds. The gap between the mean and the median income has hoveredaround 25%–36% of the median income. Lincoln’s median household income, even when adjusted to 2018dollars, has not recovered from 2008 and the Great Recession. Lincoln’s mean household income, when adjusted to 2018 dollars,now exceeds that from pre-2008.2019 Lincoln Vital Signs Report : Economy and Workforce19
Workforce Status & PovertyEmployment Status & PovertyMost persons who fall below the poverty threshold are inthe workforceMost adults in poverty in the workforce are employedFigure 22Figure 23 The majority (54%) of adults in poverty are in the workforce. The vast majority (87%) of persons in poverty in the workforce areemployed.2019 Lincoln Vital Signs Report : Economy and Workforce20
Work Type & PovertyMean Hours & PovertyMost adults in poverty worked part-time or part-yearMean hours worked and poverty rates have not returned topre-Great Recession levelsFigure 24Figure 25 Over half (51%) of adults in poverty worked part-time or partyear, suggesting that underemployment, job losses, or barriers toemployment contribute to poverty. Average number of hours worked has not regained pre-GreatRecession highs. Only 9% of adults in poverty worked full-time, year-round. Average hours worked and poverty rate are negatively correlated,meaning that when mean hours worked is lower, poverty is higher.2019 Lincoln Vital Signs Report : Economy and Workforce The rate of poverty exceeds pre-Great Recessions lows.21
Educational AttainmentHigh School DiplomaLincoln is becoming an even more highly educatedpopulationLincoln has a high percentage of adults with a high schooldiploma or higherFigure 26Figure 27 Over half of adults in Lincoln (53%) have a post-secondary degree(an increase of 13% from 2009). Lincoln has a higher percentage of adults with a high schooldiploma or higher (93.8%) than does Nebraska (91.4%) or the US.(88.3%). 11% have an associate’s degree 26% have a bachelor’s degree 15% have a graduate or professional degree2019 Lincoln Vital Signs Report : Economy and Workforce Lincoln’s percentage of adults who have a high school diploma orhigher has been steady over the past 14 years.22
Graduate/Professional DegreeUnemployment Rate by EducationLincoln has a high percentage of adults with a graduate orprofessional degreeUnemployment is low across the educational attainmentspectrumFigure 28Figure 29 Lincoln has a higher percentage of adults with a graduate orprofessional degree (15%) than Nebraska (11%) or the U.S. (12%). Persons with bachelor’s degrees or higher have the lowestunemployment rate among educational attainment categories. It is notable, that in 2018, persons who are high school graduateshave a higher unemployment rate than those with less than a highschool diploma.2019 Lincoln Vital Signs Report : Economy and Workforce23
Median Earnings by EducationProjected Employment GrowthAdults with higher education earn more incomeNationally, jobs requiring a master’s degree are growing indemand from 2018-2028Figure 30Figure 31 In general, adults with higher educational attainment have higherearnings. It is difficult to know exactly what skills Lincoln residents will needto meet the demands of the future. It is notable that, in 2018, persons with less than a high schooldiploma had higher earnings than those with only a high schooldiploma. Nationally, jobs requiring a master’s degree are expected to grow thefastest.2019 Lincoln Vital Signs Report : Economy and Workforce24
Quality of WorkforceAvailability of Skilled WorkforceEmployers give Lincoln’s workforce high ratingsEmployers give the availability of skilled workers low ratingsFigure 32Figure 33 Lincoln’s workforce receives high ratings for quality from local areabusinesses. Lincoln businesses report some difficulty finding qualifiedapplicants to fill the jobs they have available. The majority of businesses (73%) rated the quality of Lincoln’sworkforce as Above Average or higher. The majority of businesses (54%) rated the availability of skilledworkforce as Below Average or lower.2019 Lincoln Vital Signs Report : Economy and Workforce25
Employment by SectorNet Job CreationMost persons work in private companiesNet job creation has increased over the past decadeTable 4Figure 34 In Lincoln in 2018, civilian workers were employed by the followingtype of employer: Net job change was negative in 2009 during the Great Recession,but recovered in the years following. 76% were private wage and salary workers 18% were federal, state, or local government workers 6% were self-employed in their own (not incorporated) business2019 Lincoln Vital Signs Report : Economy and Workforce Net job change peaked in 2013 and has decreased slightly andstabilized from 2014-2017.26
Jobs Created by New BusinessesEstablishment Entry RateNew businesses (0-5 years old) are creating jobsThe establishment entry rate of new businesses has beenmostly level for the past four yearsFigure 35Figure 36 There has been a 24% increase in the number of jobs created by newbusinesses (aged 0-5 years) from 2008 to 2017.The establishment of new businesses (as a percentage of existingbusinesses) is a measure of business growth. Job creation by new businesses has risen slowly, but steadily, sincethe Great Recession, with a spike in 2016. The establishment business rate dipped during the years followingthe Great Recession, but recovered and peaked in 2012 (10.3%). The establishment business rate has remained level, with a slightuptick in the most recent year data are available (2016).2019 Lincoln Vital Signs Report : Economy and Workforce27
PatentsSTEM OccupationsInnovation has been increasing since 2011Lincoln’s percentage of STEM occupations is reboundingFigure 37Figure 38Patent filing is a reasonable proxy for innovation in a community.²There is a general consensus that the United States’ long-term globalcompetitiveness will partially hinge on the supply and quality ofworkers in science, technology, engineering, and mathematics (STEM)fields.³ STEM careers are important to communities because theyoffer high wage jobs that will result in reinvestments back into localeconomies.4 In the Lincoln Metropolitan Statistical Area (MSA: Lancaster andSeward Counties), STEM occupations had decreased during andafter the recession, but have rebounded since 2010. The first decade of the 21st century was fairly flat, but the number ofpatents in the last several years has increased. In Lincoln, 6.0% of all occupations are classified as STEM. This is slightly higher than the national percentage of 5.6% of alloccupations in STEM.2019 Lincoln Vital Signs Report : Economy and Workforce28
Commercial & Residential ConstructionConstruction has grown in the past decadeFigure 39 Lincoln continues to invest in new commercial buildings andresidences. The value of commercial building and residential permits have beenon a general upward trend since 2009.2019 Lincoln Vital Signs Report : Economy and Workforce29
Economy and Workforce Notes1. U.S. Bureau of Labor Statistics, Occupational Employment and Wage Estimates, 2018.2. Acs, Z. J., Anselin, L., & Varga, A. (2002). Patents and innovation counts as measures of regional production ofnew knowledge. Research Policy, 31, 1069-1085.3. Committee on Prospering in the Global Economy of the 21st Century. (2007). Rising above the gathering storm:Energizing and employing America for a brighter economic future. Washington, DC: National Academies Press.4. Rothwell, J. (2013). The hidden STEM economy. Metropolitan Policy Program. Washington, DC: BrookingsInstitute.2019 Lincoln Vital Signs Report : Economy and Workforce30
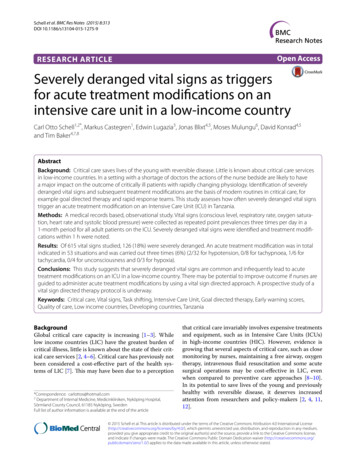
Basic NeedsLincoln’s poverty rate has dropped to 14%, and roughly tracks the overall poverty trends of the nation.Over 38% of public school students currently receive free lunch. The number of households receivingSupplemental Nutrition Assistance Program (SNAP; formerly known as food stamps) has been stablesince the Great Recession, averaging 9%. Lincoln has seven neighborhoods in extreme poverty (morethan 40% of residents in poverty). Other trends have been going in a more positive direction: the numberof homeless in Lincoln has dropped to its lowest levels in the past 10 years, and rates of food insecurehouseholds and individuals without health insurance have gradually decreased.2019 Lincoln Vital Signs Report : Basic Needs31
Poverty RatePopulation Change by Poverty LevelLincoln’s number of persons in poverty has decreased 11%in the past decadeLincoln has experienced an increase in the population inpoverty after several years of decreasesFigure 40Figure 41The federal poverty level is determined annually based on size of thefamily, the number of children, and a measure of income needed topurchase food and other essential goods and services.1 In 2018, forexample, the poverty threshold was 25,465 for a family of four thatincluded two related children less than 19 years of age. In 2018, there was an increase in Lincoln’s population living inpoverty of 10% from the previous year. This increase represented3,450 more
Similar to other urbanized communities in Nebraska, Lincoln has experienced population growth over the past decade. Lincoln now has more than 287,000 residents; 33,391 more since 2009. Lincoln's population has grown 13% since 2009. Since 2009, Lincoln's population has grown annually at a rate of 1% to 2% per year.