Transcription
Calc Guide3ChapterCreating Charts andGraphsPresenting information visuallyThis PDF is designed to be read onscreen, two pages at atime. If you want to print a copy, your PDF viewer shouldhave an option for printing two pages on one sheet ofpaper, but you may need to start with page 2 to get it toprint facing pages correctly. (Print this cover pageseparately.)
CopyrightThis document is Copyright 2010 by its contributors as listed in thesection titled Authors. You may distribute it and/or modify it under theterms of either the GNU General Public License, version 3 or later, orthe Creative Commons Attribution License, version 3.0 or later.All trademarks within this guide belong to their legitimate owners.AuthorsRichard BarnesJohn KanePeter KupferShelagh MantonAlexandre MartinsAnthony PetrilloSowbhagya SundaresanJean Hollis WeberLinda WorthingtonFeedbackPlease direct any comments or suggestions about this document entsShelagh Manton and Jean Hollis Weber updated the OOo2.x chapterwritten by the other authors to 3.x.Publication date and software versionPublished 21 June 2010. Based on OpenOffice.org 3.2.You can downloadan editable version of this document shed/
ContentsCopyright. 2Introduction. 5Creating a chart. 5Choosing a chart type.7Changing data ranges and axes labels.8Selecting data series. 9Adding or changing titles, legend, and grids.10Editing charts. 10Changing the chart type.11Adding or removing chart elements.11Data labels. 12Trend lines. 14Mean value lines.15Y error bars. 15Formatting charts.16Moving chart elements.18Changing the chart area background.18Changing the chart graphic background.19Changing colors. 19Formatting 3D charts. 19Rotation and perspective.20Appearance. 21Illumination. 21Rotating 3D charts interactively.22Formatting the chart elements.23Formatting axes and inserting grids.23Formating data labels.24Choosing and formatting symbols.24Resizing and moving the chart.25Using the Position and Size dialog.26Gallery of chart types.27Creating Charts and Graphs3
Column charts. 27Bar charts. 27Pie charts. 28Area charts.29Line charts. 31Scatter or XY charts. 31Bubble charts. 32Net charts. 33Stock charts. 34Column and line charts.354Creating Charts and Graphs
IntroductionCharts and graphs can be powerful ways to convey information to thereader. OpenOffice.org Calc offers a variety of different chart andgraph formats for your data.Using Calc, you can customize charts and graphs to a considerableextent. Many of these options enable you to present your informationin the best and clearest manner.For readers who are interested in effective ways to present informationgraphically, two excellent introductions to the topic are William S.Cleveland’s The elements of graphing data, 2nd edition, Hobart Press(1994) and Edward R. Tufte’s The Visual Display of QuantitativeInformation, 2nd edition, Graphics Press (2001).Creating a chartTo demonstrate the process of making charts and graphs in Calc, wewill use the small table of data in Figure 1.Figure 1: Table of data for charting examplesTo create a chart, first highlight (select) the data to be included in thechart. The selection does not need to be in a single block, as shown inFigure 2; you can also choose individual cells or groups of cells(columns or rows). See Chapter 1 (Introducing Calc) for more aboutselecting cells and ranges of cells.Creating a chart5
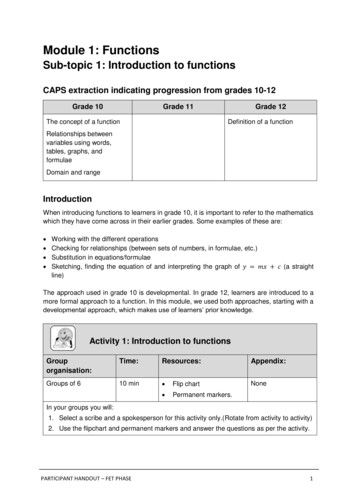
Figure 2: Selecting data for plottingNext, open the Chart Wizard dialog using one of two methods. Choose Insert Chart from the menu bar. Or, click the Chart icon on the main toolbar.Figure 3: Insert chart from main toolbarEither method inserts a sample chart on the worksheet, opens theFormatting toolbar, and opens the Chart Wizard, as shown in Figure 4.Tip6Before choosing the Chart Wizard, place the cursor anywhere inthe area of the data. The Chart Wizard will then do a fairly goodjob of guessing the range of the data. Just be careful that youhave not included the title of your chart.Creating Charts and Graphs
Figure 4: Chart Wizard, Step 1—Choose a chart typeChoosing a chart typeThe Chart Wizard includes a sample chart with your data. This samplechart updates to reflect the changes you make in the Chart Wizard.The Chart Wizard has three main parts: a list of steps involved insetting up the chart, a list of chart types, and the options for eachchart type. At any time you can go back to a previous step and changeselections.Calc offers a choice of 10 basic chart types, with a few options for eachtype of chart. The options vary according to the type of chart you pick.The first tier of choice is for two-dimensional (2D) charts. Only thosetypes which are suitable for 3D (Column, Bar, Pie, and Area) give youan option to select a 3D look.On the Choose a chart type page (Figure 4), select a type by clickingon its icon. The preview updates every time you select a different typeof chart, and provides a good idea of what the finished chart will looklike.The current selection is highlighted (shown with a surrounding box) onthe Choose a chart type page. The chart’s name is shown just belowCreating a chart7
the icons. For the moment, we will stick to the Column chart and clickon Next again.Changing data ranges and axes labelsIn Step 2, Data Range, you can manually correct any mistakes youhave made in selecting the data.On this page you can also change the way you are plotting the data byusing the rows—rather than the columns—as data series. This is usefulif you use a style of chart such as Donut or Pie to display your data.Lastly, you can choose whether to use the first row or first column, orboth, as labels on the axes of the chart.You can confirm what you have done so far by clicking the Finishbutton, or click Next to change some more details of the chart.We will click Next to see what we can do to our chart using the otherpages of the Wizard.Figure 5: Changing data ranges and axes labels8Creating Charts and Graphs
Selecting data seriesFigure 6: Amending data series and rangesOn the Data Series page, you can fine tune the data that you want toinclude in the chart. Perhaps you have decided that you do not want toinclude the data for canoes. If so, highlight Canoes in the Data seriesbox and click on Remove. Each named data series has its ranges andits individual Y-values listed. This is useful if you have very specificrequirements for data in your chart, as you can include or leave outthese ranges.TipYou can click the Shrink buttonnext to the Range for Namebox to work on the spreadsheet itself. This is handy if your dataranges are larger than ours and the Chart Wizard is in the way.Another way to plot any unconnected columns of data is to select thefirst data series and then select the next series while holding down theCtrl key. Or you can type the columns in the text boxes. The columnsmust be separated by semi-colons. Thus, to plot B3:B11 againstG3:G11, type the selection range as B3:B11;G3:G11.The two data series you are selecting must be in separate columns orrows. Otherwise Calc will assume that you are adding to the same dataseries.Click Next to deal with titles, legend and grids.Creating a chart9
Adding or changing titles, legend, and gridsFigure 7: Titles, legend and gridsOn the Chart Elements page, you can give your chart a title and, ifdesired, a subtitle. Use a title that draws the viewers’ attention to thepurpose of the chart: what you want them to see. For example, a bettertitle for this chart might be The Performance of Motor and OtherRental Boats.It may be of benefit to have labels for the x axis or the y axis. This iswhere you give viewers an idea as to the proportion of your data. Forexample, if we put Thousands in the y axis label of our graph, itchanges the scope of the chart entirely. For ease of estimating data youcan also display the x or y axis grids by selecting the Display gridsoptions.You can leave out the legend or include it and place it to the left, right,top or bottom.To confirm your selections and complete the chart, click Finish.Editing chartsAfter you have created a chart, you may find things you would like tochange. Calc provides tools for changing the chart type, chartelements, data ranges, fonts, colors, and many other options, throughthe Insert and Format menus, the right-click (context) menu, and theChart toolbar.10Creating Charts and Graphs
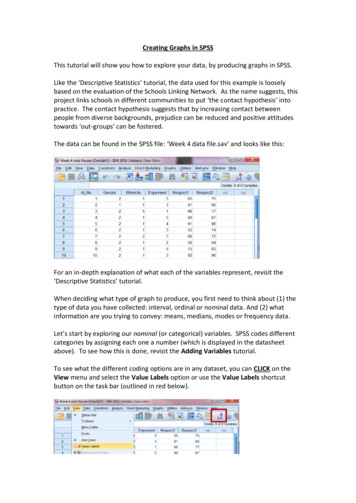
Changing the chart typeYou can change the chart type at any time. To do so:1) First select the chart by double-clicking on it. The chart shouldnow be surrounded by a gray border.2) Then do one of the following: Choose Format Chart Type from the menu bar. Click the chart type iconon the Formatting toolbar. Right-click on the chart and choose Chart Type.In each case, a dialog similar to the one in Figure 4 opens. See page 7for more information.Adding or removing chart elementsFigures 8 and 9 show the elements of 2D and 3D charts.The default 2D chart includes only two of those elements: Chart wall contains the graphic of the chart displaying the data. Chart area is the area surrounding the chart graphic. The(optional) chart title and the legend (key) are in the chart area.The default 3D chart also has the chart floor, which is not available in2D charts.Chart titleChart wallLegendChart areaAxis labelsFigure 8: Elements of 2D chartEditing charts11
Chart floorFigure 9: Elements of 3D chartYou can add other elements using the commands on the Insert menu.The various choices open dialogs in which you can specify details.First select the chart so the green sizing handles are visible. This isdone with a single click on the chart.The dialogs for Titles, Legend, Axes, and Grids are self-explanatory.The others are a bit more complicated, so we’ll take a look at themhere.Data labelsData labels put information about each data point on the chart. Theycan be very useful for presenting detailed information, but you need tobe careful to not create a chart that is too cluttered to read.Choose Insert Data Labels. The options are as follows.Show value as numberDisplays the numeric values of the data points. When selected, thisoption activates the Number format. button.Number format.Opens the Number Format dialog, where you can select the numberformat. This dialog is very similar to the one for formatting numbersin cells, described in Chapter 2 (Entering, Editing, and FormattingData).12Creating Charts and Graphs
Figure 10: Data Labels dialogShow value as percentageDisplays the percentage value of the data points in each column.When selected, this option activates the Percentage format.button.Percentage format.Opens the Number Format dialog, where you can select thepercentage format.Show categoryShows the data point text labels.Show legend keyDisplays the legend icons next to each data point label.SeparatorSelects the separator between multiple text strings for the sameobject.PlacementSelects the placement of data labels relative to the objects.Figure 22 on page 28 shows examples of values as text (neither Showvalue as number nor Show value as percentage selected) and values aspercentages, as well as when data values are used as substitutes forlegends or in conjunction with them.Editing charts13
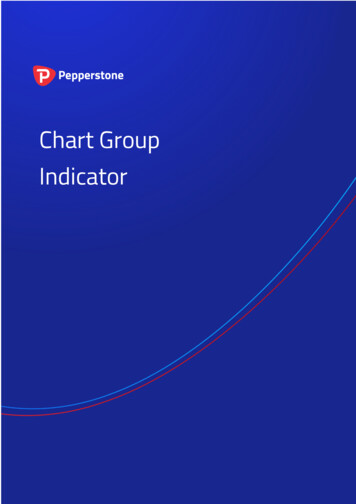
Trend linesWhen you have a scattered grouping of points in a graph, you maywant to show the relationship of the points. A trend line is what youneed. Calc has a good selection of regression types you can use fortrend lines: linear, logarithm, exponential, and power. Choose the typethat comes closest to passing through all of the points.To insert trend lines for all data series, double-click the chart to enteredit mode. Choose Insert Trend Lines, then select the type of trendline from None, Linear, Logarithmic, Exponential, or Power. You canalso choose whether to show the equation for the trend line and thecoefficient of determination (R2).To insert a trend line for a single data series, first select the data seriesin the chart, and then right-click and choose Insert Trend Linefrom the context menu. The dialog for a single trend line is similar tothe one below but has a second tab (Line), where you can chooseattributes (style, color, width, and transparency) of the line.To delete a single trend line or mean value line, click the line, thenpress the Del key.To delete all trend lines, choose Insert Trend Lines, then selectNone.A trend line is shown in the legend automatically.Figure 11: Trend Lines dialog14Creating Charts and Graphs
If you insert a trend line on a chart type that uses categories, such asLine or Column, then the numbers 1, 2, 3, are used as x-values tocalculate the trend line.The trend line has the same color as the corresponding data series. Tochange the line properties, select the trend line and choose FormatTrend Line. This opens the Line tab of the Trend Lines dialog.To show the trend line equation, select the trend line in the chart,right-click to open the context menu, and choose Insert Trend LineEquation.When the chart is in edit mode, OpenOffice.org gives you the equationof the trend line and the correlation coefficient. Click on the trend lineto see the information in the status bar. To show the equation and thecorrelation coefficient, select the line and choose Insert R2 andTrend Line Equation.For more details on the regression equations, see the topic Trend linesin charts in the Help.Mean value linesIf you select mean value lines, Calc calculates the average of eachselected data series and places a colored line at the correct level in thechart.Y error barsIf you are presenting data that has a known possibility of error, such associal surveys using a particular sampling method, or you want to showthe measuring accuracy of the tool you used, you may wish to showerror bars on the chart. Select the chart and choose Insert Y ErrorBars.Several options are provided on the Y Error Bars dialog (Figure 12).You can only choose one option at a time. You can also choose whetherthe error indicator shows both positive and negative errors, or onlypositive or only negative. Constant value – you can have separate positive and negativevalues. Percentage – choose the error as a percentage of the data points. In the drop-down list:– Standard error– Variance – shows error calculated on the size of the biggest andsmallest data pointsEditing charts15
Standard deviation – shows error calculated on standarddeviation– Error margin – you designate the error Cell range – calculates the error based on cell ranges you select.The Parameters section at the bottom of the dialog changes toallow selection of the cell ranges.–Figure 12: Specifying the parameters of error barsFormatting chartsThe Format menu has many options for formatting and fine-tuning theappearance of your charts.Double-click the chart so that it is enclosed by a gray border indicatingedit mode; then, select the chart element that you want to format.Choose Format from the menu bar, or right-click to display a pop-up(context) menu relevant to the selected element. The formattingchoices are as follows.Format SelectionOpens a dialog in which you can specify the area fill, borders,transparency, characters, font effects, and other attributes of theselected element of the chart (see page 23).Position and SizeOpens a dialog (see page 26).16Creating Charts and Graphs
ArrangementProvides two choices: Bring Forward and Send Backward, ofwhich only one may be active for some items. Use these choices toarrange overlapping data series.TitleFormats the titles of the chart and its axes.LegendFormats the location, borders, background, and type of the legend.AxisFormats the lines that create the chart as well as the font of the textthat appears on both the X and Y axes.GridFormats the lines that create a grid for the chart.Chart Wall, Chart Floor, Chart AreaDescribed in the following sections.Chart TypeChanges what kind of chart is displayed and whether it is two- orthree-dimensional.Data RangesExplained on page 8 (Figure 5 and Figure 6).3D ViewFormats 3D charts (see page 19).NoteChart Floor and 3D View are only available for a 3D chart.These options are unavailable (grayed out) if a 2D chart isselected.In most cases you need to select the exact element you want to format.Sometimes this can be tricky to do with the mouse, if the chart hasmany elements, especially if some of them are small or overlapping. Ifyou have Tooltips turned on (in Tools Options OpenOffice.org General Help, select Tips), then as you move the mouse over eachelement, its name appears in the Tooltip. Once you have selected oneelement, you can press Tab to move through the other elements untilyou find the one you want. The name of the selected element appearsin the Status Bar.Formatting charts17
Moving chart elementsYou may wish to move or resize individual elements of a chart,independent of other chart elements. For example, you may wish tomove the legend to a different place. Pie charts allow moving ofindividual wedges of the pie (in addition to the choice of “exploding”the entire pie).1) Double-click the chart so that it is enclosed by a gray border.2) Double-click any of the elements—the title, the legend, or thechart graphic. Click and drag to move the element. If the elementis already selected, then move the pointer over the element to getthe move icon (small hand), then click, drag and move theelement.3) Release the mouse button when the element is in the desiredposition.NoteIf your graphic is 3D, round red handles appear which controlthe three-dimensional angle of the graphic. You cannot resize orreposition the graphic while the round red handles are showing.With the round red handles showing, Shift Click to get thegreen resizing handles. You can now resize and reposition your3D chart graphic. See the following tip.TipYou can resize the chart graphic using its green resizing handles(Shift Click, then drag a corner handle to maintain theproportions). However, you cannot resize the title or the key.Changing the chart area backgroundThe chart area is the area surrounding the chart graphic, including the(optional) main title and key.1) Double-click the chart so that it is enclosed by a gray border.2) Choose Format Chart Area.3) On the Chart Area dialog (Figure 13), choose the desired formatsettings.On the Area tab, you can change the color, or choose a hatch pattern,bitmap or some preset gradients. Click on the drop-down box to seethe options. Patterns are probably more useful than color if you have toprint out your chart in black and white.You can also use the Transparency tab to change the area’stransparency. If you used a preset gradient from the Area tab, you cansee the different parameters of which it is composed.18Creating Charts and Graphs
Figure 13: Chart Area dialogChanging the chart graphic backgroundThe chart wall is the area that contains the chart graphic.1) Double-click the chart so that it is enclosed by a gray border.2) Choose Format Chart Wall. The Chart Wall dialog has thesame formatting options as described in “Changing the chart areabackground” above.3) Choose your settings and click OK.Changing colorsIf you need a different color scheme from the default for the charts inall your documents, go to Tools Options Charts DefaultColors, which has a much wider range of colors to choose from.Changes made in this dialog affect the default chart colors for anychart you make in future.Formatting 3D chartsUse Format 3D View to fine tune 3D charts. The 3D View dialog hasthree pages, where you can change the perspective of the chart,whether the chart uses the simple or realistic schemes, or your owncustom scheme, and the illumination which controls where theshadows will fall.Formatting 3D charts19
Rotation and perspectiveTo rotate a 3D chart or view it in perspective, enter the required valueson the Perspective page of the 3D View dialog. You can also rotate 3Dcharts interactively; see page 22.Figure 14: Rotating a chartSome hints for using the Perspective page: Set all angles to 0 for a front view of the chart. Pie charts and 20donut charts are shown as circles.With Right-angled axes enabled, you can rotate the chart contentsonly in the X and Y direction; that is, parallel to the chart borders.An x value of 90, with y and z set to 0, provides a view from thetop of the chart. With x set to –90, the view is from the bottom ofthe chart.The rotations are applied in the following order: x first, then y,and z last.When shading is enabled and you rotate a chart, the lights arerotated as if they are fixed to the chart.The rotation axes always relate to the page, not to the chart’saxes. This is different from some other chart programs.Select the Perspective option to view the chart in centralperspective as through a camera lens instead of using a parallelprojection.Set the focus length with the spin button or type a number in thebox. 100% gives a perspective view where a far edge in the chartlooks approximately half as big as a near edge.Creating Charts and Graphs
AppearanceUse the Appearance page to modify some aspects of a 3D chart’sappearance.Figure 15: Modifying appearance of 3D chartSelect a scheme from the list box. When you select a scheme, theoptions and the light sources are set accordingly. If you select ordeselect a combination of options that is not given by the Realistic orSimple schemes, you create a Custom scheme.Select Shading to use the Gouraud method for rendering the surface.Otherwise, a flat method is used. The flat method sets a single colorand brightness for each polygon. The edges are visible, soft gradientsand spot lights are not possible. The Gouraud method applies gradientsfor a smoother, more realistic look. Refer to the Draw Guide for moredetails on shading.Select Object Borders to draw lines along the edges.Select Rounded Edges to smooth the edges of box shapes. In somecases this option is not available.IlluminationUse the Illumination page (Figure 16) to set the light sources for the3D view. Refer to the Draw Guide for more details on setting theillumination.Click any of the eight buttons to switch a directed light source on oroff. By default, the second light source is switched on. It is the first ofFormatting 3D charts21
seven normal, uniform light sources. The first light source projects aspecular light with highlights.For the selected light source, you can then choose a color and intensityin the list just below the eight buttons. The brightness values of alllights are added, so use dark colors when you enable multiple lights.Figure 16: Setting the illuminationEach light source always points at the middle of the object initially. Tochange the position of the light source, use the small preview insidethis page. It has two sliders to set the vertical and horizontal positionof the selected light source.The button in the corner of the small preview switches the internalillumination model between a sphere and a cube.Use the Ambient light list to define the ambient light which shines witha uniform intensity from all directions.Rotating 3D charts interactivelyIn addition to using the Perspective page of the 3D View dialog torotate 3D charts, you can also rotate them interactively.Select the Chart Wall, then hover the mouse pointer over a cornerhandle or the rotation symbol found somewhere on the chart. Thecursor changes to a rotation icon.Press and hold the left mouse button and drag the corner in thedirection you wish. A dashed outline of the chart is visible while youdrag, to help you see how the result will look.22Creating Charts and Graphs
Formatting the chart elementsDepending on the purpose of your document, for example a screenpresentation or a printed document for a black and white publication,you might wish to use more detailed control over the different chartelements to give you what you need.To format an element, left-click on the element that you wish tochange, for example one of the axes. The element will be highlightedwith green squares. Then, right-click and choose an item from thecontext menu. Each chart element has its own selection of items. In thenext few sections we explore some of the options.Formatting axes and inserting gridsSometimes you need to have a special scale for one of the axes of yourchart, or you need smaller grid intervals, or you want to change theformating of the labels on the axis. After highlighting the axis you wishto change, right-click and choose one of the items from the pop-upmenu.Choosing Format Axis opens the dialog shown in (Figure 17). On theScale tab, you can choose a logarithmic or linear scale (default), howmany marks you need on the line, where the marks are to appear, andthe increments (intervals) of the scale. You must first deselect theAutomatic option in order to modify the value for any scale.On the Label tab (Figure 18), you can choose whether to show or hidethe labels and how to handle them when they won’t all fit neatly intoone row (for example, if the words are too long).Not shown here are the tab with options for choosing a font,formatting the lines, and positioning the elements of the line andinterval marks.Figure 17: Formatting axis scalesFormatting the chart elements23
Figure 18: Formatting axis labelsFormating data labelsYou can choose properties for the labels of the data series. Carefullyclick on the chart element, then right-click and choose the propertyyou want to change. This opens a dialog with several tabs where youcan change the color of the label text, the size of the font, and otherattributes. The Label tab is shown in Figure 18.On the Data Labels tab, you can choose whether to: Show the labels as text Show numeric values as a percentage or a number Include the legend box as part of the labelThese choices are the same as those shown in Figure 10 on page 13.The text for labels is taken from the column labels and it cannot bechanged here. If the text needs to be abbreviated, or if it did not labelyour graph as you were expecting, you need to change it in the originaldata table.Choosing and formatting symbolsIn line and scatter charts the symbols representing the points can bechanged to a different symbol shape or color through the objectproperties dialog. Select the data series you wish to change, rightclick, and choose Format Data Series from the context menu.On the Line tab of the Data Series dialog, in the Icon section, choosefrom the drop-down list Select Symbols. Here you can choose nosymbol, a symbol from an inbuilt selection, a more exciting range from24Creating Charts and Graphs
the gallery, or if you have pictures you need to use instead, you caninsert them using Select From file.Figure 19: Symbol selectionResizing and moving the chartYou can resize or move all elements of a chart at the same time, in twoways: interactively, or by using the Position and Size dialog. You maywish to use a combin
Figure 3: Insert chart from main toolbar Either method inserts a sample chart on the worksheet, opens the Formatting toolbar, and opens the Chart Wizard, as shown in Figure 4. Tip Before choosing the Chart Wizard, place the cursor anywhere in the area of the data. The Chart Wizard will the