Transcription
OVERVIEW OF THEPOWER SECTORPrachee MishraSeptember 2019Country has surplusgeneration capacity butdeficits continue in someregionsCapacity utilisation of thermalplants has declinedDiscoms are in poor financialhealth and have weak capacityto buy powerElectrification numbers haveimproved but the quality ofsupply is questionable
INSIGHTSSurplus generation capacity but deficits continue, capacity utilisation decliningTwo years ago, the central government announced that India has become a power surplus country,and all the villages have been electrified. However, since then, several issues have come up in thesector, and a few others remain to be addressed.The country continues to face both energy deficit and peak deficit, although at a marginal level. In2017-18, energy deficit in the country was 0.7%, and peak deficit was 2%. However, the deficitsituation is exaggerated in certain states, and the north-eastern region, in particular.The capacity utilisation of thermal power plants (also called Plant Load factor or PLF) has declinedfrom 78% in 2009-10 to 61% in 2018-19. Low PLF implies that thermal plants have been lyingidle, which could be due to non-availability of fuel, surplus capacity (in certain regions of thecountry), low demand for power, or demand being met through other sources. One of the keyreasons behind poor capacity utilisation of thermal power plants is the planned shift in the energymix. With renewable energy seeing a push through government policies, its tariff has decreasedsignificantly. This poses a challenge to the existing thermal capacity, which is witnessing subdueddemand, and poor capacity utilisation as a consequence. The renewable energy market is stilldeveloping. However, its growth trajectory may affect the thermal sector, where plants are alreadyoperating at lower capacities and facing insolvency, in certain cases.Capacity to buy still remains weak as discoms are in poor financial healthThe poor financial health of discoms has a significant impact on the power sector. Their poorfinances imply that they are unable to buy power, and invest in the transmission and distributioninfrastructure (including investment for renewable energy). This affects retail consumers andpower producers. Consumers do not get good quality of power, and power producers are unable tosell power in the market, thereby facing losses, and default on their loans.As per the Standing Committee on Energy, as on June 2017, there were 34 stressed thermal powerplants with an outstanding debt of Rs 1.74 lakh crore. These thermal power plants are becomingNPAs due to non-availability of coal at power plants, lack of long term power purchase agreementswith discoms, and failure of discoms in making timely payments. With respect to renewableenergy, the rapidly falling price of power generation due to technological advancements may poserisk to projects which were set up earlier at higher costs. As per the Ministry of Power, theaggregate overdue of discoms to all generators is Rs 54,599 crore, as on July 31, 2019.While UDAY addressed the outstanding debt of discoms partially, they have not been able toachieve all the goals they were mandated to, under the scheme. Aggregate Technical andCommercial Losses (includes theft and billing issues) are at 20%, as opposed to the target of 15%by 2018-19. The gap between cost of supplying power and the average revenue realised is Rs0.25/unit, as opposed to the target of being eliminated. Note that one of the key reasons for thisrevenue gap is the under-pricing of tariff for agricultural and residential consumers. Further, theRBI has noted that UDAY will increase the liabilities of the states, who are taking on the losses ofthe state discoms.Rural electrification numbers have improved, but the quality of supply is questionableIn April 2018, the central government announced that all villages have been electrified. Under theSaubhagya scheme, 18,374 households remain to be electrified as on March 31, 2019. However,continuous supply of electricity continues to remain a challenge. Data also shows that about 53%of the villages receive electricity for less than 12 hours in a day for domestic use. Further, supply torural areas has to be carried out by discoms, many of which are in poor financial health.
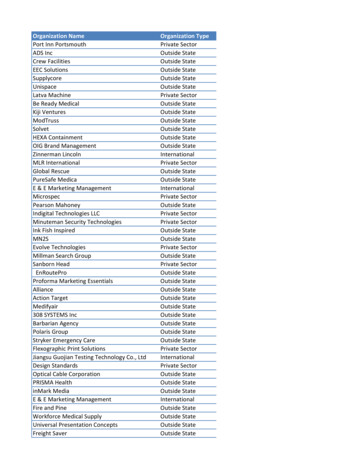
OVERVIEW OF THE POWER SECTORWith India looking at rapid industrialisation and urbanisation over the next three decades, thedemand for power in the country is going to increase. The power generation situation in thecountry has improved in the last few years. In June 2017, the Minister of Power announced thatIndia has become a power surplus country, with no shortage of electricity or coal.1 Currently, Indiaproduces a majority of its energy from thermal sources. However, with the commitment to theParis Agreement (on climate change), there has been a push towards increasing the renewablegeneration capacity in the country. With solar and wind power becoming cheaper, cleaner sourcesof energy have also become affordable.However, the sector continues to face several issues. Access to power and the quality of powersupplied to consumers is still poor. India also continues to face both energy deficit (0.7%) and peakdeficit (2%). The deficit situation is worse in certain states such as Jammu and Kashmir, and thenorth-eastern states. Further, data shows that, in 2018, about 53% of the villages receivedelectricity for domestic use for less than 12 hours in a day.2 Despite all villages being electrified,continuous supply of electricity continues to remain a challenge.Another key issue is the poor financial health of the electricity distribution companies, which isaffecting their ability to buy power and improve the supply network. While their debt to banks wasaddressed to a certain extent by UDAY, the debt they owe to power plants is also a concern. As perthe Standing Committee on Energy, as on June 2017 (post-UDAY period), there were 34 stressedthermal power plants with an outstanding debt of Rs 1.74 lakh crore.3These trends suggest that surplus power capacity, or electrifying villages may not imply continuous,and good quality power supply across the country. In the first budget of the 17th Lok Sabha, thecentral government mentioned that a package of power sector tariff and structural reforms will beannounced soon. In this context, this note looks at how the power sector is regulated, current statusof the power sector, key issues in the sector, recommendations on reforming the sector, and recentpolicy developments in the sector.POWER SECTOR IN INDIAThere are three primary segments in the electricity sector: generation, transmission and distribution.Generation is the process of producing power using different fuels and is carried out in generatingstations (generation plants). Transmission utilities carry bulk power from the generation plants tothe distribution substations through a grid and at high voltages. Distribution utilities supplyelectricity from the substations to individual consumers through a distribution network.Distribution is the retail stage and operates at lower voltages. Figure 1 shows the overall structureof the power sector.GenerationIn India, various sources of energy are used to generate power. These include coal, natural gas,hydro, nuclear, and renewable (includes solar, wind, small hydro, biomass). As on December 2018,the power generation capacity of the country is at 349 GW.4 In the last two decades, India’sgeneration capacity has increased considerably. This increase is attributed to the delicensing ofpower generation in 2003, which enabled unrestricted participation of private sector companies.Today, private utilities generate 46% of the power in the country, followed by state utilities (30%),and central generating utilities (24%).2
Figure 1: Structure of the power sectorGenerationplantsEnergysourcesTransmission ecostDistributionutilitiesGeneration Transmission distribution O&M costs depreciation taxesSmall consumersBulk consumersFlow of energy/ powerCharges/ TariffCoal accounts for a majority of power generation at 55%. Overall thermal power generation(including coal, and natural gas) is at 64%. Renewable energy accounts for around 21% of the totalgeneration capacity. Hydro power accounts for 13% of generation and nuclear for 2%. Details ofall-India power generation capacity are provided in Figure 2 and Table 1 below. Power sector is thelargest user of coal. In 2017-18, 576 MT of coal was dispatched to the power sector (84% of thetotal coal dispatched in the country).5Figure 2: All India power generationcapacity (as on January 2019)13%Figure 3: Grid interactive renewable powercapacities (as on January 2019)2%6%13%47%21%64%ThermalRenewableHydroSources: Ministry of Power; PRS.34%Wind PowerBio PowerNuclearSolar PowerSmall Hydro PowerSources: Ministry of New and Renewable Energy; PRS.Table 1: Installed generation capacity in MW (as on January 2019)ThermalCoalTotalcapacity% of 2%63.9%1.9%13.0%21.2%100%Sources: Ministry of Power; PRS.Note: Small Hydro, and Hydro projects are classified as Renewable Sources.3
Renewable energyRenewable energy sources include wind, solar, bio power, and small hydro power. In March 2019,the Union Cabinet announced that hydro power projects will be also classified as renewable energyprojects.6 Renewable sources could either be connected to the grid, or be off-grid systems. Offgrid systems help in meeting the energy requirements of remote areas, and areas which are notlikely to be electrified in the near future. Examples of off-grid systems include biomass-based heatand power projects, industrial waste-to-energy projects, and solar roof-top systems.As of January 2019, the total grid-interactive renewable power capacity (excluding hydro) is at 74GW.7 Hydro capacity is at 45 GW. The government has set a target of installing 175 GW ofrenewable energy capacity by 2022 (excluding hydro).8 This includes 100 GW from solar, 60 GWfrom wind, 10 GW from bio-power and 5 GW from small hydro power.9 Roughly, this wouldtranslate into an average capacity addition of about 33 GW every year till 2022. Currently, thecapacity addition is at around 24 GW per year. Note that wind and solar power have a lower plantload factor (PLF) than thermal power given the intermittent wind speed and sunlight, oftenaveraging at 20-25%. Therefore, renewable capacity addition needs to be higher than for thermalplants to generate the same amount of electricity.Figure 4 below shows the mode-wise electricity generation across several countries. Coal continuesto be the primary source of electricity in several countries. Few countries such as Brazil andCanada generate most of their electricity from cleaner sources of energy such as hydro power.Several countries such as Japan, Russia, UK and the US also generate a significant amount of gasbased power, which is cleaner as compared to coal.Figure 4: Gross electricity generation in various countries mode-wise nited StatesUnited KingdonSouth ilAustralia0%OthersSources: Central Electricity Authority; PRS.TransmissionTransmission is carried out primarily by central and state companies and largely remains agovernment controlled activity. The transmission segment was separated from the centralgeneration agency in 1989 and Power Grid Corporation of India (Powergrid) was set up. Powergridis responsible for the planning, implementation, operation and maintenance of inter-statetransmission system, and the operation of national and regional power grids.The Electricity Act, 2003 allows for open access which enables consumers to buy power from anypower generating plant through non-discriminatory access to transmission and distribution lines, in4
a manner specified by the respective state/state regulator. The National Load Despatch Centre(NLDC) manages the scheduling and dispatch of electricity over inter-regional links in accordancewith grid standards, and monitors the national transmission grid. It is also the nodal agencyproviding transmission access to the power exchanges. The Regional Load Despatch Centres(RLDCs) manage the operation of the power system grid in the respective regions.India’s transmission lines have grown at an average annual rate of 6.5% between 2007 and 2019(till March 2019); substation capacity has grown during the same period at 11.2%.10,11 Interregional transmission capacity has grown from 14 GW in 2007 to 95 GW till January 2019.12DistributionDistribution includes maintenance of the distribution network and retail supply of electricity to theconsumers. It is mostly carried out by state-owned distribution companies (discoms). However, incities such as Delhi, Mumbai, Ahmedabad, and Kolkata, private entities own the distributionbusiness. Discoms (or distribution licensees) purchase power from generation companies throughpower purchase agreements (PPAs), and supply it to their consumers (in the area of distribution).One of the key issues with the power sector currently is the poor financial situation of statediscoms. This has been affecting their ability to buy power for supply, and the ability to invest inimproving the distribution infrastructure. Consequently, this impacts the quality of electricity thatconsumers receive.Power consumptionIndia’s per capita power consumption was 1,149 kWh as on March 31, 2018.13 This consumptionhas increased at an average annual rate of 4.6% since 1990. However, it is much lower ascompared to several other countries (see Figure 5). Across different categories, the consumption bythe agriculture sector in India is higher as compared to other countries. On the other hand, in India,the consumption by the commercial sector is lower as compared to other countries (see Figure 6).Figure 5: Per capita power consumption in 2015 (in kWh)16,00012,0008,0004,000Sources: Central Electricity Authority; PRS.5WorldIndia*USAUKSouth ilAustralia0
Figure 6: Category-wise consumption across countries (in 2015)100%80%60%40%20%0%Australia BrazilCanada China Germany ussiaSouth United UnitedAfrica Kingdon StatesIndiaWorldCommercial and public servicesSources: Central Electricity Authority; PRS.Coal linkages and purchase of powerCoal linkagesIn May 2017, the Ministry of Power announced a new scheme for coal linkages for thermal powerplants – Scheme for Harnessing and Allocating Koyala (Coal) Transparently in India (SHAKTI).14Prior to this, coal was supplied to thermal power plants as per the National Coal Distribution Policy,2007 (NCDP). Under this policy, a Standing Linkage Committee (under the Ministry of Power)recommended the issuance of Letters of Assurance (LoAs) to power plants. LoA holders that metcertain milestones were entitled to enter into Fuel Supply Agreements (FSAs) with coal companiesfor the long-term supply of coal. The new scheme SHAKTI, proposes to move towards an auctionbased system for allocation of such linkages (except for central and state generation companies, andcertain exemptions provided in the Tariff Policy, 2016).Under the scheme, thermal power plants with LoAs will be eligible to sign FSAs after ensuring thatthe plants are commissioned, respective milestones are met, and all specified conditions of the LoAare fulfilled within a specified timeframe. The plants must be commissioned before March 31,2022. The linkages will be granted by Coal India Limited (CIL) or Singareni Collieries CompanyLimited (SCCL). Future coal linkages will be granted as per the following:i.Central and state generating companies: On the recommendation of the Ministry of Power;ii.Independent power producers with Power Purchase Agreements (PPAs) (based ondomestic coal): On the basis of auction;iii.Independent power producers without PPA: Auction where bidding for linkage will bedone over the Notified Price of Coal Company.Power Purchase Agreements (PPAs)PPAs are bilateral contracts between the procurers (discoms) and the generators (power plants).Each PPA has specific terms and conditions setting out the rights and obligations of the generatorsand the procurers. This includes the price at which electricity would be purchased, the mechanismfor adjustment of tariffs for select events, mutually agreed conditions for risk sharing andtermination of the PPAs. Typically, PPAs tend to be long-term in nature, i.e., around 20-25 years.6
REGULATORY STRUCTUREWith growth in the industrial and services sector in the 80s and the 90s, the power sector haschanged significantly. Regulatory changes during this period sought to increase private sectorparticipation in the sector, and bring in more competition and efficiency (more details in Table 2).This resulted in the state owned electricity boards being restructured. The generation segment wasdelicensed, and gradually witnessed increased private participation. Independent regulators wereset up at both the central and state level, and Appellate Tribunals were established to hear appealsagainst these commissions.Currently, the Electricity Act, 2003 is the primary law regulating the electricity sector. 27 StateElectricity Regulatory Commissions (SERCs), and the Central Electricity Regulatory Commission(CERC) regulate inter-state and intra-state matters in generation, transmission, trading anddistribution of power. One of the key roles of the Commissions (typically SERCs) is to approve thetariff for retail sale of electricity.Tariff determination: Typically, electricity tariff consists of two parts: (i) Fixed Cost, and (ii)Variable Cost. It is also called as Two Part Tariff.15 Fixed cost includes interest, depreciation,operations and maintenance costs, return on equity (profit) and tax liabilities of power generation,transmission and distribution network. The variable cost primarily includes fuel cost (cost ofelectricity purchased from other utilities, cost of power lost in transmission and distribution, andstate levies such as surcharge, tax are also included in certain cases). Discoms/ utilities are requiredto file their tariff petitions (annually) with the relevant SERC, who then approves such tariff basedon the specified criteria.However, it has been observed in the past that state discoms do not necessarily work on marketprinciples, i.e., they do not price electricity to cover costs and reasonable profit. Many state-owneddiscoms did not file tariff revision petitions for multiple years from 2003 to 2011.16 State discomsin states such as Bihar, Karnataka and Punjab did not revise their tariff between 2008 and 2011, inspite of an increase in the cost of electricity. During the same time period, the cost of power supplyin these states went up by 12%, 10%, and 29% respectively. In 2011, the Appellate Tribunal forElectricity passed a judgment requiring SERCs to ensure that tariffs are revised in a timely mannerby discoms. Following the judgement, it was observed that between 2012 and 2014, more than 20states revised their tariffs.17Competition in retail supply of electricity: The 2003 Act also provides for multiple distributionlicensees to set up their own parallel network in the same area, thus allowing competition in thedistribution segment.18, Parallel licensing is when multiple licenses are issued to distributioncompanies to supply electricity in a specific area of supply. However, the distribution segment hasnot seen much private participation (barring a few areas like Mumbai, and Delhi). Setting up of anew network requires significant capital investment and has acted as an entry barrier for newparticipants.Recently, there have been proposals to bring in more private sector participation in the powerdistribution segment. The Electricity (Amendment) Bill, 2014, (which has now lapsed), andsubsequent draft amendments proposed by the Ministry of Power, have proposed furtherrestructuring of the distribution segment to bring in competition. As per the proposed framework,the distribution business will be segregated into the supply and network business. Consumers willhave the choice to buy electricity from multiple power suppliers, as opposed to buying from a singledistribution company currently. The discoms will maintain the retail networks which will be usedby the supply companies on payment of usage charges.7
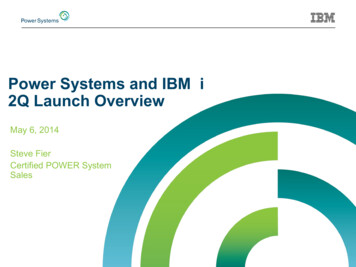
Figure 7: Key stakeholders in the power sectorEnergy sourcesCoal (including lignite) isthe primary source ofpower (57%).Majority coal produced byCIL (84% in 2017-18).Coal linkages allocatedby CIL through auction(SHAKTI).Tariffs are not regulated.Prices determinedthrough y generation bythermal sources (64%).Powergrid (central grid)Almost all distributioncompanies are stateowned.46% of thermalgeneration capacity iswith private companies.State transmission utilitiesPrivate companies insome areas - Delhi,Mumbai.24% generation capacityis with central sectorcompanies. In 2018-19,among the central sectorcompanies, NTPCgenerated 73% of power.Table 2: Developments in the power sectorYearTariffs regulated bySERCs.Key developments1948Electricity Supply Act, 1948: Created state-level vertically integrated utilities responsible for powergeneration, transmission, and distribution, and for setting tariffs.1919911948 Act amended to allow private companies to set up their power generation plants.1996-98Some states (Odisha, Haryana) started restructuring their state electricity boards. Restructuringincluded segregating generation, transmission, and distribution segments, and allowing privateparticipation in the distribution segments.1998Established Regulatory Commissions at both the central and state levels through the ElectricityRegulatory Commission Act, 1998. These Commissions regulate inter-state and intra-state matters ingeneration, transmission, and distribution of power.2003Electricity Act, 2003: Gave more powers to the Regulatory Commissions; provided for unbundling of thestate owned electricity boards and multiple discoms in an area; allowed open access; provided forelimination of cross-subsidies in the sector. The 1948 Act, and 1998 Acts were repealed.2014Electricity (Amendment) Bill, 2014 to segregate retail supply from distribution, and bring in multiplesupply licensees.2015-2017As of March 2015, the state discoms had accumulated losses of approximately Rs 3.8 lakh crore andoutstanding debt of approximately Rs 4.3 lakh crore. The Ujwal Discom Assurance Yojana (UDAY) wasintroduced to allow states to help the discoms by taking over their debt.2017 - nowIndia declared as a power surplus country. All villages have been electrified. New householdelectrification scheme, Saubhagya, launched. Draft amendments to the 2003 Act propose to segregatethe network and supply business, and introduce a system of direct benefit transfers with regard tosubsidies. Coal linkages are being allocated through auction (SHAKTI).Sources: Electricity Regulatory Commission Act, 1998; Electricity Act, 2003; 14th Report: Transmission andDistribution Systems and Networks, Standing Committee on Energy; Power Sector Reforms in Odisha: Major Issuesand Challenges, Government of Odisha; PRS.8
ISSUES IN THE POWER SECTORWhile the overall power situation in the country has improved, several issues still remain. Thefollowing sections look at the issues within each segment of the sector.GENERATIONPeak deficit continues to persistGeneration capacity has increased over the years. Thermal generation capacity has had an averageannual growth of 7% between 2005-06 and 2018-19. However, the country continues to face apeak deficit of 2%. This implies that in 2017, while the available capacity was 330 GW, the entirepeak demand of 164 GW could not be met. This deficit situation is more pronounced in certainregions and states (see Figure 10 and Figure 11).Figure 8: Total installed generation capacity (in 7919741969196619611956195019470Note: Generation figures are for the end of the financial year.Sources: Central Electricity Authority; PRS.Figure 9: Power deficit in India10%5%0%-5%-10%-15%Energy deficit* Anticipated surplusSources: Central Electricity Authority; PRS.9Peak 1-92-25%1990-91-20%
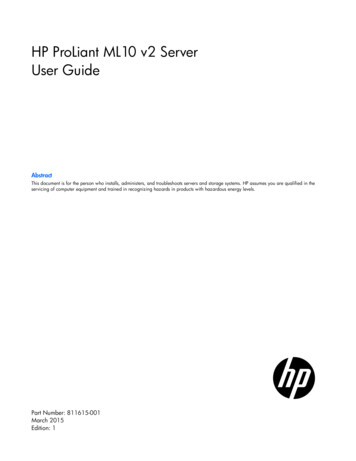
Figure 10: Region-wise power deficit (2017-18)In 2017-18, energy deficit in thecountry was 0.7%, and peak deficit was2%.20 However, for 2018-19, theCentral Electricity Authority hasprojected an energy surplus of 4.6%and peak surplus of 2.5%.2%0%-2%-4%-6%-8%The deficit situation is worse in certainstates such as Jammu and KashmirNorthernWesternSouthernEasternNorth(both energy and peak deficit are atRegionRegionRegionRegionEastern20%), and the north-eastern states (theRegionregion saw energy deficit of 2.8%, andEnergy deficitPeak deficitpeak deficit of 4.1%). Further, certainSources: Central Electricity Authority; PRS.states such as Chhattisgarh, Odisha,and Uttar Pradesh continue facing high peak deficit despite having significant generation capacity.These states have generation capacity of 13.5 GW, 7.6 GW, and 25 GW respectively, and peakdeficits at 6.8%, 5.4%, and 10.9% respectively.-10%West BengalUttar PradeshUttarakhandTripuraTelanganaTamil alayaManipurMaharashtraMadhya PradeshKeralaKarnatakaJharkhandJammu & KashmirHimachal achal Pradesh0%Andhra PradeshFigure 11: State-wise deficit (as on January 2019)-5%-10%-15%-20%-25%Sources: Central Electricity Authority; PRS.Energy DeficitPeak DeficitCapacity utilisation of thermal power plants has been decliningWhile generation capacity has been steadily increasing, the capacity utilisation of thermalpower plants (also called Plant Load factor or PLF) has declined from 78% in 2009-10 to 61%in 2018-19.21 Among the three types of generators (in terms of ownership), the private andstate ones have poorer PLF as compared to the central ones. Table 3 shows details of PLFacross the different types of generators.The High Level Empowered Committee (HLEC) on Stressed Assets (2018) noted that in thelast six years, 110 GW of generation capacity has been added, of which 100 GW is from coalbased plants. However, the demand has not increased at the same pace. Consequently, theavailable capacity is more than the demand and peak power shortage has reduced. Therefore,large capacity is lying underutilised.Low PLF implies that thermal plants have been lying idle, which could be due to nonavailability of fuel (gas or coal), surplus capacity (in some parts of the country), or demand forpower being low, or demand being met through other sources. Thermal plants requiresignificant fixed costs, and they incur such costs even when the plant is lying idle. Therefore, itmay be pertinent to look at current capacity utilisation when estimating the future thermalcapacity growth.10
Figure 12: Plant load factor (in %)Table 3: Sector-wise PLF (in 62014-152013-142012-132011-122010-112009-100%* indicates provisional numbers (till January 2019)Sources: Ministry of Power; 5856* indicates provisional numbers (till January 2019)Sources: Ministry of Power; PRS.Energy mix needs to be balanced for efficient capacity utilisationThe Standing Committee on Energy (2017) had noted that inefficient capacity utilisation is due toseveral issues in the power sector.22 Firstly, while there is enough generation capacity, the poorfinancial condition of discoms is resulting in suppressed demand for power, which leads to lesserutilisation of capacities.Secondly, the substantive fall in solar tariff and its very low gestation period is posing a threat to theeconomic viability of thermal power plants. While growth in solar energy is a good sign for thecountry, thermal energy has been the primary source for the power sector, and will continue toremain an important source of power in the future. Further, given that renewable energy sourcesare intermittent in nature, a balancing power will be needed to support the grid and even out thefluctuations. For example, if solar energy is being used in an area, it will require an alternate sourcefor the night time requirement. This balancing power could come from gas or hydro based power.As gas is a scarcely available resource, hydro power becomes a more obvious choice.Thirdly, the share of hydro power has reduced from 25% in 2007-08, to about 13% in 2018-19.Harnessing hydro potential will also improve the power situation in the north-eastern states,Uttaranchal, Himachal Pradesh and Jammu and Kashmir, since a large proportion of hydro powerpotential is located in these states. It would also help boost economic growth in these states.Therefore, the Committee recommended that the growth of various sectors should be such that theycomplement one another in maintaining a balanced energy mix.Renewable market is still developingRenewable energy sources are not evenly spread about the country. The NITI Aayog had observedthat electricity buyers in renewable poor states are relatively less willing to purchase renewableelectricity due to higher costs than the conventional sources.23 On the other hand, discoms inrenewable rich states have indicated that they would support additional renewable deploymen
There are three primary segments in the electricity sector: generation, transmission and distribution. Generation is the process of producing power using different fuels and is carried out in generating stations (generation plants). Transmission utilities carry bulk power from the generation plants to the