Transcription
HindawiJournal of Nutrition and MetabolismVolume 2020, Article ID 3670895, 12 pageshttps://doi.org/10.1155/2020/3670895Research ArticleOvernutrition and Associated Factors: A ComparativeCross-Sectional Study between Government and Private PrimarySchool Students in Gondar Town, Northwest EthiopiaMohammed Sied Ali,1 Chanyalew Worku Kassahun,2 and Chalachew Adugna Wubneh11Department of Pediatrics and Child Health Nursing, School of Nursing, College of Medicine and Health Sciences,University of Gondar, Gondar, Ethiopia2Department of Comprehensive Nursing, College of Medicine and Health Sciences, University of Gondar, Gondar, EthiopiaCorrespondence should be addressed to Chalachew Adugna Wubneh; mekidem21@gmail.comReceived 10 April 2020; Revised 14 September 2020; Accepted 17 September 2020; Published 1 October 2020Academic Editor: Abdah Md AkimCopyright 2020 Mohammed Sied Ali et al. This is an open access article distributed under the Creative Commons AttributionLicense, which permits unrestricted use, distribution, and reproduction in any medium, provided the original work isproperly cited.Introduction. Childhood overnutrition is a public health problem in low- and middle-income countries because its effect is likelyto progress into adulthood that results in developing noncommunicable diseases at a younger age. There is no such previouscomparative study that investigated this issue. Therefore, the aim of this study is to assess the prevalence and associated factors ofovernutrition among government and private primary school students in Gondar town, northwest Ethiopia. Methods. Institutionbased comparative cross-sectional study was conducted from March 5 to April 9, 2019. A multistage sampling technique was usedto select 736 participants. Data were collected through face-to-face interview. Data was entered into EPI-info version 7.2.1.0 andexported to SPSS version 20 for analysis. Bivariable and multivariable logistic regressions were carried out to identify associatedfactors with overnutrition. Statistical significance was declared using p value 0.05. Results. The overall prevalence of overnutrition was 9.1%. The prevalence was higher among private schools (51 (14%)) than government (16 (4.3%)). Eating habit whilewatching television (AOR 4.08, 95%CI: 1.10–15.16) and not having close friend (AOR 3.72, 95%: CI: 1.21–2 11.48) weresignificantly associated with overnutrition in the government schools, while no father education (AOR 2.59, 95%:CI:1.05–6.39),sweet food preference (AOR 2.86, 95%:1.19–6.87), fat consumption more than three days per week (AOR 3.79, 95%CI:1.61–8.91), eating habit while reading (AOR 4.95, 95%CI:2.29–10.70), and vigorous-intensity sports (AOR 2.23, 95%:1.02–4.86) were associated with overnutrition in private schools. Conclusion. Prevalence of overnutrition was higher amongprivate than government schools. Hence, it requires attention through creating awareness about healthy diet, healthy lifestyle, andphysical activity in collaboration with health and education sectors.1. IntroductionOvernutrition is defined as abnormal or excessive accumulation of fat in the adipose tissue that may affect thehealth status of individuals. It is the sum of overweight andobesity [1]. World Health Organization (WHO) definesoverweight as body mass index (BMI) for age, Z-score between 1 and 2 standard deviation (SD), and obesity asBMI for age and Z-score 2 SD [2]. The prevalence ofovernutrition among children and adolescents (aged 5–19)has risen dramatically from 4% in 1975 to just over 18%; over340 million children and adolescents aged 5–19 wereoverweight or obese worldwide in 2016 [3]. Overweight andobese children are more likely to stay obese into adulthoodand more likely to develop chronic diseases like diabetesmellitus, hypertension and coronary artery disease at ayounger age, and increased future risks of breathing difficulties, fractures, insulin resistance, cancer, asthma, andpsychological comorbid effects [4]. In addition, overnutrition is related to more deaths worldwide than undernutrition. Over 71% of all deaths globally are due tononcommunicable diseases (NCD) [4].
2Lifestyle and diets of children from urban areas make itsufficiently more risky to be overweight compared tochildren living in deprived rural environments [5]. Anotherchallenging issue related to overnutrition is poor schoolperformance of the students in their academic score [6].Many studies emphasized the positive relationship betweenobesity and poor school performance [7]. Childhoodobesity can profoundly affect children’s physical, social,and emotional well-being. It is also associated with a lowerquality of life experienced by the child [8]. A study in Africaand other developing countries has documented anemerging trend of malnutrition with overweight andobesity increasing at an alarming rate in comparison toundernutrition [9].This shifting comes with increased access to high-calorie foods and less strenuous jobs resulting in many individuals having a positive energy balance and hencebecoming overweight or obese [10]. In Sub-Saharan Africa,most nutrition efforts have focused on undernutritionamong children, but the focus is low on overnutrition [11].Globalization, improving economic conditions, andchanging dietary habits in developing countries are reported as responsible for the rapid increase in overnutrition[12].Factors contributing to overnutrition are foods that arehigh in fats, sugars, energy-dense foods, and increasing lowintensity activity due to new modes of transportation andrapid urbanization, which continue to dramatic changes inliving environments as well as in diets and lifestyles thatpromote positive energy balance [13]. The coexistence ofundernutrition and overnutrition also known as doubleburden of malnutrition (DBM) is a recent emerging nutritional problem stated in low- and middle-income countries like Ethiopia [14].However, the federal ministry of health and otherorganizations like Ethiopian public health institute andEthiopian nutritional institute tried to disseminate theinformation in different media and health institutionsabout healthy eating habit and regular physical activity toreduce the burden of nutritional problems, butthe problem is shifting from undernutrition to overnutrition. Even if there were some studies about overnutrition among children in Ethiopia, but there is limitedstudies in epically comparing burden of overnutritionamong private and governmental school children withsignificant economical different population in the sameseating.Therefore, this study was conducted to determine theprevalence and associated factors of overnutrition amonggovernment and private primary school children in Gondartown. The finding of this study will be important to take theappropriate measurement for the problem of the targetedpopulation.2. Methods2.1. Study Design and Period. Institution-based comparativecross-sectional study design was conducted from March 5/2019 to April 9/2019.Journal of Nutrition and Metabolism2.2. Study Area and Population. The study was conductedamong the second cycle (Grades 5–8) primary school students in Gondar town. The town is found 748 km far awayfrom Addis Ababa. Gondar is the fourth largest city inEthiopia with a population of 358,257 people according toGondar town statistics office. Gondar is the city in the centralGondar zone which is in the Amhara region located in theNorthwest part of Ethiopia.2.3. Source Population. It comprises all second cycle (5–8grades) primary school students who were registered in2018/2019 academic year in Gondar town.2.4. Study Population. It comprises all second cycle (5–8grades) primary school students who were selectedrandomly.2.5. Inclusion Criteria. They comprise all primary schoolstudents, whose grades were 5–8 and those students who areunder the age of 18 years.2.6. Exclusion Criteria. They comprise students who werecritically sick during data collection and those who wereunable to communicate verbally.2.7. Sample Size Determination. The sample size for thisstudy was estimated by two methods for the two specificobjectives; lastly, the larger sample was taken, the firstsample size was determined by using a double populationproportion formula by considering the following statisticalassumptions: 95% CI, taking the prevalence of overnutrition,p1 23.0% in private and p2 4.3% in government from theprevious study done in Addis Ababa which was conducted inboth private and government schools (25):n (Zα2 tZnβ)2 (p1(1 p1) p2(1 p2)),(p1 p2)2(1)where p1 is proportion of overnutrition in private,p2 is proportion of overnutrition in the government school,power 0.84, confidence level 1.96, 10% nonresponse rateadded, and design effect 2, and the calculated sample size isequal to 108 for each and total sample size is 216.For the factors, the sample size was calculated using EPIinfo from the factors that are significantly associated withovernutrition in the previous studies to select the factorhaving a maximum possible sample size by using 95%confidence interval and power 80% for all variables.So, the total sample size for this study is 774. Since theratio is one to one, 387 from private and 387 from government schools were selected and participated in the study.2.8. Sampling Procedure. Multistage sampling method wasused to select the study participants. All primary schools (31primary schools) in Gondar town were stratified into government and private schools. Lottery method was used to
Journal of Nutrition and Metabolismselect 40% of the 31 schools based on WHO tools for assessment guideline [15]. Seven schools from 17 governmentschools and 5 private schools from 14 private schools wereselected randomly. From each of the 12 schools, all sectionsof Grades 5, 6, 7, and 8 were separately enlisted and onesection from each grade was selected by lottery method. Atotal of 7,261 children were enumerated from the recruitedschools. Finally, to select 774 study participants, systematicrandom sampling technique was used from the selectedsections. Proportional allocation used the formula ni (n/N) Ni, where n is total sample size to be selected, N is totalpopulation, Ni is total population of each school, andni is sample size from each school.2.9. Data Collection Tools and Procedures. Structured, pretested, and interviewer-administered questionnaire was usedto collect the data. Most of the questions were adapted fromprevious study [16] and physical activity related questionswere adopted from the Global Physical Activity Questionnaire (GPAQ) analysis guide [17]. Dietary related questionswere adopted from the Food and Nutrition Technical Assistance [18].The selected children were well informed about theprocedures. For those well-informed children, a few and toosimple questions were sent to home that would be completedwith their parents (any guardian) and were returned thefollowing day. All the participating students were interviewed at school outside the classroom to keep respondingfreely and correctly. Anthropometric measurement ofweight and height was done using calibrated measuringtools. Height was measured to the nearest 0.5 cm in standingposition at Frankfurt plane with the occipital, shoulder, andthe buttock touching the vertical stand using a stadiometer.Weight was measured to the nearest 0.5 kg using weighingscale while wearing light clothes and shoes. Data werecollected by four BSc nurses and data collectors were supervised by two MSc nurses.2.10. Data Quality Control. The questionnaire was preparedfirst in English and then it was translated to the Amhariclanguage and back to English language. It was reviewed bylanguage experts for consistency of translation of the language and it was reviewed by nutritionists to check itsappropriateness for assessing overnutrition in children. Datacollectors and supervisors were trained for two days aboutthe whole procedures of data collection.The data were collected after pretest was conducted on5% of primary school students other than those included inthe actual study; then ambiguous questions were correctedand unnecessary questions were excluded based on thepretest.The investigators and supervisors had day-to-day on-sitesupervision during the whole period of data collection.Weighting scale was calibrated and placed in level surfacebefore and after each measurement. Continuous checkup ofscales was carried out throughout the data collection. Thecompleteness of the questionnaire was checked before dataentry.32.11. Data Processing and Analysis. Data were first coded andentered using EPI-info version 7.2.1.0 for data explorationand cleaning. The cleaned data were exported to SPSSversion 20 statistical packages for statistical analysis. Descriptive and summary statistic was carried out to describestudy participants according to different characteristics.Independent variables for sociodemographic characteristicssuch as age, monthly family income, and family size wereanalyzed after conversion into categorical variables.Magnitude of overnutrition was determined byimporting age, sex, height, and weight of the participantsinto WHO Anthro-Plus version 1.0.4; then BAZ was imported to SPSS. BAZ status was recoded to overnutrition andnon-overnutrition. The binary logistic regression model wasfitted to identify factors associated with overnutrition. Threemodels were fitted independently, the whole sample (forgovernment, private, and combined), for the governmentschool and for private schools. The model fitness for eachmodel was tested by Hosmer–Lemeshow goodness of fitness,and the results of the test showed that the models were fit foreach three models.To check an interaction or effect modification of theindependent variables, multicolinearity of the independentvariables was checked using the variance inflation factor.There is no multicolinearity among the independent variables. Bivariable associations between dependent and severalindependent variables were examined one by one and thosevariables with p value less than 0.2 were entered to multivariable logistic regression. Multivariable logistic regressionanalysis was employed to identify factors associated withovernutrition by controlling the effect of potential confounding variables. Odds ratio (OR) with 95% CI wascomputed to assess the level of association and statisticalsignificance. Statistical significance was declared using pvalue less than 0.05. The result of this study is described intexts, tables, and graphs.2.12. Ethical Considerations. Ethical clearance was obtainedfrom the institutional review board of University of Gondar.Written informed consent was obtained from a parent orguardian for participants under 16 years old, after informingthem all the purpose, benefit, risk, the confidentiality of theinformation, and the voluntary nature of the participation inthe study. Then assent was obtained from the children.Participation was on voluntary basis and confidentiality wasmaintained to encourage accurate and honest self-disclosure. In addition to ethical clearance support, the latter wascommunicated with all concerned offices.3. Results3.1. Sociodemographic Characteristics of the Parents. A totalof 736 children-parent pairs (50.5% from government and49.5% from private schools) participated in the study with95.09% response rate. The median monthly income of thefamily was 4000 with Inter-Quartile Range (IQR),2000–6000 Ethiopian birr. One-third (33.6%) of children ingovernment schools and approximately half (48.1%) of the
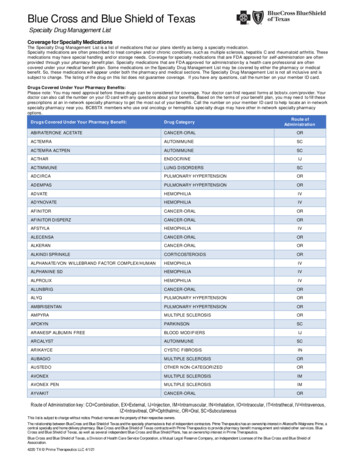
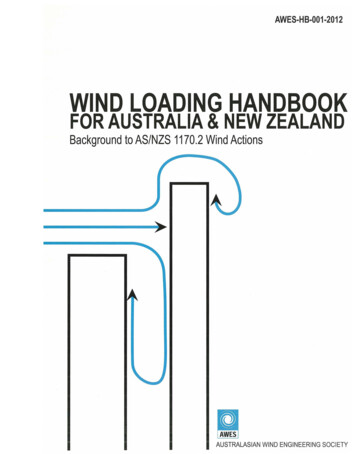
4Journal of Nutrition and Metabolismchildren’s father in private schools attended college andabove level of education (Table 1).3.6. Factors Associated with Overnutrition among PrimarySchool Students3.2. Children’s Sociodemographic Characteristics. Among atotal of 736 children who participated in the study, almosthalf (51.1%) were males and 48.9% were females in government schools. In private schools, 53.3% were femalesand 46.7% were males. The median age of the children was13 years with IQR, 13–15 years. Two hundred seven(55.6%) from government and one hundred fifty-eight(43.4%) from private schools were above 14 years old(Table 2).3.6.1. Factors Associated with Overnutrition among Government Schools. Bivariate analysis was carried out and sixvariables were associated with overnutrition among governmental schools. In multivariable analysis, two of themwere found to be significantly associated. Children who hadno close friend in the school or community were 3.7 timesmore likely to be overnourished as compared to those whohad close friend (AOR 3.72, 95% CI: 1.21–11.47), andchildren who had a habit of eating while watching televisionwere four times more likely to be overnourished as compared to those who had no a habit of eating while watchingtelevision (AOR 4.08, 95% CI: 1.10–15.16).3.3. Dietary Habit and Food Preference-RelatedCharacteristics. Among the total participants, the majority(87.9%) in government schools and 91.5% in private schoolsof the children had breakfast before going to school. Twohundred twenty-five (60.5%) of the children from government and two hundred eighteen (59.9%) from privateschools prefer sweet foods (Table 3).3.4. Physical Activities and Sedentary Lifestyle-RelatedCharacteristics. Among a total of 736 children, 60.5% ingovernment and 62.4% in private schools were involved invigorous-intensity sports outside their school for at least 10minutes, while for moderate-intensity sports 62.9% fromgovernment and 64.0% from private schools were involvedoutside their school for at least 10 minutes. Two hundredninety-eight (80.1%) of the children in government andmajority (86.0%) of the children from private schoolstraveled on foot/rode bicycle for at least 10 minutes(Table 4).3.5. The Overall Magnitude of Overnutrition among PrimarySchool Students in Gondar Town. The overall magnitude ofovernutrition among children in primary schools of Gondartown was 9.1% with 95% CI (7.1–11.1), of which overweightaccounted for 7.6% and obesity accounted for the rest, 1.5%.It was higher in female, 13% (10.6% overweight and 2.4%obese), than male, 5.1% (4.5% overweight and 0.6% obese),children. The comparison of magnitude of overnutritionamong governmental and private school was calculatedseparately. The magnitude of overnutrition was higheramong private school children, 14% (11.8% overweight and2.2% obese), than government school children, 4.3% (3.5%overweight and 0.8% obese) (Figure 1).Comparison of magnitude of overnutrition amonggovernment and private primary school students.The magnitude of overnutrition was higher in the privateschool students, 14%, with 95% CI (10.3–17.6) than thegovernment school, 4.3%, with 95% CI (2.3–6.5). This difference was statistically significant (p value 0.001). Thepercentage of underweight among government school students was higher (37.1%) as compared to the students ofprivate schools (28.2%) (Figure 2).3.6.2. Factors Associated with Overnutrition among PrivateSchool Students. In the bivariate analysis, the factors associated with overnutrition among private primary schoolstudents, children who had father with no formal educationwere nearly 2.6 times more likely to be overnourished ascompared to higher education (AOR 2.59, 95%, CI:1.05–6.39); children who prefer sweet foods were 2.8 timesmore likely to develop overnutrition as compared to thosewho did not prefer sweet foods (AOR 2.86, 95% CI:1.19–6.87); children who had a habit of eating while readingwere nearly 5 times more likely to be overnourished ascompared to those who did not have a habit of eating whilereading (AOR 4.95, 95% CI: 2.23–10.70); those whoconsumed fatty foods more than three days per week were3.9 times more likely to develop overnutrition as comparedto those who consumed fatty foods less than three times perweek (AOR 3.79, 95% CI: 1.61–8.91) and those not involved in vigorous-intensity sports were 2.4 times morelikely to be over nourished (AOR 2.23, 95% CI:1.02–4.86).3.7. Overall Factors Associated with Overnutrition amongPrimary School Students. Children who attended their education in private schools were 3.3 times more likely todevelop overnutrition as compared to government schools(AOR 3.33, 95% CI: 1.58–7.03).Children who prefer sweetened foods were 2.6 timesmore likely to be overnourished as compared to those whodid not prefer sweetened foods (AOR 2.66, 95% CI:1.24–5.72). Eating habit while reading was significantlyassociated with overnutrition (AOR 3.52, 95% CI:1.85–6.70), 3.5 times more likely to develop overnutrition ascompared to those who did not have a habit of eating whilereading. Children who consumed fatty foods more thanthree days per week were 3.5 times more likely to beovernourished as compared to those who did not consumefatty foods (AOR 3.5, 95% CI: 1.60–7.65); those whoconsumed vegetables less than three days per week were 2.5times more likely to develop overnutrition (AOR 2.51, 95%CI: 1.23–5.04) and children who were not involved in vigorous-intensity sports were 2.7 times more likely to beovernourished as compared to those involved in vigorousintensity sports (AOR 2.7, 1.33–5.49) (Table 5).
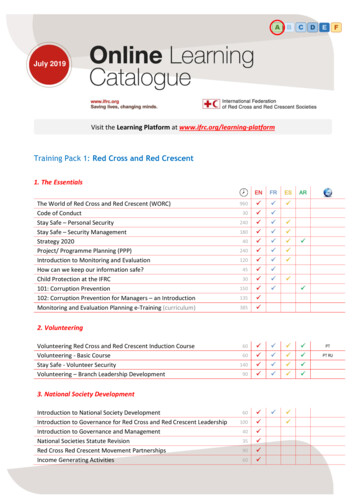
Journal of Nutrition and Metabolism5Table 1: Parents sociodemographic characteristics among primary school students in Gondar town, 2019 (n 736).VariablesResponsePaternal educationMaternal educationOccupation of the head of householdReligionMonthly incomeFamily sizeFamily car ownerUnable to read and writeAble to read and writePrimary school levelSecondary school levelCollege and aboveUnable to read and writeAble to read and writePrimary school levelSecondary school levelCollege and aboveMerchantPrivate employeeGovernment employeeNGODaily antBelow the medianAbove the median 5 5YesNoTable 2: Children’s sociodemographic characteristics amongprimary school students in Gondar town, 2019 (n 736).VariablesSexAgeGradeHaving earsGrade 5Grade 6Grade 7Grade 8YesNoGovernment,Private, n 364n 372Frequency % Frequency 8119592947021.429.732.716.280.819.24. DiscussionThis study revealed the prevalence and associated factors ofovernutrition among government and private primaryschool students in Gondar town. Accordingly, the overallprevalence of overnutrition was 9.1% (7.1–11.1). The schooltype specific prevalence of overnutrition was 14% amongprivate and 4.3% among government schools which showsthere was a significant difference in prevalence of overnutrition among private schools and government schools(p 0.001). The possible explanation for this variation mayGovernment, (n 0026.927273.1267.034693.0Private, (n 57.115642.94512.431987.6be that those students attending private school are fromfamilies having good economic status compared to government school students. For this reason, private schoolstudents may consume foods that expose to obesity andoverweight.The overall prevalence of overnutrition in this study wascomparable with the findings from studies conducted inAddis Ababa, Bole subcity; the overall prevalence of overnutrition among private and government schools was 9.8%[19] and in Lome Togo 7.1% [20] for both government andprivate. The overall prevalence of overnutrition in this studywas slightly lower than studies conducted in Ethiopia: AddisAbaba 12.7% [21], Dire Dawa 20.5% [16], and Jimma town13.3% [22]. This regional discrepancy might be due to environmental variation among the study cities and might bemore urbanized than the study area. It also might be due tovariation in eating habit and lifestyle across the populationamong Ethiopian. In Ethiopia, there are different culturaland religious practices which affect food preference andfeeding habits; this directly affects the nutritional status ofthe children [23].The overall prevalence in this study was also lower thanstudies conducted in Kenya, 19.0% (11); Tanzania, 22.6%(23) and another study in Tanzania, 20.0% [24]; Egypt, 31.2%[25]; Nigeria, 17.4% [9]; China, 17.5% [26] and 20% [27];Ukraine, 17.6% [28]; Iran, 18.1% [28]; and Lithuania, 16.0%[29]. The difference might be due to the socioeconomic,cultural, and lifestyle difference between those countries.This variation could also be due to difference in culture of
6Journal of Nutrition and MetabolismTable 3: Dietary habit and food preference related characteristics among primary school students in Gondar town, 2019 (n 736).VariablesBreakfast intakeNumber of days breakfast intake per weekSnack intakeSnack intake per dayMeal frequency per dayPlace of getting lunchSweet food preferenceFoods bought other than regular mealEating habit while watching TVEating habit while readingMeat/poultry/fishFat/oil consumptionFruit consumption per weekVegetable consumption per weekSoft drink consumption per weekResponseYesNoOnce2–4 days5 and above daysYesNoOnce 2 times1–2 times3 times 4 timesHomeOutside homeDid not use lunchYesNoNot buyBiscuit/chocolateCake/ice creamChipsPotatoCabbageBreadYesNoYesNoNo1-2 times per week 3 times per weekNo1-2 times per week 3 times per weekNo1 day 2 daysNo1-2 days 3 daysNo1-2 days 3 daysphysical activities since there is habit of using on-foot travelin the study area and less exposure to sedentary lifestyle thanother nations due to less access to vehicle as compared toother countries.Children in private primary school had a higher proportion of overnutrition (14%) than that of the children ofgovernment primary schools (4.3%). This finding is supported by the findings of the studies conducted in differentareas of the world: Addis Ababa 16.0% private and 4.3%government [21], Dire Dawa 45.6% private and 11.0%government [16], Bole subcity 8.1% private and government1.7% [19], Kenya 23.6% private and 7.3% government [30],and in another study in Kenya 29.0% private and 11.5%government [11]; in Tanzania, the prevalence was higherGovernment, n .382.220254.317045.75915.931384.115040.31 .9379.918549.715040.35514.820555.111230.1Private, n 052.214439.68022.018651.19826.9among private than government with p 0.021 [31], Egypt57% private and 42.3% but much higher than this study, Iran[28], Mysore city, India14.9% private and 0.2% government[32], and in another study India 27.9% among private andonly 2.45% among government [33]. This discrepancy mightbe because parents with higher socioeconomic backgroundof private school children would expose them for higheradoption of unhealthy dietary habits (energy-dense foods,sweetened foods, and fatty animal products) and sedentarylifestyle due to transportation to and from school by vehiclethan government school children.The associated factors of overnutrition among government schools were eating habit of children while watchingTV. This finding is in line with the study conducted in Addis
Journal of Nutrition and Metabolism7Table 4: Physical activities and sedentary lifestyle-related characteristics among primary school students in Gondar town, 2019 (n 736).VariablesResponseWalk on foot/ride bicycle for at least 10 minNumber of days to walk/ride bicycle per weekVigorous-intensity sports for at least 10 minNumber of days for vigorous sports per weekTime spend for vigorous sports per dayModerate-intensity sports for at least 10 minNumber of days for moderate physical activities/sports per weekTime spend for moderate physical activities/sports per dayMode of transportation to and from schoolSpend free timeTime spent by watching TV/videoTime spend sitting/reading per dayYesNo1-2 days3-4 days 5 daysYesNo1-2 days3-4 days 5 days 30 min30–60 min 60 minYesNo1-2 days3-4 days 5 days 30 min30–60 min 60 minOn footBy vehicleWatching TV/videoPlay mobile gameExtra home activityReading fictionPlaying with friendsGoing to religious area 2 hrs2–3 hrs 3 hrs 3 hrs3–5 hrs 5 hoursGovernment(n 3637.36116.720655.413536.3318.3Private (n 70.50.50.944.538.117.462.631.65.8Overall nutritional status of children58.1%60.0050.0040.0032.70%(%) tritionFigure 1: The nutritional status of primary school students in Gondar town, 2019.Ababa, Bole subcity [19]. Another study conducted in India[34] showed that overnutrition was much higher amongthose who had a habit of watching TV for more than threehours per day and studies in eight European countries statedthat eating habit while watching TV was a significant factorfor overnutrition. It was found that the negative relationship
8Journal of Nutrition and Metabolism70.0058.60% rnmentPrivateFigure 2: The comparison of nutritional status of primary school students in Gondar town, 2019.Table 5: Multivariable
select 40% of the 31 schools based on WHO tools for as-sessmentguideline[15].Sevenschoolsfrom17gov